
Bitcoin/USD daily basis
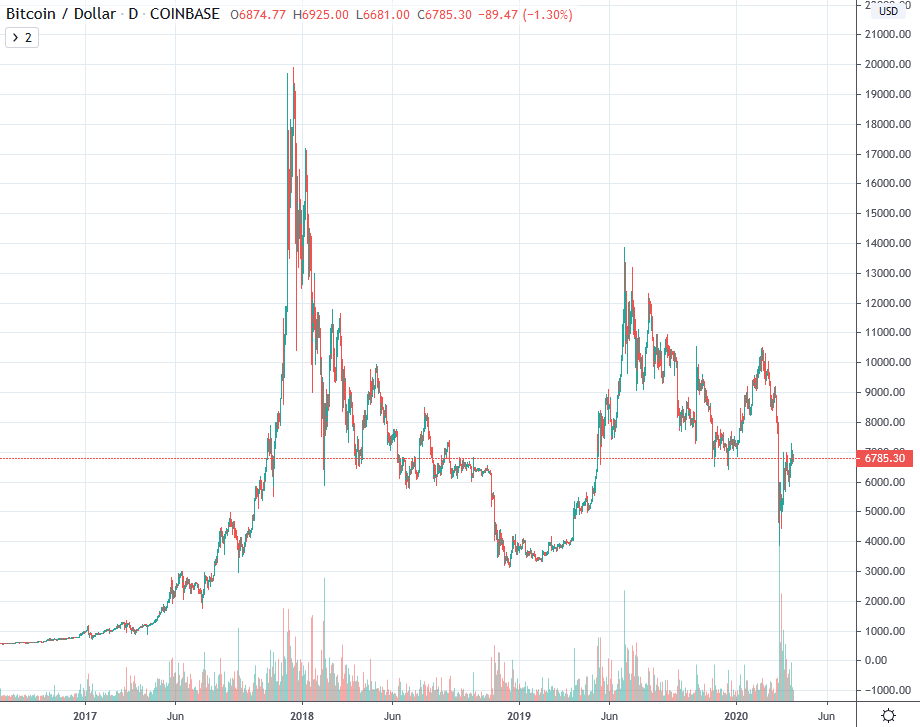
Bitcoin USD - Continuously higher lows
At the beginning of the reporting week, Bitcoin was able to defend the previous Sunday's low of USD 5,900. This was followed on Monday by an upward movement which led to a level of 6'600 USD and just below that marked its daily closing price. In the following days the Bitcoin price was able to move steadfastly away from the USD 6,000 mark. This happened within narrow daily bandwidths, but with consistently higher lows. Although the USD 7,200 was briefly eclipsed on Thursday, this was only an intraday result. Thus, in the following days, the price reached higher lows but also lower highs. The USD 7,000 mark, which had already been reached in the previous week, again served as a resistance this week, which remains in place until Sunday.
Micro-trend still hits the USD 7,000 mark
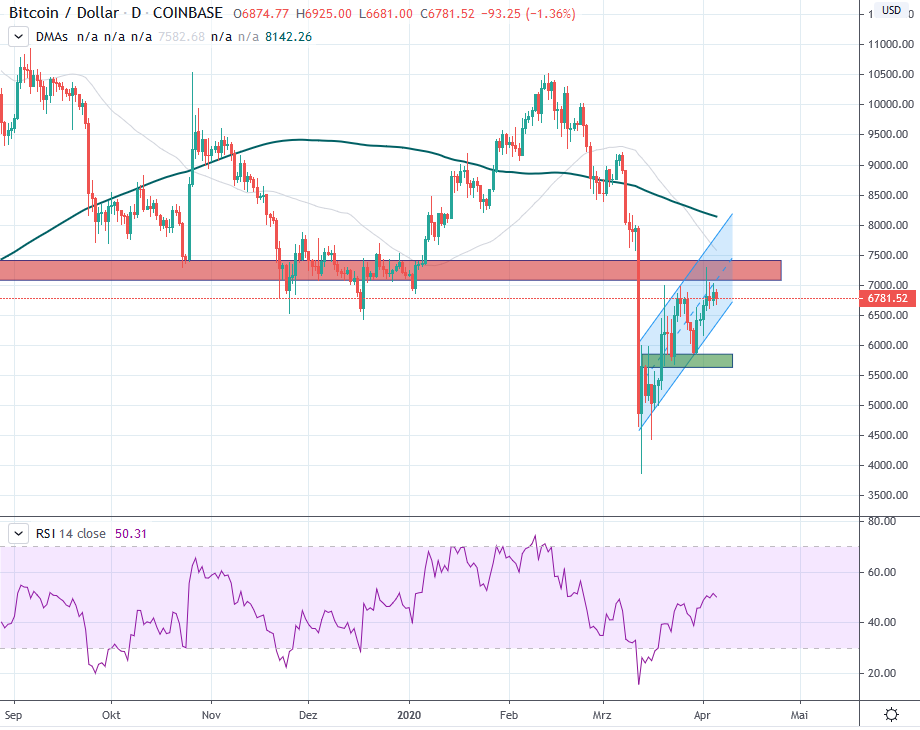
Bitcoin managed to form a pattern of higher lows in the micro-trend after its price drop about three weeks ago. A channel can now be drawn. This countermovement has now been ended for the second time at a strong resistance, which was formed by price movements between November and January 2019, as well as earlier movements (red).
Thus, a "normal" countermovement is still to be assumed after the price drop. Although such movement continued to build on its foundation of higher lows, it failed for the second time at the important resistance zone at USD 7,000.
The strength of the bulls in the micro-trend will therefore soon become apparent. It will be important for the structure of the latest uptrend to respect the new trend channel. At best, the higher lows will continue. The lower trend line of the channel at around USD 6,500 should be respected. The 5'800 to 6'000 USD zone (green) serves as a last support for the young upward-trend. A drifting off increases the probability of a renewed visit to the 5200 - 5'000 USD mark and would represent the capitulation of the fresh trend. As a consequence, even a renewed testing of the USD 3,000 - 4,000 spheres would have to be attributed an increased probability.
Accordingly, resistance can still be seen between USD 7,000 - 7,200. Others can be found in the zone of 7'800 - 8'000 USD. Support is therefore to be found at USD 6,500 and between USD 5,800 and 5,900.
Macro: Chronology of lower highs since the end of 2017
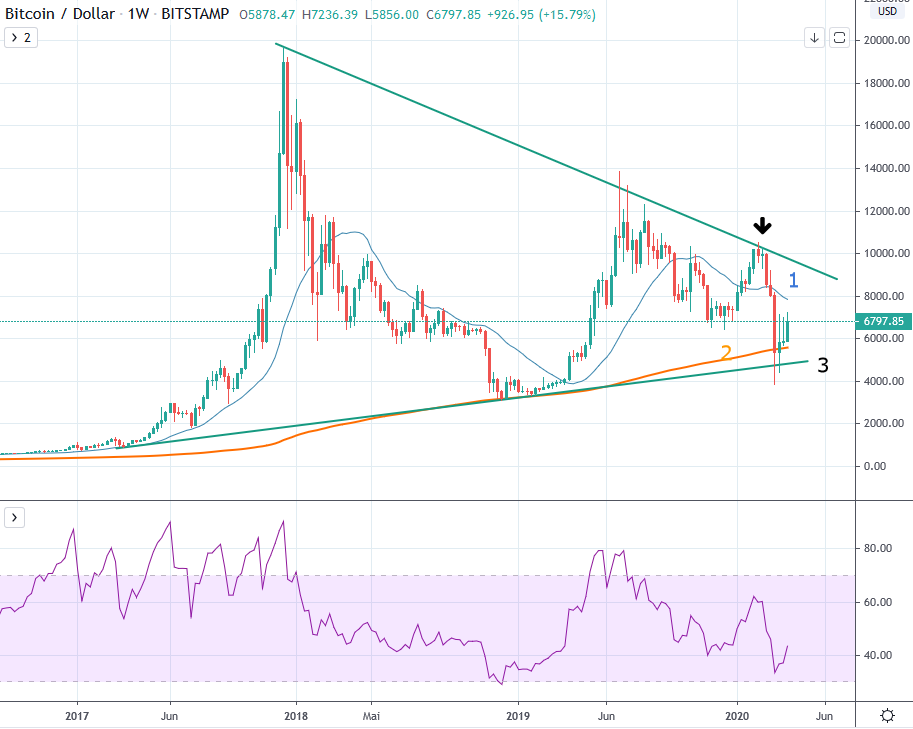
Bitcoin has so far failed to set a higher high in the weekly interval, which would have broken the prevailing bearish trend since December 2017. In its last attempt since the beginning of the year, the upward trend in the relevant zone failed at around USD 10,500. The sharp price correction that has just taken place is further confirmation of the prevailing downward trend.
Bitcoin is now clearly below the 21-week average (1), which in the past often decided about whether bull or bear markets would ensue. The 200-week average (2), which has never been broken since its inception, and the trend line (3) of the lower bandwidth of the uptrend since March 2017 are also being tested. They will serve as further indications of how battered Bitcoin is at present.
The macro picture remains dominated by lower highs since December 2017 in the downward trend. Bitcoin must create a new basis for itself. If the USD 5,000 mark is not maintained, between USD 3,000 and USD 3,500 in support is expected from the bottoming out of early 2018.
The negative macro picture can only be broken in the mid-term if the trend of lower highs since 2017 is sustainably overcome.
Haftungsausschluss
Alle Angaben in dieser Publikation erfolgen ausschliesslich zu allgemeinen Informationszwecken. Die in dieser Publikation zur Verfügung gestellten Informationen stellen keine Anlageberatung dar und sind auch nicht als solche beabsichtigt. Diese Publikation stellt kein Angebot und keine Empfehlung oder Aufforderung für eine Anlage in ein Finanzinstrument einschliesslich Kryptowährungen und dergleichen dar und ist auch nicht als Angebot, Empfehlung oder Aufforderung beabsichtigt. Die in der Publikation enthaltenen Inhalte stellen die persönliche Meinung der jeweiligen Autoren dar und sind nicht als Entscheidungsgrundlage geeignet oder beabsichtigt.
Risikohinweis
Anlagen und Investitionen, insbesondere in Kryptowährungen, sind grundsätzlich mit Risiko verbunden. Der Totalverlust des eingesetzten Kapitals kann nicht ausgeschlossen werden. Kryptowährungen sind sehr volatil und können daher in kurzer Zeit extremen Kursschwanken ausgesetzt sein.


