
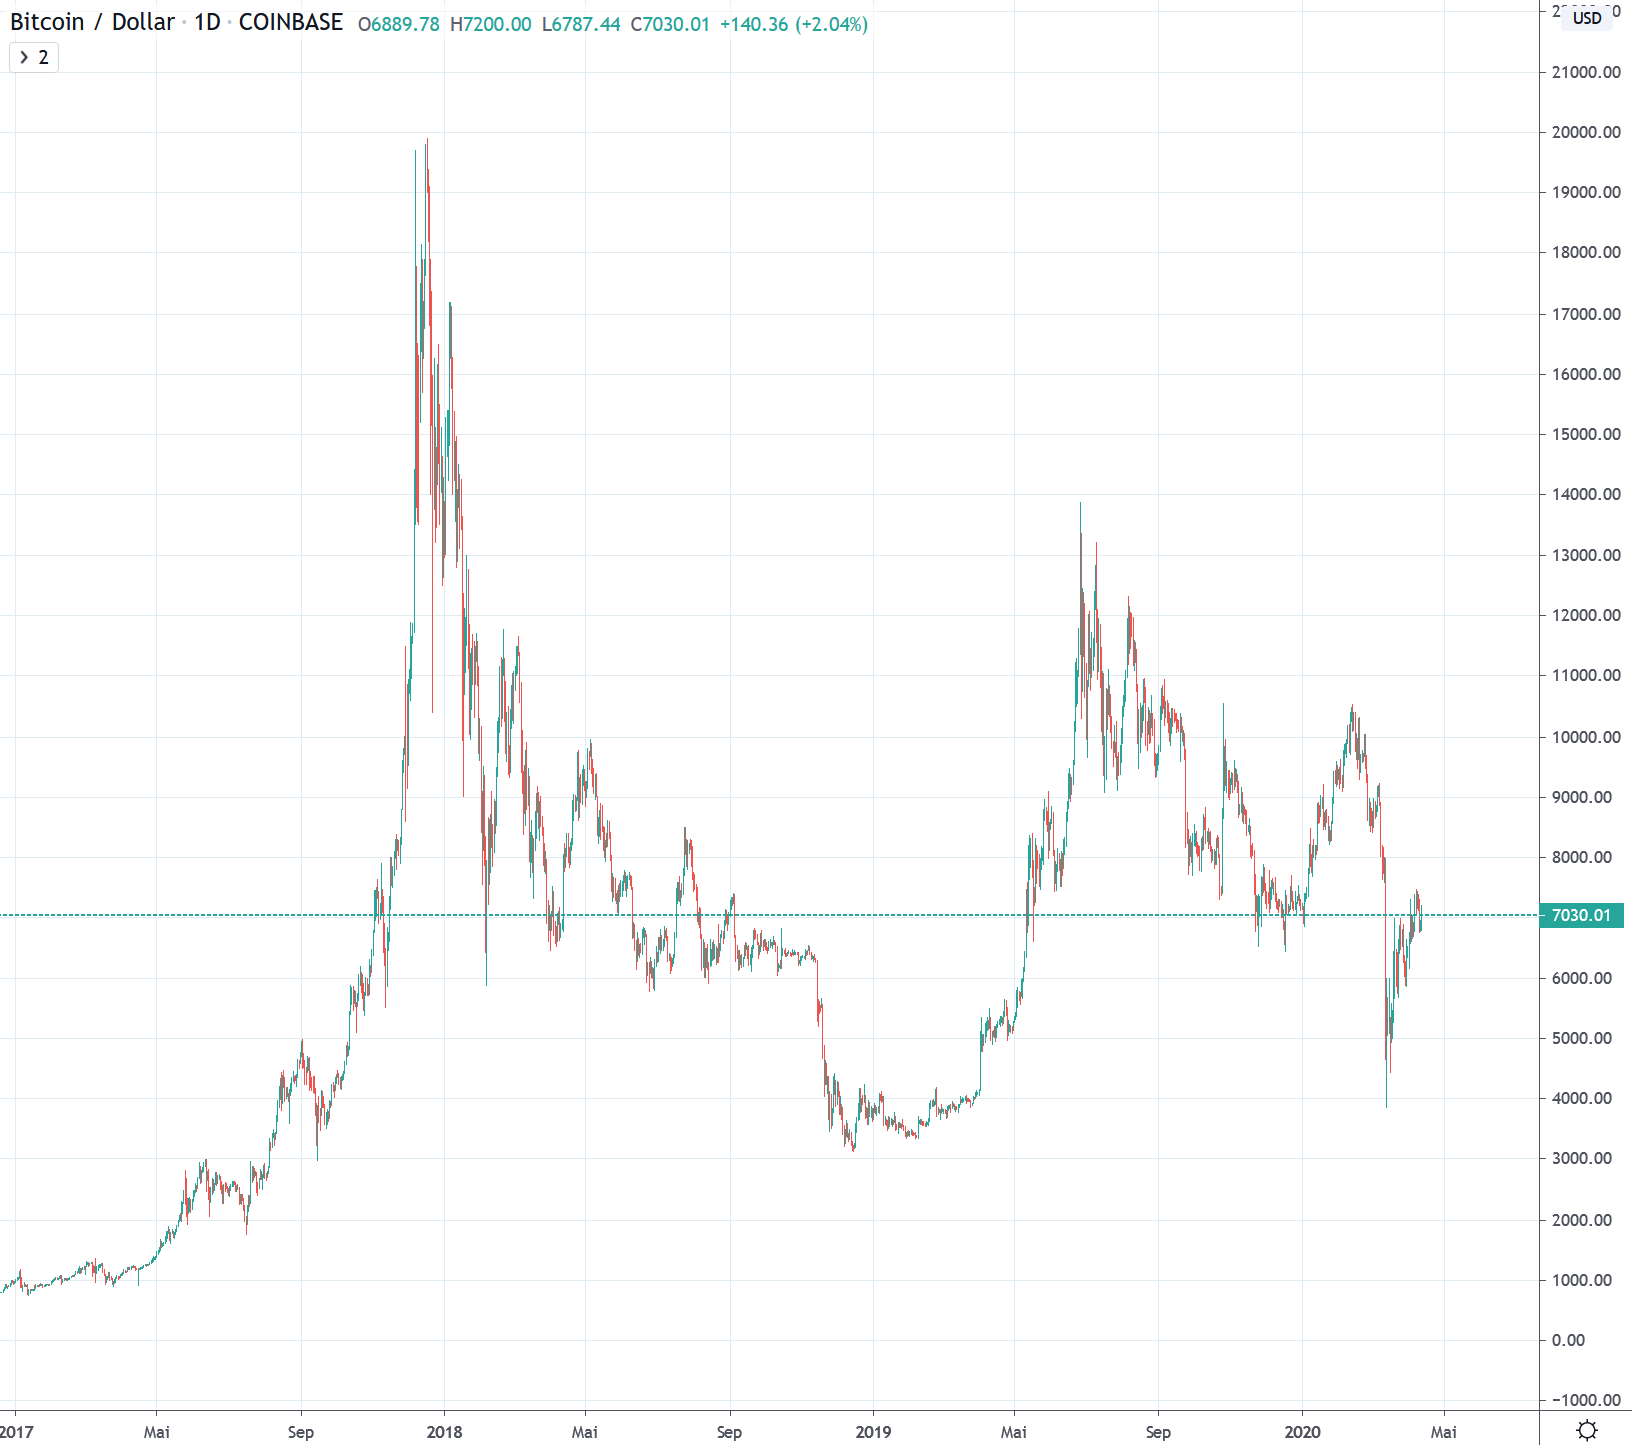
Bitcoin/USD daily basis
 Source: Tradingview.com
Bitcoin/USD - Not much new in the reporting week
On Monday, Bitcoin was able to advance to just over USD 7,300 right at the beginning of the reporting week. This was followed on Tuesday by another attempt to climb higher spheres. However, this was rejected at USD 7,500. This was followed by an intraday correction to a low of USD 7,050, but the daily closing price was marked slightly higher at USD 7,200. The next two days the Bitcoin price consolidated at these levels until Friday when it was sharply rejected below the USD 7'000 mark. On the weekend, a further consolidation around the 7'000 USD mark took place, in a range of 400 USD.
Micro-trend fails at levels above 7'000 US
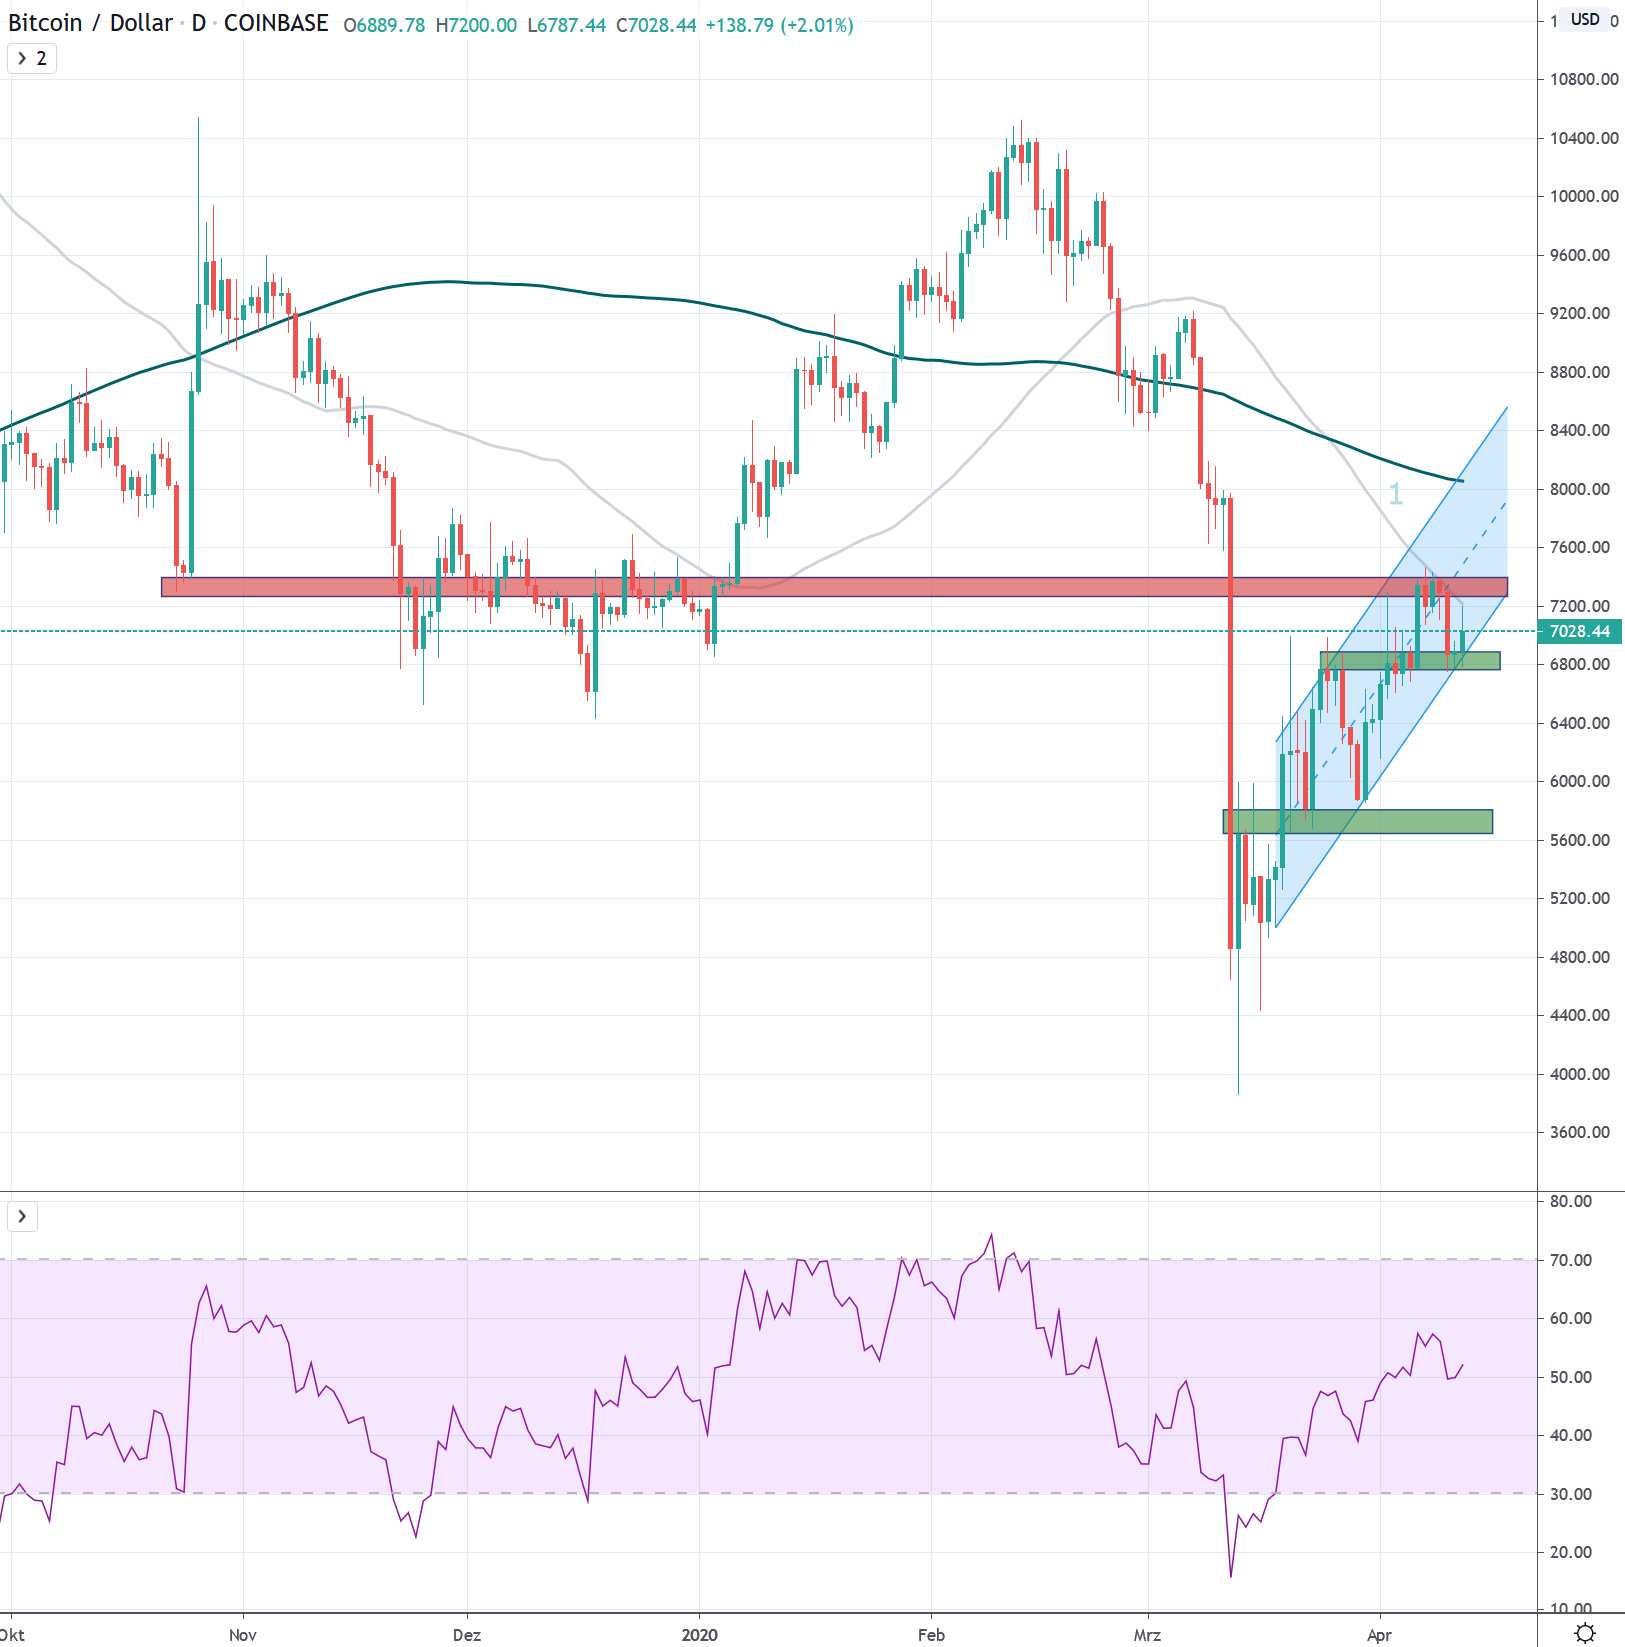
Bitcoin managed to form a pattern of higher lows in the micro-trend after its fall about four weeks ago. A channel can now be drawn. This countermovement now ended for the second time at the strong resistance, which was formed by price movements between November and January 2019, as well as earlier movements (red).
Thus, a "normal" countermovement after the price drop is still to be assumed. Although it was able to continue to build on its foundation of higher lows, it failed for the second time at the important resistance zone above USD 7,000 (red).
The strength of the bulls in the micro-trend will thus soon become apparent. Respecting the new trend channel will be important for the structure of the latest uptrend. Currently, the 50 daily average (1) also serves as resistance. In the best case, the higher lows will continue. The lower trend line of the channel as well as the fresh support zones at around USD 6,900 should be respected. The 5'800 to 6'000 USD zone (green) serves as last support for the young upward-trend. A drifting off increases the probability of a renewed visit to the 5200 - 5'000 USD level and would represent the capitulation of the fresh trend. As a consequence, a renewed testing of the USD 3,000 - 4,000 spheres would have to be attributed an increased probability.
Accordingly, resistance can still be detected around 7'400 USD. Others are to be found in the USD 7,800 - 8,000 zone. Support is expected at USD 6,800 and between USD 5,800 and 5,900.
Macro: Chronology of lower highs since the end of 2017
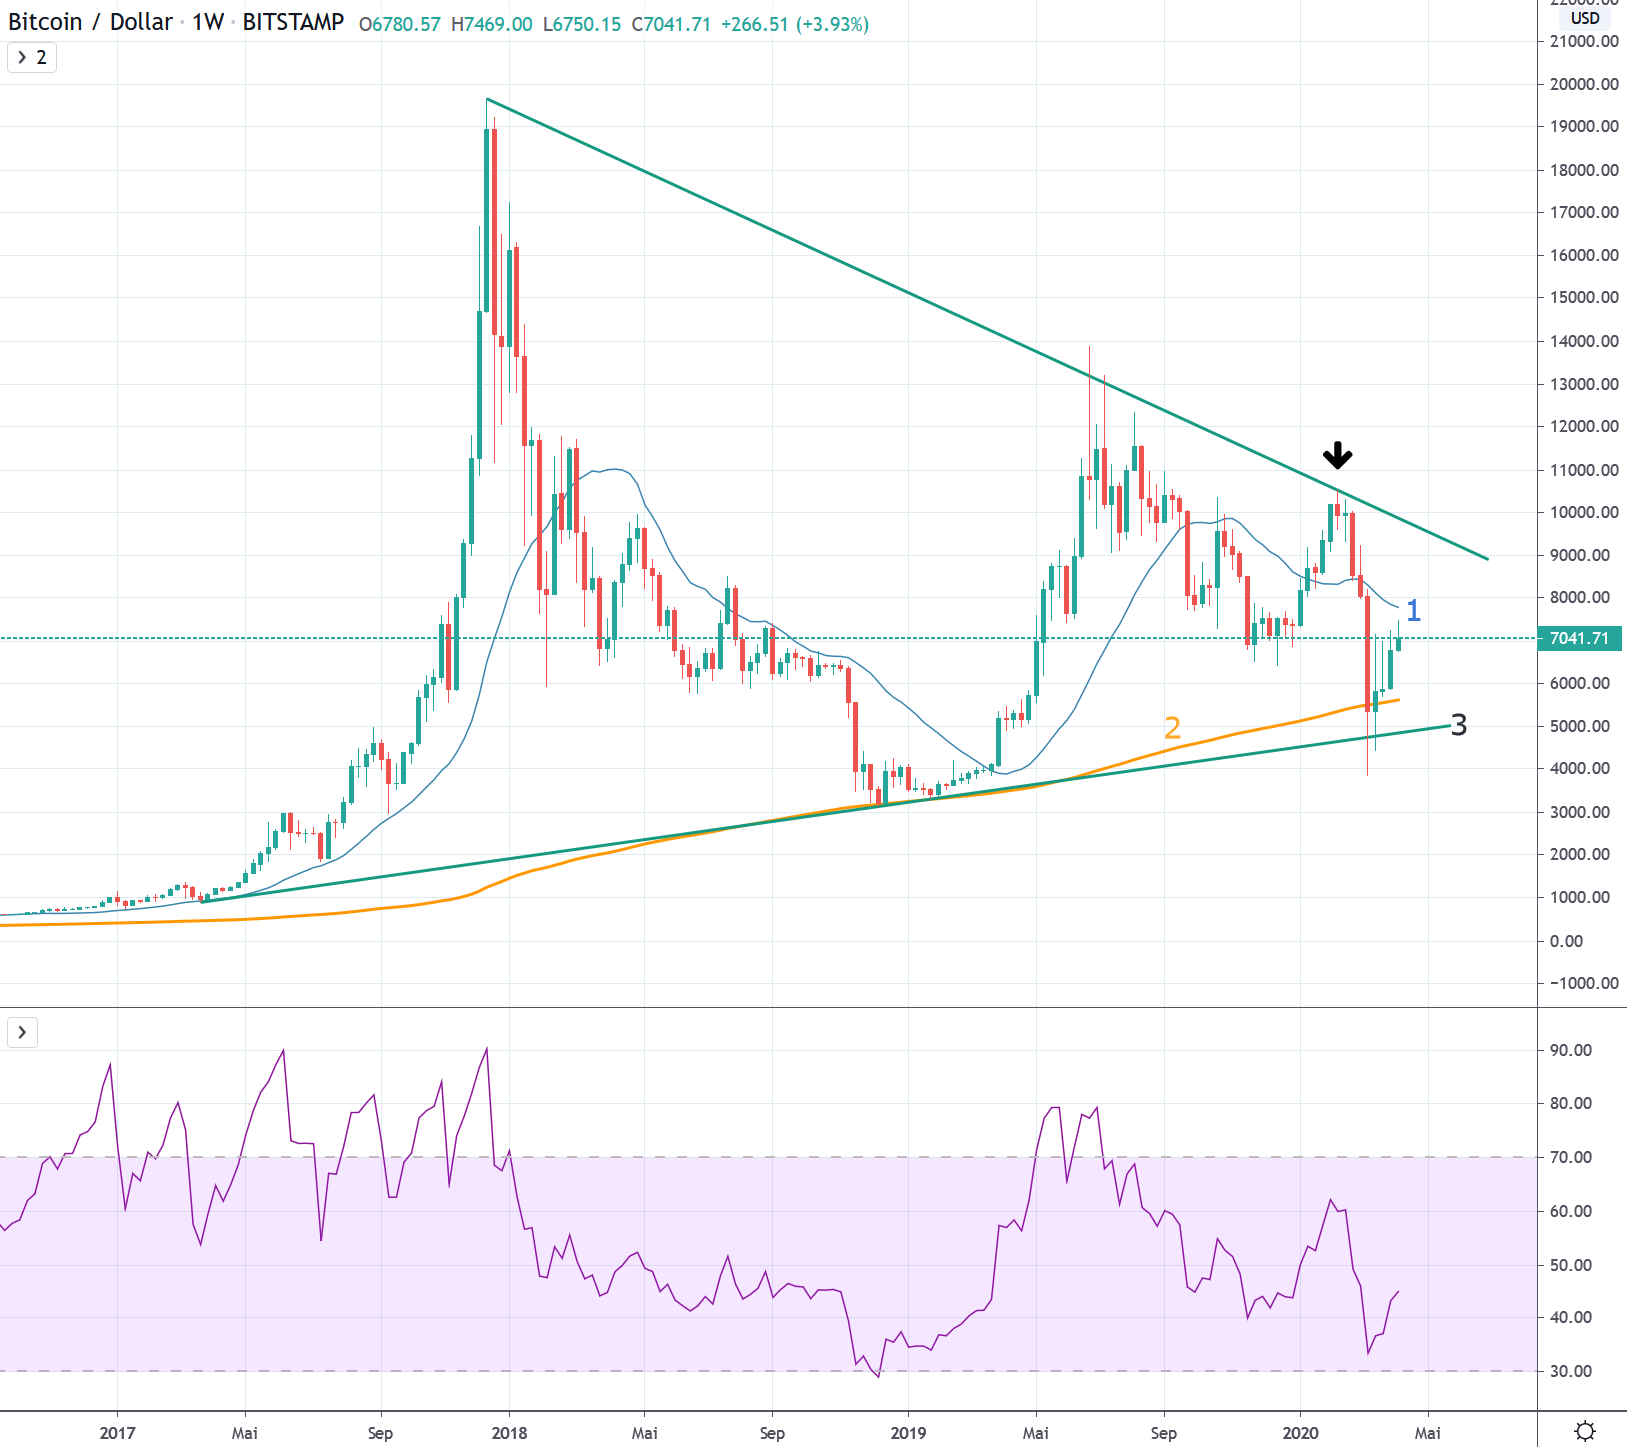
Bitcoin has so far failed to set a higher high in the weekly interval, which would have broken the prevailing bearish trend since December 2017. In its last attempt since the beginning of the year, the upward trend in the relevant zone failed at around USD 10,500. The strong price correction that has just taken place is further confirmation of the prevailing downtrend.
Bitcoin is now clearly below the 21-week average (1), which in the past often decided about occurrence of bull markets or bear markets. The 200-week average (2), which has never been broken since its inception, and the trend line (3) of the lower bandwidth of the uptrend since March 2017 are also being tested. They will serve as further indications of how distressed Bitcoin is at present.
The macro picture remains dominated by lower highs since December 2017 in the downtrend. Bitcoin must create a new basis for itself. If the USD 5,000 mark does not hold, between USD 3,000 and USD 3,500 support is expected from the bottoming out of early 2018.
The negative macro picture can only be broken in the medium term if the trend of lower highs since 2017 is sustainably overcome.


