
Bitcoin USD daily basis
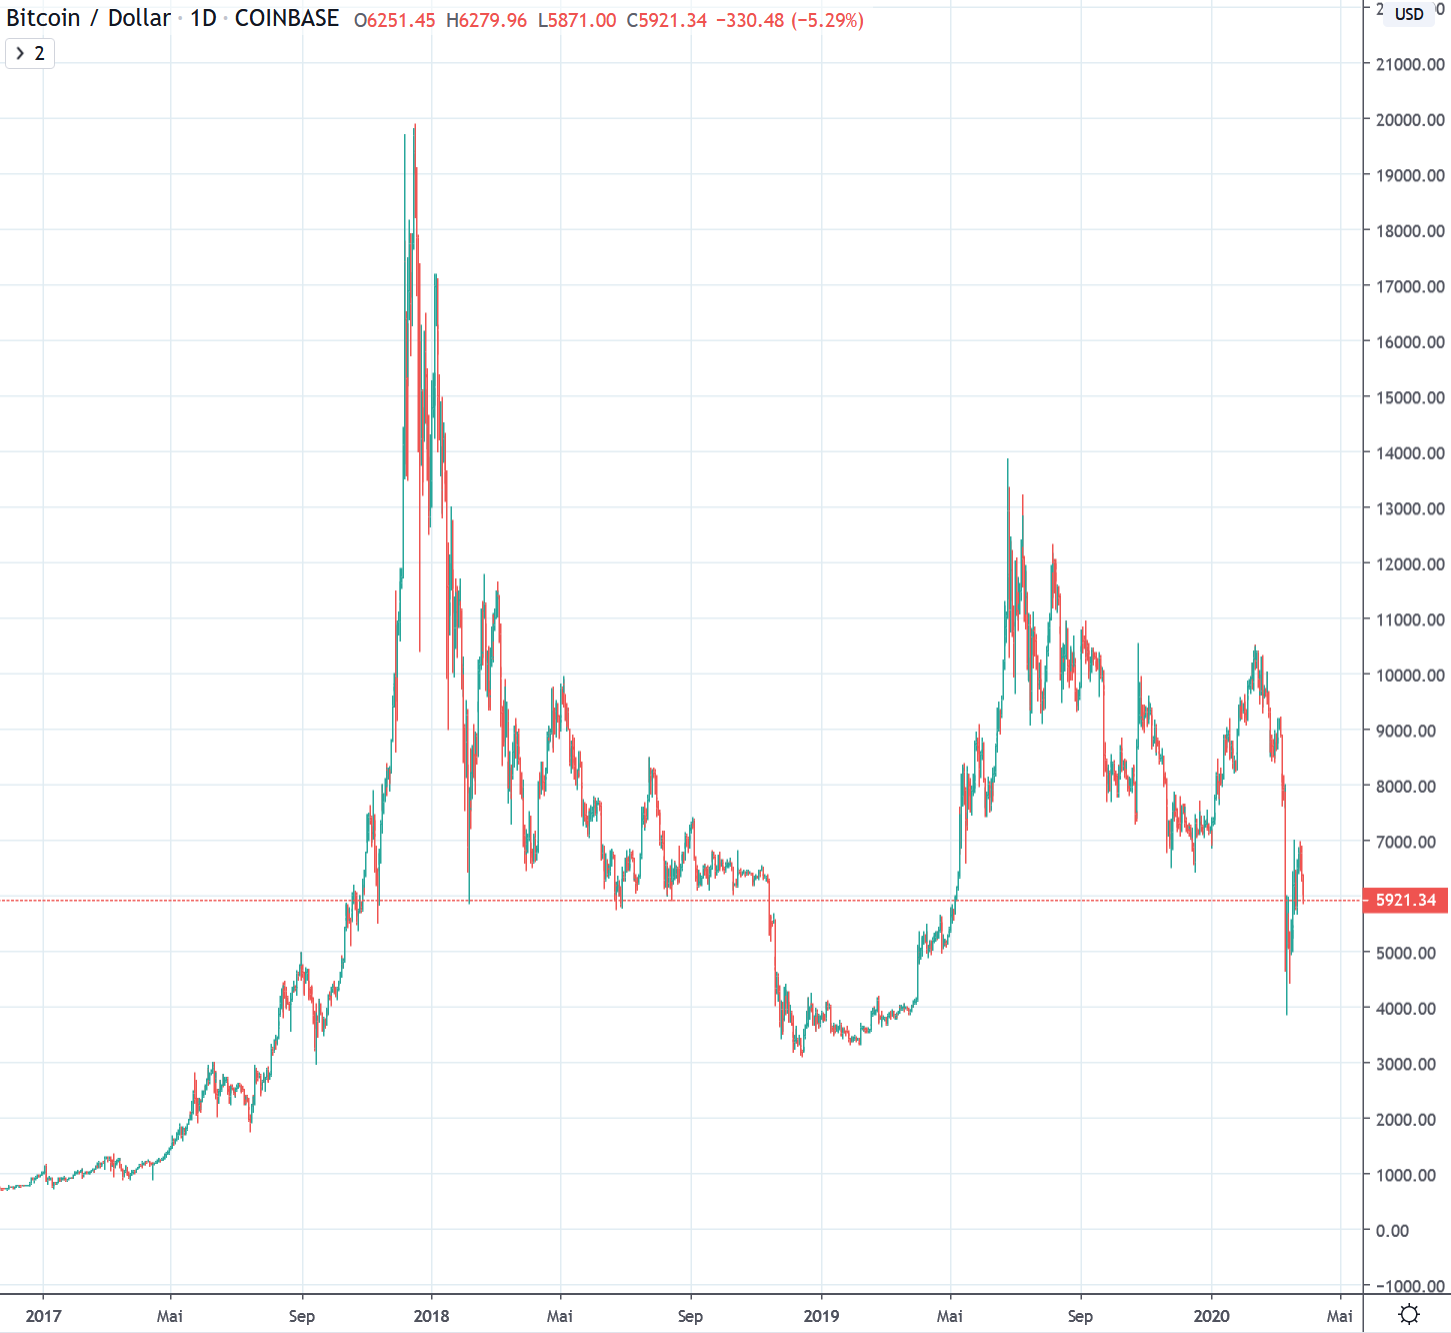
Bitcoin/USD - Testing the first resistance zone
Bitcoin managed to defend its newly reached level of USD 6,000 at the beginning of the reporting week. Already on Tuesday, a higher level of just under 6'500 USD was reached. This was followed by a further rise in the share price at midweek, which led to resistance of around USD 6,900. A subsequent consolidation did not lead to a higher peak above the 6,800 mark. Consequently, on Friday the price was rejected to just below USD 6,500. This was followed by two further trading days with lower highs and lows, which took bitcoin back below the USD 6'00 mark at the end of the week.
Microtrend not convincing
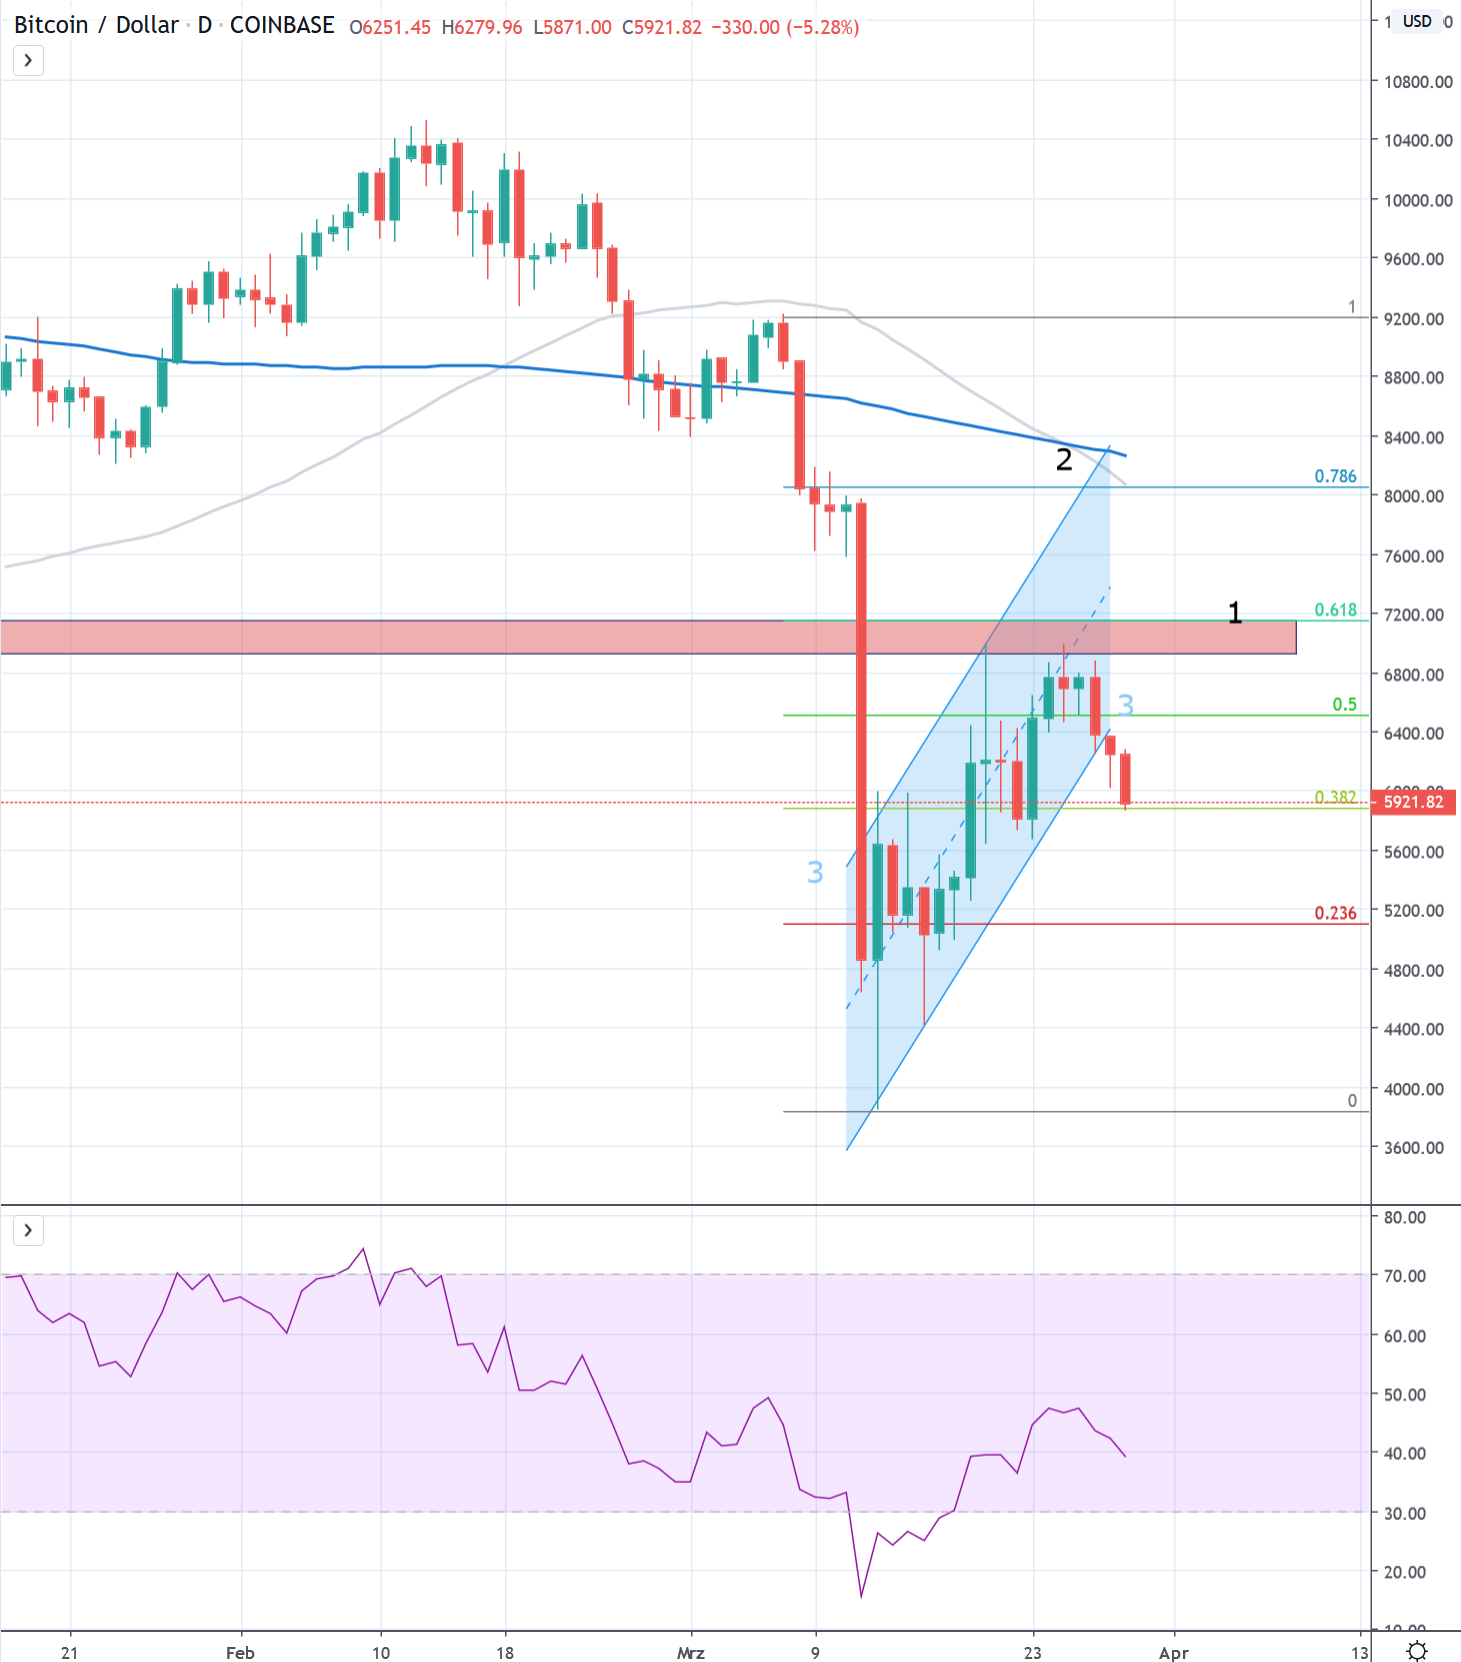
Bitcoin temporarily managed to form a pattern of higher lows in the micro-trend after its price drop about two weeks ago. However, this countermovement ended just at the first resistance formed by price movements between November and January 2019 (red). The resistance also exactly reflected the golden Fibonacci mark of the last price drop (1).
Thus, a "normal" countermovement after the price drop can be assumed. Also a so-called bear flag (3) was formed, a negative formation, which additionally speaks for a continued bearish environment in the micro trend. The price movements of the last two weeks also led to a crossing of the 50-day average by the 200-day average downwards "golden cross" (2).
The strength of the bulls will thus be put to the test in the coming days. This raises the question of whether the supports will be able to withstand a possible new low in the micro-trend. These are in the region of USD 5,600 - 5,400 due to former resistance of the recent uptrend. A drift below the 5200 - 5'000 USD mark would thus represent the capitulation of the fresh trend and would make spheres of 3'000 - 4'000 USD more likely.
Resistance to the upside has been seen at $6,400 from last week's supports, and at $6,800 - $6,900 from recent highs.
Macro: Chronology of lower highs since the end of 2017
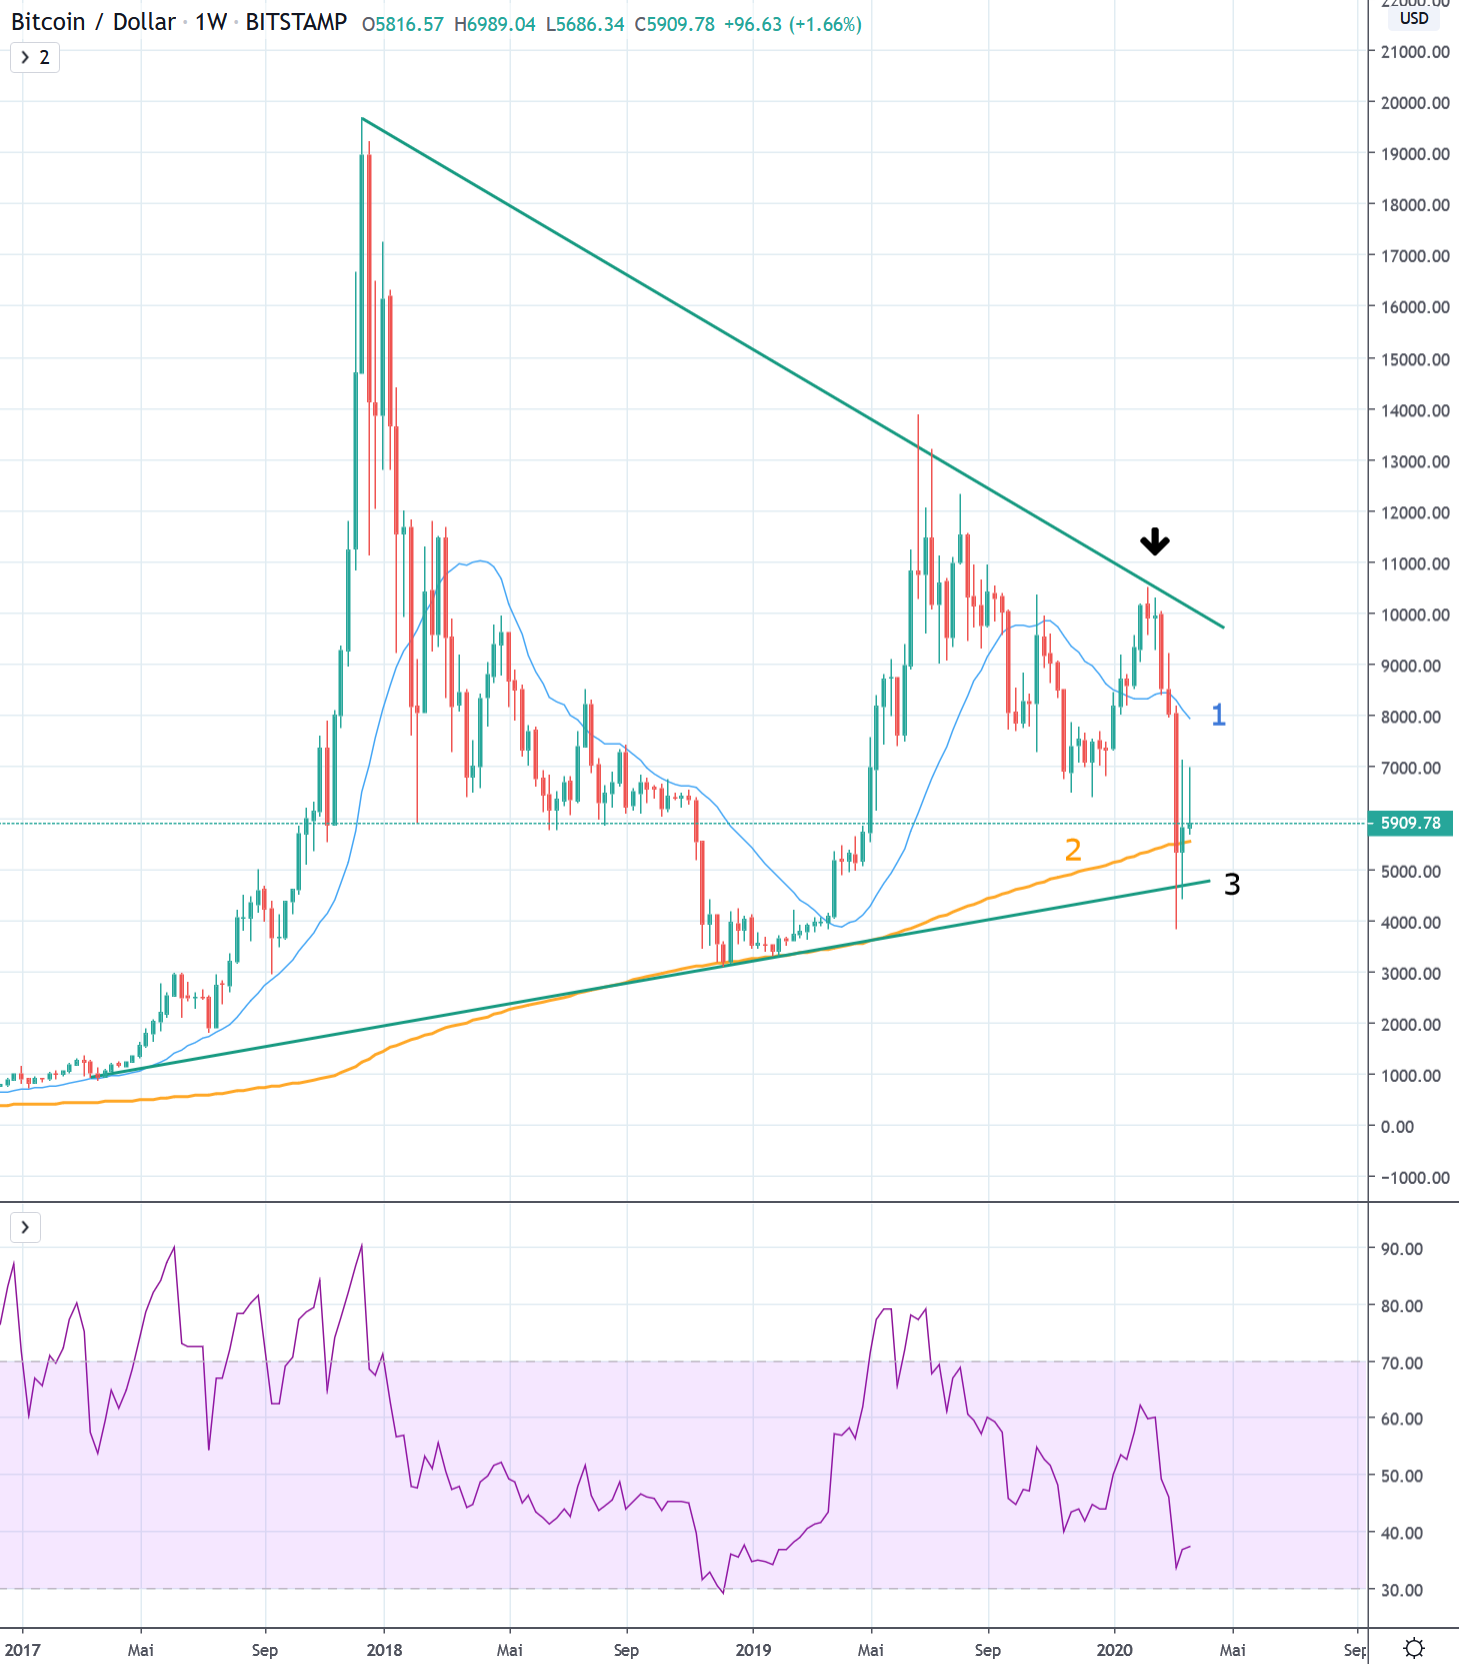
Bitcoin has so far failed to set a higher high in the weekly interval, which would have broken the prevailing bearish trend since December 2017. In its last attempt since the beginning of the year, the upward trend in the relevant zone failed at around USD 10,500. The sharp price correction that has just taken place is further confirmation of the prevailing downward trend.
Bitcoin is now clearly below the 21-week average (1), which in the past often decided about bull markets or bear markets. The 200-week average (2), which has never been broken since its inception, and the trend line (3) of the lower bandwidth of the uptrend since March 2017 are also being tested. They will serve as further indications of how battered bitcoin is at present.
The macro picture remains dominated by lower highs since December 2017 in the downward trend. Bitcoin must create a new basis for itself. If the USD 5,000 mark is not maintained, between USD 3,000 and USD 3,500 in support is expected from the bottoming out of early 2018.
The negative macro picture can only be broken in the medium term if the trend of lower peak prices since 2017 is broken sustainably.
Disclaimer
All information in this publication is for general information purposes only. The information provided in this publication does not constitute investment advice and is not intended as such. This publication does not constitute an offer, recommendation or solicitation for an investment in any financial instrument including crypto-currencies and the like and is not intended as an offer, recommendation or solicitation. The contents contained in the publication represent the personal opinion of the respective authors and are not suitable or intended as a basis for a decision.
All information in this publication is for general information purposes only. The information provided in this publication does not constitute investment advice and is not intended as such. This publication does not constitute an offer, recommendation or solicitation for an investment in any financial instrument including crypto-currencies and the like and is not intended as an offer, recommendation or solicitation. The contents contained in the publication represent the personal opinion of the respective authors and are not suitable or intended as a basis for a decision.
Risk note
Investments and investments, especially in crypto-currencies, are always associated with risk. The total loss of the invested capital cannot be excluded. Crypto-currencies are very volatile and can therefore be subject to extreme exchange rate fluctuations within a short period of time.
Investments and investments, especially in crypto-currencies, are always associated with risk. The total loss of the invested capital cannot be excluded. Crypto-currencies are very volatile and can therefore be subject to extreme exchange rate fluctuations within a short period of time.


