
A look back at the historic crypto flash crash of October 10, 2025, which put the market mechanics of digital assets to the test and exposed the limits of liquidity and trust.
After weeks of steady ETP inflows and new all-time highs, the crypto market faced a sudden shock on Friday, a move rarely seen even by seasoned traders. Within hours, prices of Bitcoin and other major assets plunged, roughly USD 20 billion in leveraged positions were liquidated, and even the largest trading platforms hit their limits. The selloff was not only violent but also revealing: it underscored how deeply crypto and macro markets have become intertwined and how quickly liquidity can vanish when confidence and risk appetite evaporate at once.
The Unfolding of a Historic Market Shakeout
What began as routine profit-taking quickly turned into an unprecedented chain reaction. Order books emptied rapidly, margin calls piled up, and long positions were liquidated in rapid succession. The sudden crash spread even to major assets. Calm only returned late in the day, yet the episode serves as a reminder that even in an increasingly institutional market, the old reflexes of the high-volatility era remain very much alive.
- Phase 1: Risk spike and widening spreads. At the start of US trading, macro conditions deteriorated sharply. Institutional participants pulled liquidity, bid-ask spreads widened, and order book depth thinned. Early forced sales hit shallow markets, accelerating the price decline.
- Phase 2: Derivative-driven chain reaction. As liquidity dried up, automatic safeguards kicked in across trading venues. On futures and margin platforms, positions were forcibly liquidated, triggering further sell-offs. Price discrepancies between exchanges widened sharply, amplifying the downward momentum.
- Phase 3: System stress and brief outages. At the peak, some exchanges experienced short-lived price dislocations and minor interruptions. Buyers briefly vanished, causing certain coins to plunge to extreme lows for seconds before recovering. After the most intense hour, a technical rebound set in as liquidity gradually returned and prices recovered from their lows.
Price discovery under extreme conditions
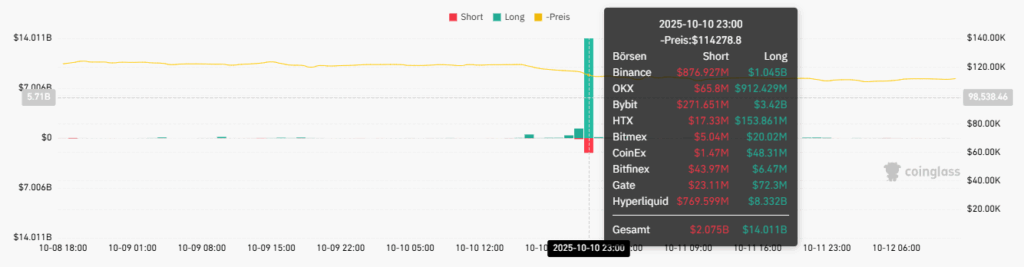
The following charts illustrate the course of the market purge. The first chart shows futures liquidations across major exchanges. The cluster of liquidations around 11 p.m. CEST underscores how quickly nearly USD 20 billion in positions were unwound.
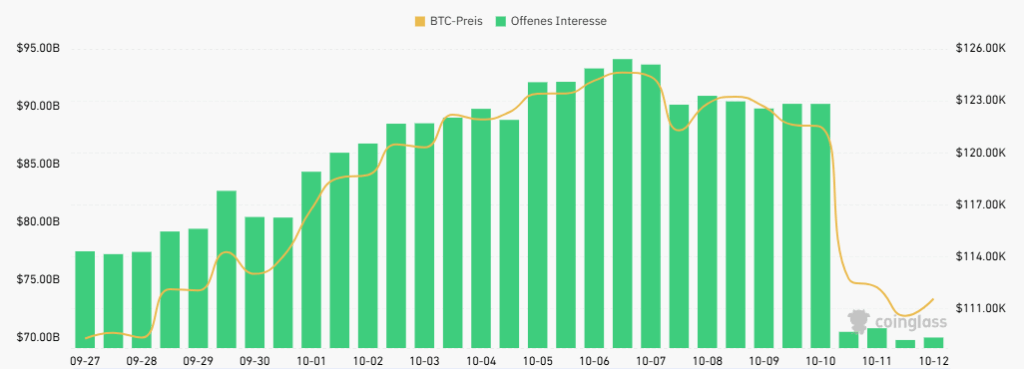
The second chart shows the reduction in open interest in Bitcoin options — another indicator of the massive deleveraging process. Notably, the sharp decline brought open interest back to early-July levels, highlighting how thoroughly leveraged positions were flushed from the market. The deleveraging peaked on Friday and eased quickly thereafter, allowing the market to stabilize over the weekend.
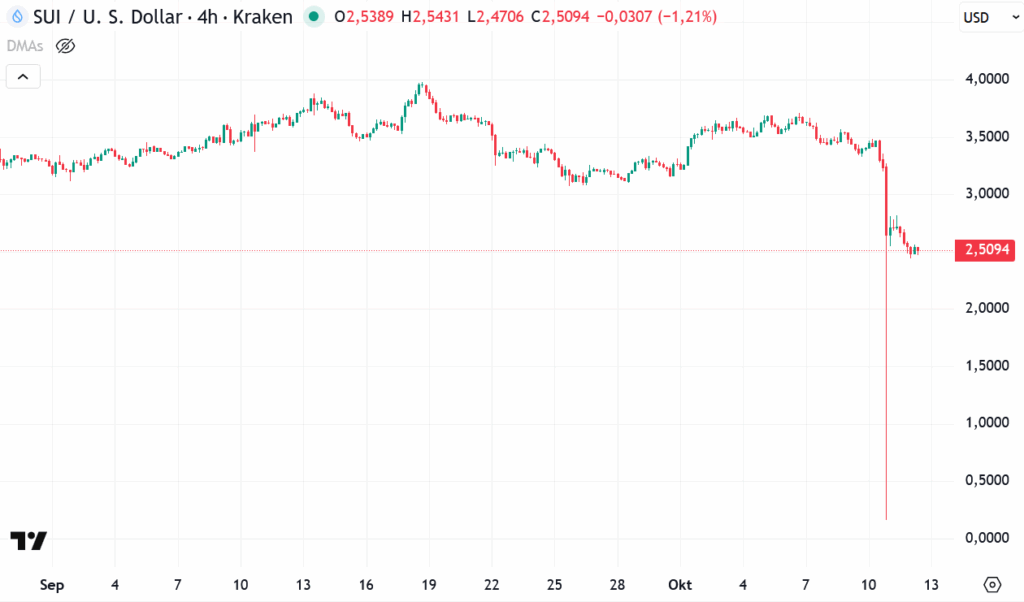
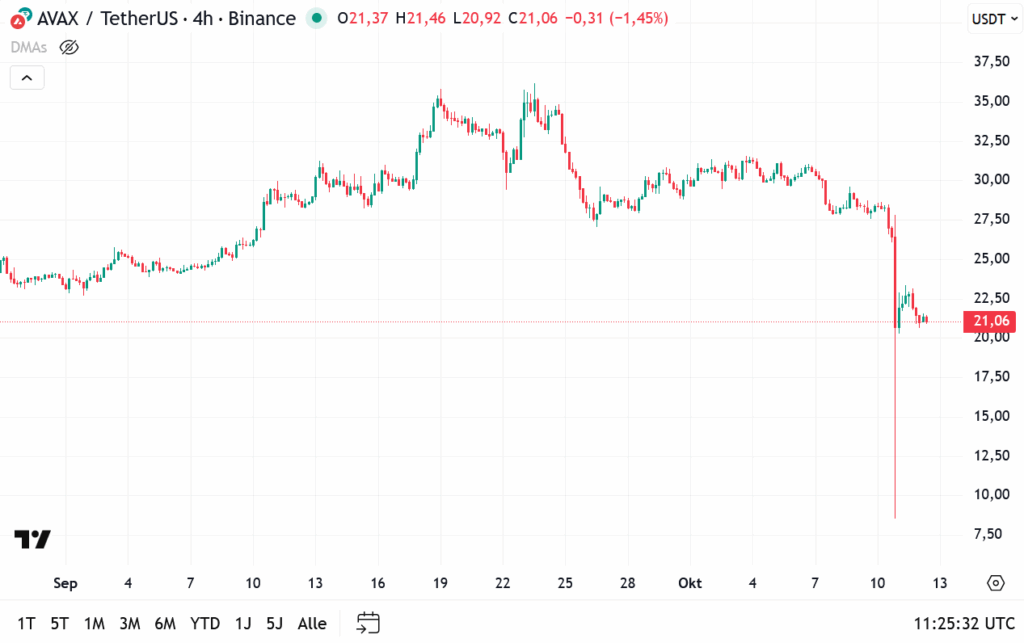
The following charts illustrate the extreme price swings of individual coins during the most volatile phase of the crypto flash crash. While Bitcoin and Ethereum traded relatively orderly, several altcoins on certain exchanges briefly plunged by as much as 90% before rebounding about 50% within minutes. These abrupt moves underscore how thin liquidity can become under stress and raise questions over whether some market makers took advantage of the dislocation.


Manipulation in the shadows: liquidations and insider trades
The dynamics of the crash suggest that more than simple panic selling was at play. Much indicates that large market participants deliberately exploited weaknesses by shifting order books, withdrawing liquidity, and thereby creating additional selling pressure that triggered countless stop-losses and margin calls. This chain reaction drove prices even lower – a phenomenon known in the scene as targeted liquidation cascades. Community discussions speculate about possible “liquidity blackouts” and perfectly timed USD 1.1 billion shorts, potentially involving large market makers and CEX glitches.
Adding further fuel was the case of a single wallet on Hyperliquid that reportedly made around USD 190 million in profits within hours after taking massive short positions just before the crash. The incident was documented on Binance Square and sparked heated debate. As summarized by YouTuber Voidzilla, there are always actors with information advantages in every market, but in crypto, these dynamics seem particularly unchecked. Since most digital assets are not legally classified as securities, many insider trading rules under US securities law simply do not apply.
Decentralized infrastructure passes the stress test
Despite the historic sell-off, there were also positive signals. Decentralized market infrastructure performed flawlessly, absorbing the sudden trading surge without interruption. On Solana, the network remained fully stable, processing over 100,000 transactions per second, while decentralized exchanges on the same chain handled more than USD 7 billion in 24-hour trading volume. Systems operated continuously without downtime or congestion, showcasing the blockchain’s remarkable technical resilience.
The DeFi sector also proved resilient. On Aave, the largest lending protocol with more than USD 40 billion in total value locked, roughly USD 180 million in positions were automatically liquidated and settled within collateral thresholds. Despite the extreme volatility, no abnormal losses were recorded.
Crypto flash crash as a reset, not a reversal
Despite massive liquidations and extreme volatility, the pattern of movement is best seen as a technical reset rather than a fundamental reversal. The weekend timing, signs of potential market manipulation, and the dominant role of derivatives all support this view. Only prolonged price weakness combined with significant ETF outflows and a broad institutional pullback would signal a lasting structural shift in the market.


