

Close Menu
Crypto Valley Journal
    Facebook X (Twitter) Instagram
    Crypto Valley Journal
    • Hot Topics
      • News
      • Minds
    • Focus
      • Background
      • Blockchain
      • Legal & Compliance
      • Non-Fungible Token (NFTs)
    • Investing
      • Markets
      • Financial Products
      • Decentralized Finance (DeFi)
      • Exchange overview
    • Education
      • Basics
      • Glossary
      • Politicians on crypto
    • Statistics
      • Bitcoin-ETF-Flows
      • Ethereum-ETF-Flows
      • Crypto market data
      • On-chain data
    • Academy
      • Overview
      • Part 1: Blockchain
      • Part 2: Money
      • Part 3: Bitcoin
      • Part 4: Cryptocurrencies
      • Part 5: Decentralized Finance
      • Part 6: Investing
    • English
      • Deutsch
    Crypto Valley Journal
    You are at:Home » Markets » Technical Analysis » Weekly bitcoin usd chart analysis calendar week 12
    Bitcoin USD

    Weekly bitcoin usd chart analysis calendar week 12

    By Editorial Office CVJ.CH on 24. March 2020 Technical Analysis

    Bitcoin USD daily basis
    Bitcoin USD
    Charts: Tradingview.com

    Bitcoin/USD – Black Thursday leads to the breaking of all supports

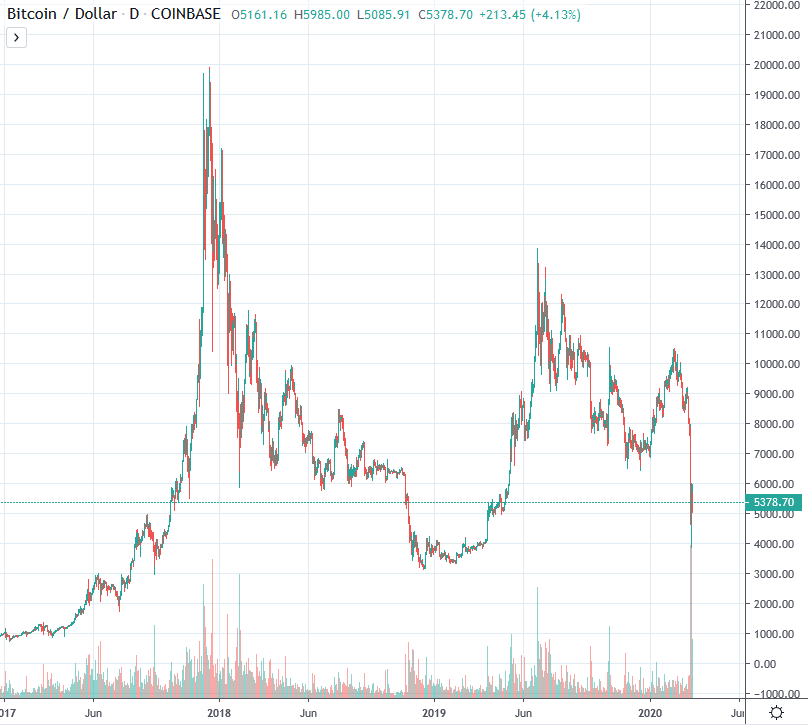
    At the beginning of the reporting week, the bitcoin price moved below the USD 8,000 mark —  with a tendency towards lower daily highs and lows. For the time being, it the price was held the support USD 7,700, which was established by earlier resistance zones. However, as the stock market collapsed on Thursday, bitcoin was no longer able to hold ground; as on the same day, the price plummeted to 4,600 USD. ~This rut continued on Friday, which led to prices dipping below 4’000 USD mark.  Thus, the daily closing price on Friday was at 5’600 USD level. Bitcoin then consolidated in the range between 5’000 and 5’500 USD, as the week came to a close.

    Is the ‘Shoulder-head-shoulder’ formation followed by a strong sell off?
    Bitcoin USD

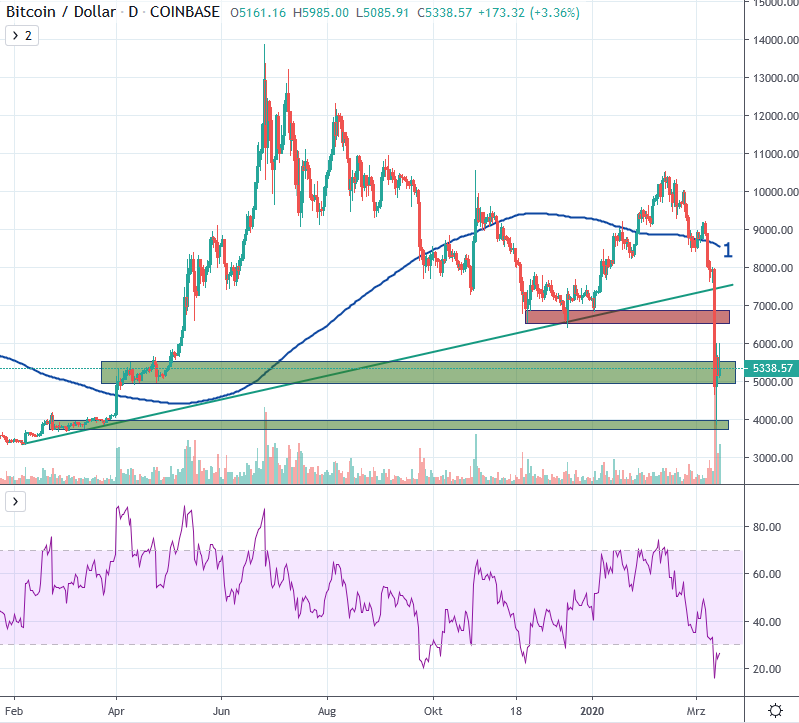
    The trend of lower highs since mid-February has already indicated that a new bearish tendency is present. The use of the ‘shoulder-head-shoulder’ formation, as well as drop below the 200-day moving average (1) further strengthened the negative short-term picture last week. The collapse of the support zone between USD 7,700 and USD 8,000 was followed by a massive price fall; crashing through the  support at USD 7,000. Back in 2019, the USD 7000 support level was the result of the resistance  at USD 4,000 mark,  that stopped the fall in the short term. This was followed by a consolidation above the USD 5,000 mark, which already served as resistance between April and May 2019 and later as support.

    Technically, all supports that could have sustained the upward trend since the beginning of the year were breached. We are now below the USD 7,000 mark, which formed the basis for the recent uptrend at the beginning of the year. This now serves as resistance (red). Bitcoin is currently in “no man’s land” and must first find a new base. In the short term, support at USD 5,000 (green) is important so that the chances of a renewed dive towards the USD 3,000 mark do not become more probable. Resistance is located at 6’400 USD due to the bottom formation at the end of 2019.

    Macro: Further confirmation of lower highs since the end of 2017
    Bitcoin USD

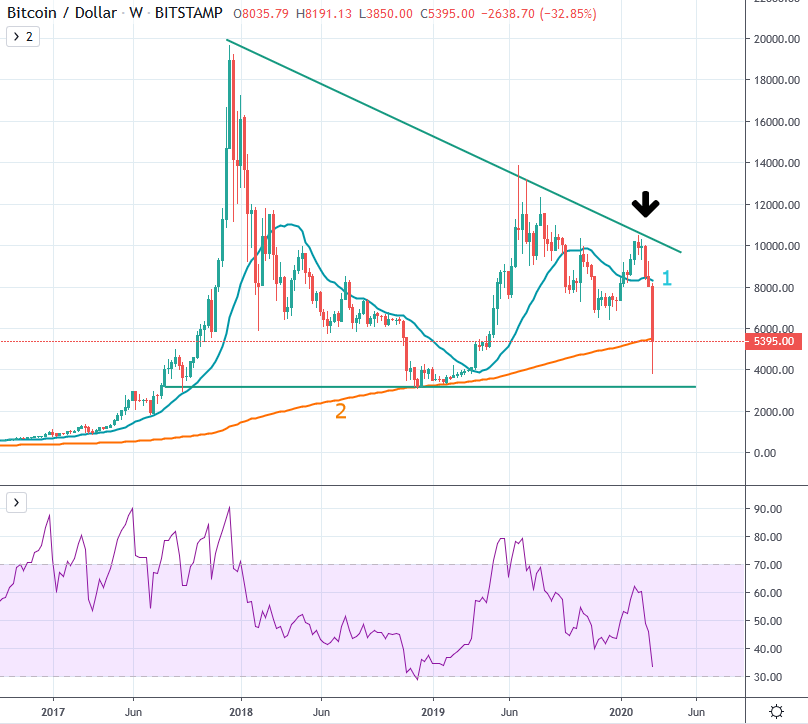
    Bitcoin did not manage to set a higher high in the weekly interval, which would have broken the trend since December 2017. In its last attempt since the beginning of the year, the upward trend in the relevant zone failed at around USD 10,500. Only a break in this zone would have broken the prevailing trend (arrow). The sharp price correction that has now taken place confirmed the prevailing downward trend.

    Bitcoin is now below the 21-week average (1), which in the past often decided about bull markets or bear markets. Should the downward trend continue, we would also be facing a historic premiere: For the first time in its existence, the 200-week average (2) would be broken through to the bottom. In the past, this has repeatedly served as a safe support.

    Since December 2017, the macro picture remains dominated by lower highs in the downward trend. Bitcoin has to create a new basis. If the USD 5,000 mark does not hold, support between USD 3,000 and USD 3,500 can be expected; similar to the bottoming out of early 2018.

    The macro picture can still only be broken in the medium term if the trend of lower highs since 2017 is sustainably broken.


    Share. Facebook Twitter LinkedIn Email Telegram WhatsApp

    About the author

    Editorial Office CVJ.CH
    • Website
    • Twitter
    • LinkedIn

    Since 2018, the editorial team at Crypto Valley Journal has been reporting from Zug - the heart of Switzerland’s Crypto Valley - on Bitcoin, cryptocurrency, blockchain, and regulatory developments in digital assets. Behind the publication’s collective editorial voice is a team of writers with backgrounds in financial markets, law, and technology.

    Related Articles

    Roughly USD 320 million in Bitcoin left the federation wallet in the Liquid Network hack. Blockstream then paused the sidechain.

    Liquid Network hack: Bitcoin layer 2 loses USD 320 million

    The IMF is releasing around USD 140 million after El Salvador stopped buying Bitcoin with public funds, ending state purchases since June 2025.

    IMF: El Salvador halted state Bitcoin purchases under pressure

    Bitcoin near USD 78,000 and stablecoin supply above USD 300 billion shape the crypto market outlook heading into Q4 2026.

    The signals to watch: a crypto market outlook for Q4 2026

    The Ethereum Foundation's Protocol Cluster rated 62 EIPs and set December 2029 as the target for a quantum-safe Ethereum base layer.
    8. September 2026

    Ethereum targets a quantum-safe blockchain by 2029

    SIX and TWINT bring the CHF stablecoin sandbox to nine partners, which are testing the franc stablecoin CHFD until the end of 2026.
    8. September 2026

    SIX and TWINT join the CHF stablecoin sandbox

    Hunter Biden brings the memecoin LAPTOP to Base and hands out 20% of the supply by airdrop, partly to wallets holding TRUMP losses.
    7. September 2026

    LAPTOP: Hunter Biden to launch memecoin on Base

    twitter image button instagram image button linkedin image button youtube image button

    About Crypto Valley Journal
    About Crypto Valley Journal

    On the pulse of the movement

    • Academy
    • Contact
    • Advertising
    • About us
    • Partner
    • Imprint
    • Privacy
    • Disclaimer
    Search

    Type above and press Enter to search. Press Esc to cancel.