Close Menu
Crypto Valley Journal
    Facebook X (Twitter) Instagram
    Crypto Valley Journal
    • Hot Topics
      • News
      • Minds
    • Focus
      • Background
      • Blockchain
      • Legal & Compliance
      • Non-Fungible Token (NFTs)
    • Investing
      • Markets
      • Financial Products
      • Decentralized Finance (DeFi)
      • Exchange overview
    • Education
      • Basics
      • Glossary
      • Politicians on crypto
    • Statistics
      • Bitcoin-ETF-Flows
      • Ethereum-ETF-Flows
      • Crypto market data
      • On-chain data
    • Academy
      • Overview
      • Part 1: Blockchain
      • Part 2: Money
      • Part 3: Bitcoin
      • Part 4: Cryptocurrencies
      • Part 5: Decentralized Finance
      • Part 6: Investing
    • English
      • Deutsch
    Crypto Valley Journal
    You are at:Home»Markets»Technical Analysis»Technical Analysis June 23 2020
    Technical Analysis

    Technical Analysis June 23 2020

    By Patrick Heusser on 23. June 2020 Technical Analysis
    An overview of the trading activities on the cryptomarkets. Studies on traded volumes, supply and demand situations, as well as periodic technical analysis of the most important crypto-currencies and indices, including the perspective of Crypto Finance AG Senior Trader Patrick Heusser.

    Market Commentary von Patrick Heusser, Crypto Finance AG

    Good Morning!

    Bitcoin BTC$ (4 hours)

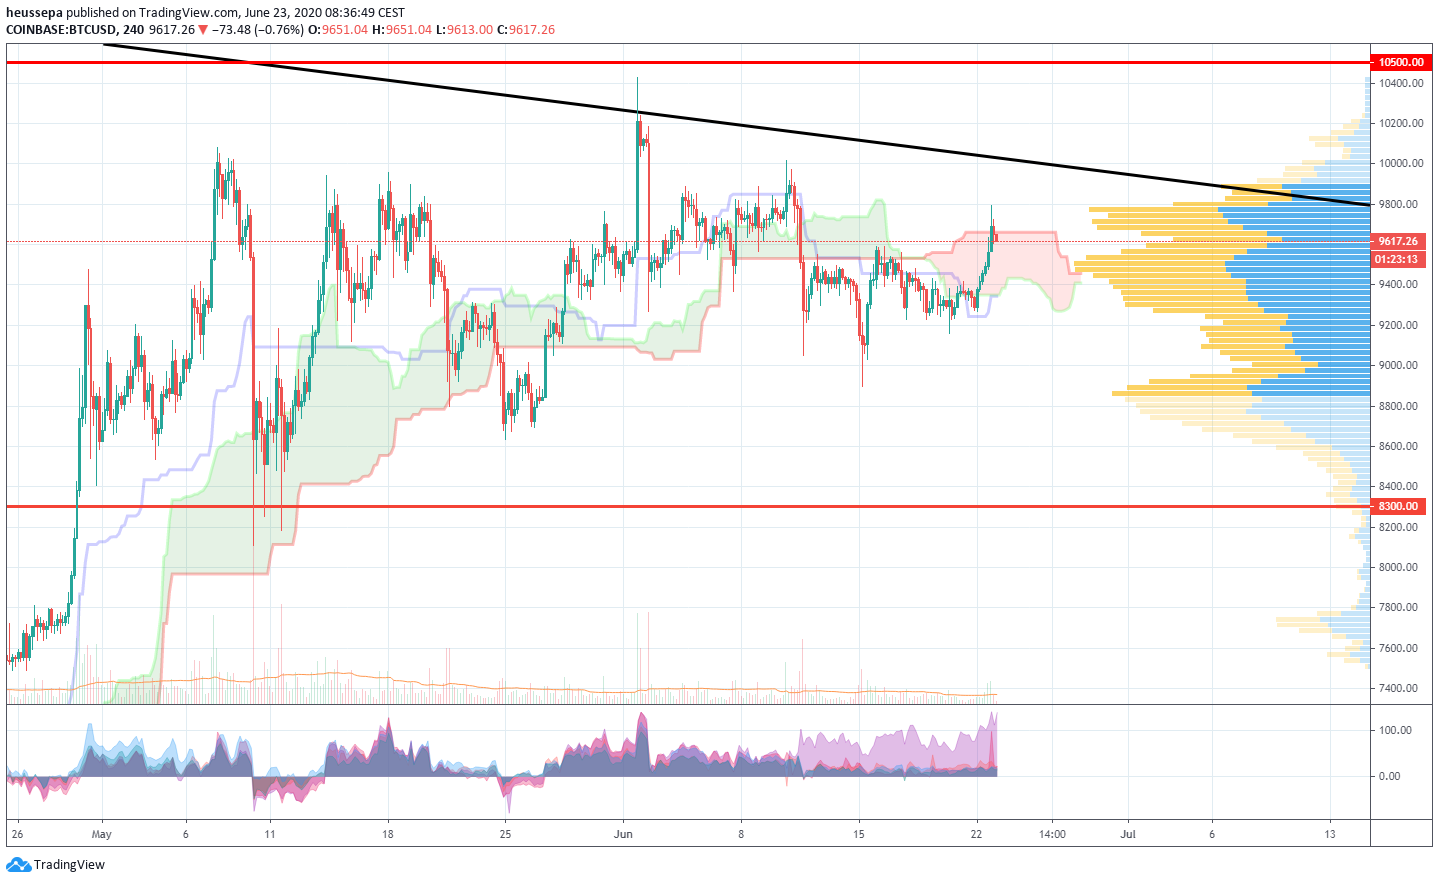
    The sideways price action is wearing down the traders. Especially those who only do short-term business.

    Maybe I should have put more emphasis on the order book cluster situation on Bitfinex (see picture).

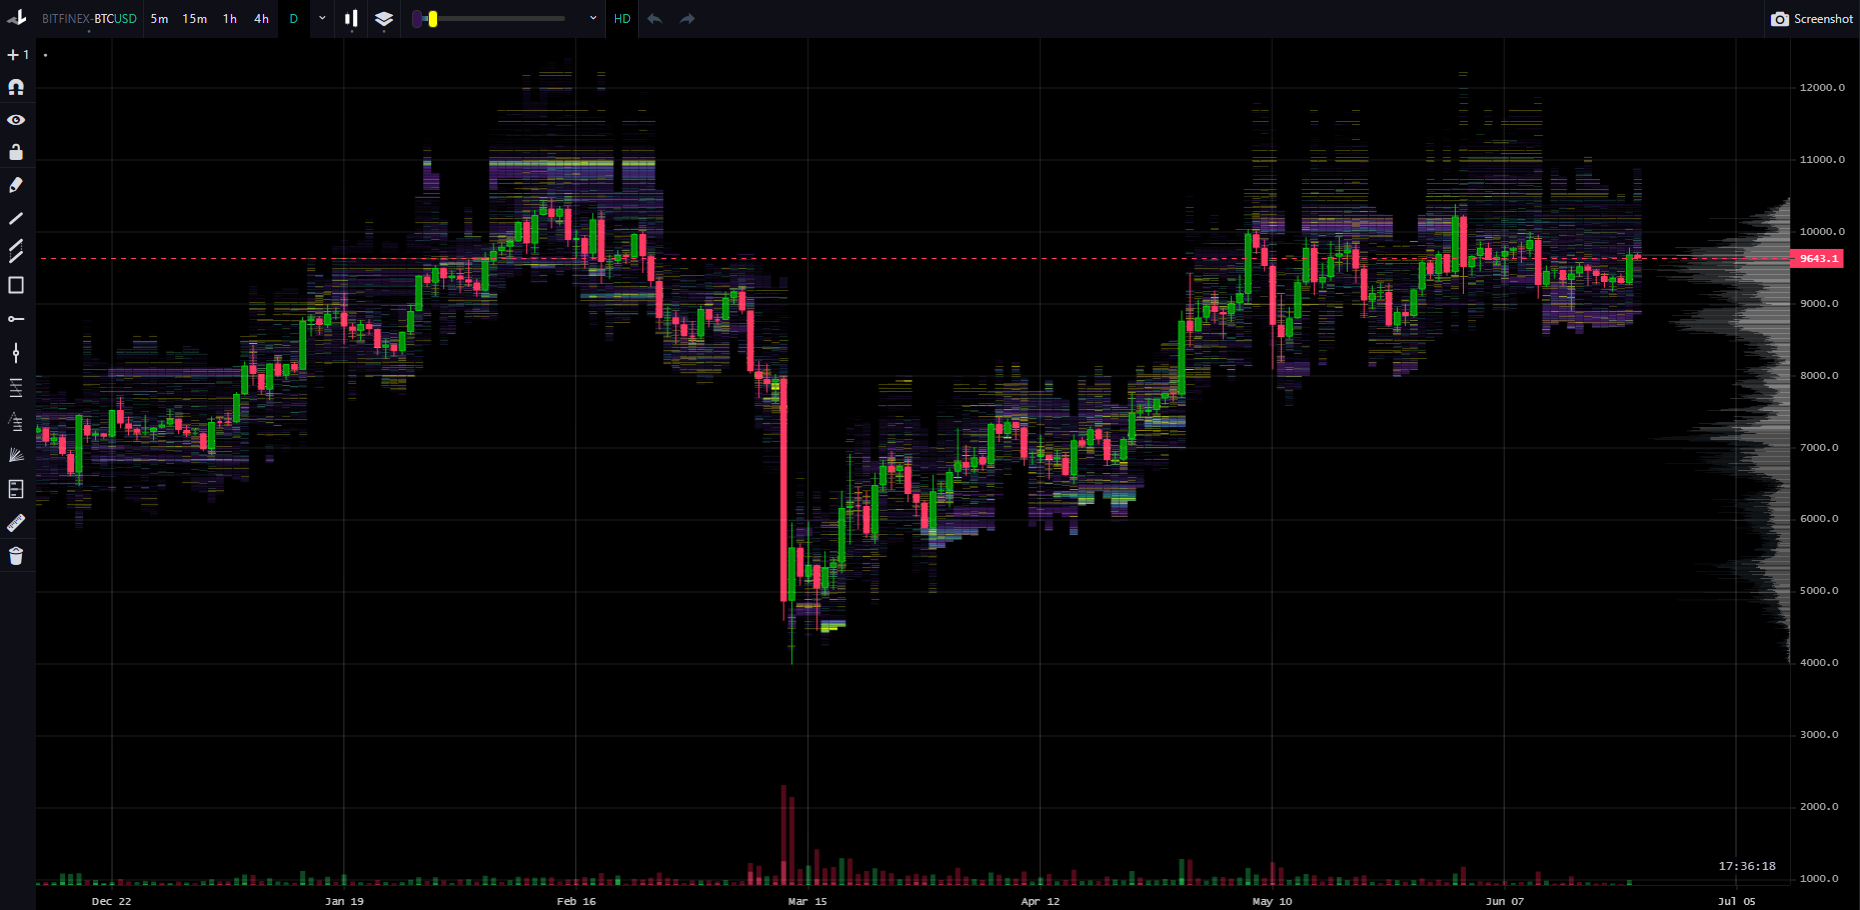
    There, they stand firm: Whenever we went underground, the bids are serviced, but none of these "standing orders" backed down, as most of them did at Binance and Coinbase. In order to give this indicator a little more weight, I will now follow it closely on the upper side and on the sell orders. Will we see this when we get closer to 10.5k, as we did in May?

    Even with the risk of sounding like a broken record, I repeat: the 10.5k resistance level is becoming more important.

    Technical Analysis Ethereum ETH$ (4 hours)

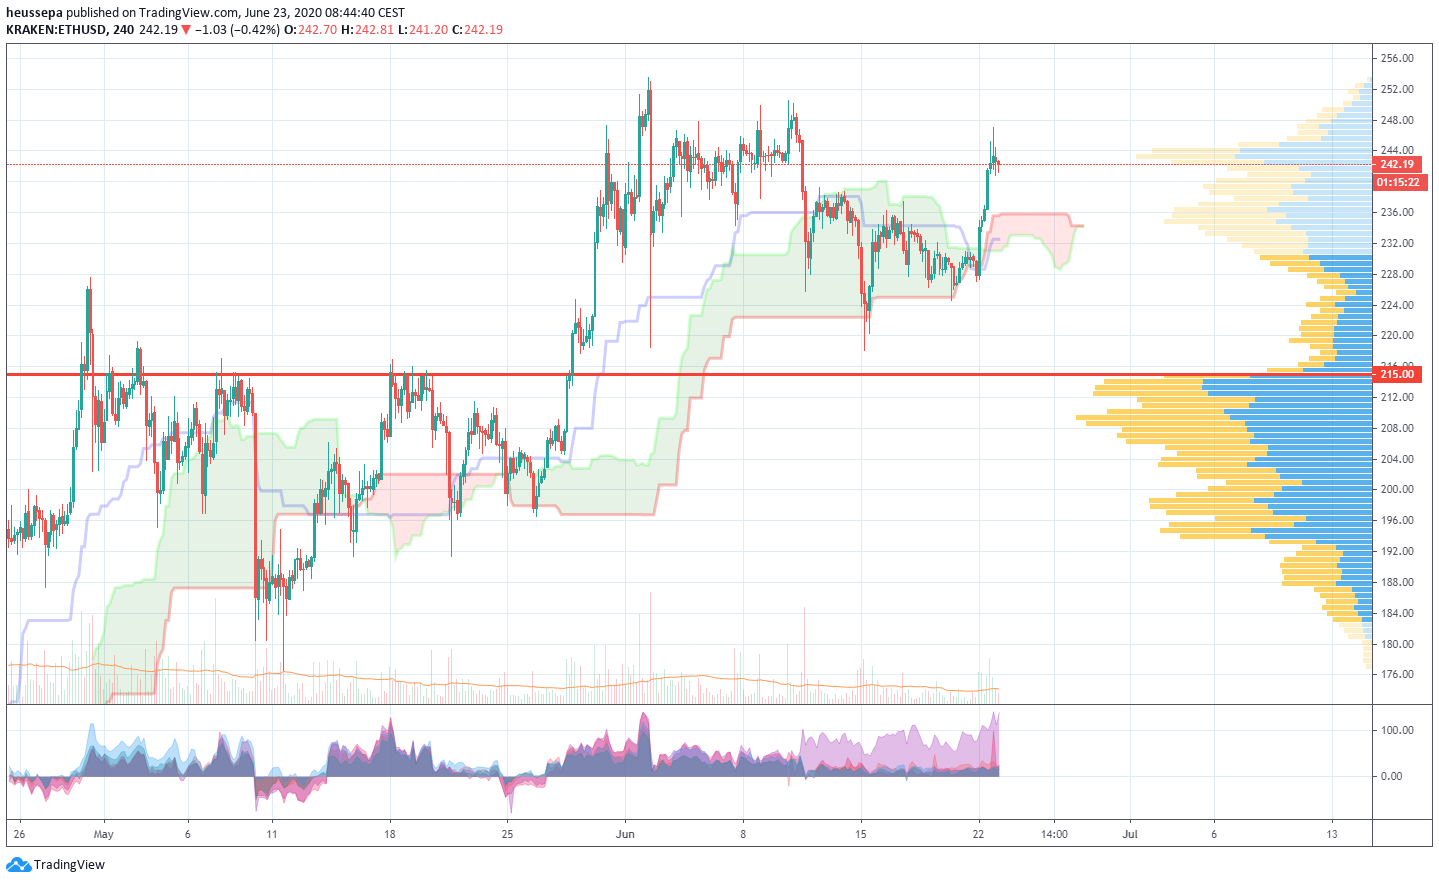
    Well, ETH$ showed me the finger and turned to the right at the point where the baseline and the cloud crossed. The upward movement was fast and stopped just before my resistance level of $250 (I mentioned this level last week).

    Looking at the order clusters of the various exchanges, I see some good offers at around $250-260 USD. If we push them through, the way is clear for new highs in 2020.

    ETH/BTC (4 hours)

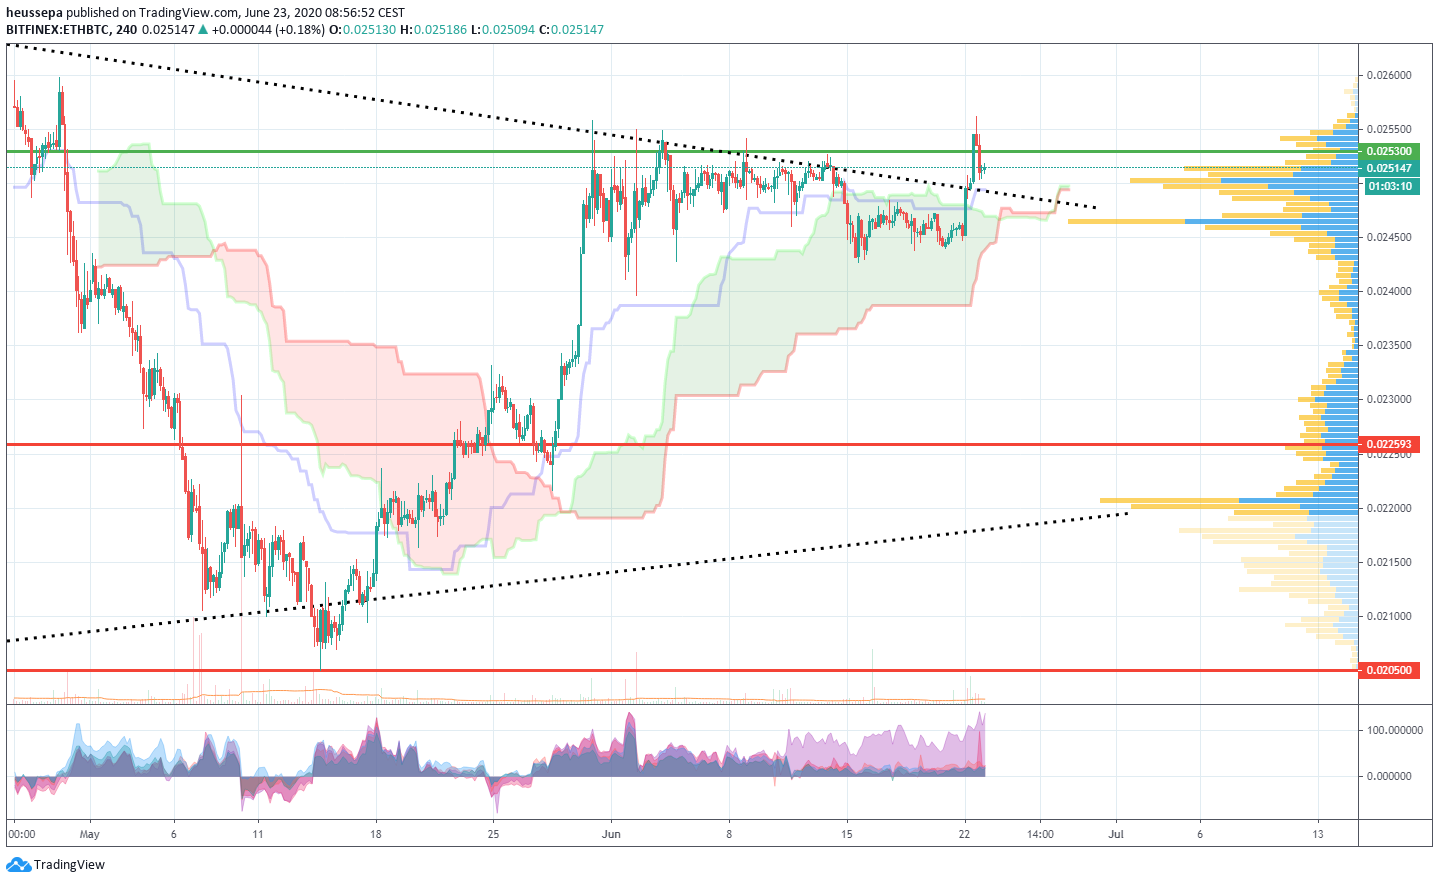
    I still feel very indecisive when it comes to this couple. It seems to have a little more force up there. But on a daily basis, we have not (yet) managed to print a daily close above the resistance level of 0.02530.

    ALT$ FTX index (4 hours)

    We continue to trade in the broad range of $475-$605 and there are no clear signs of which direction the price might go.

    MID$ FTX index (4 hours)

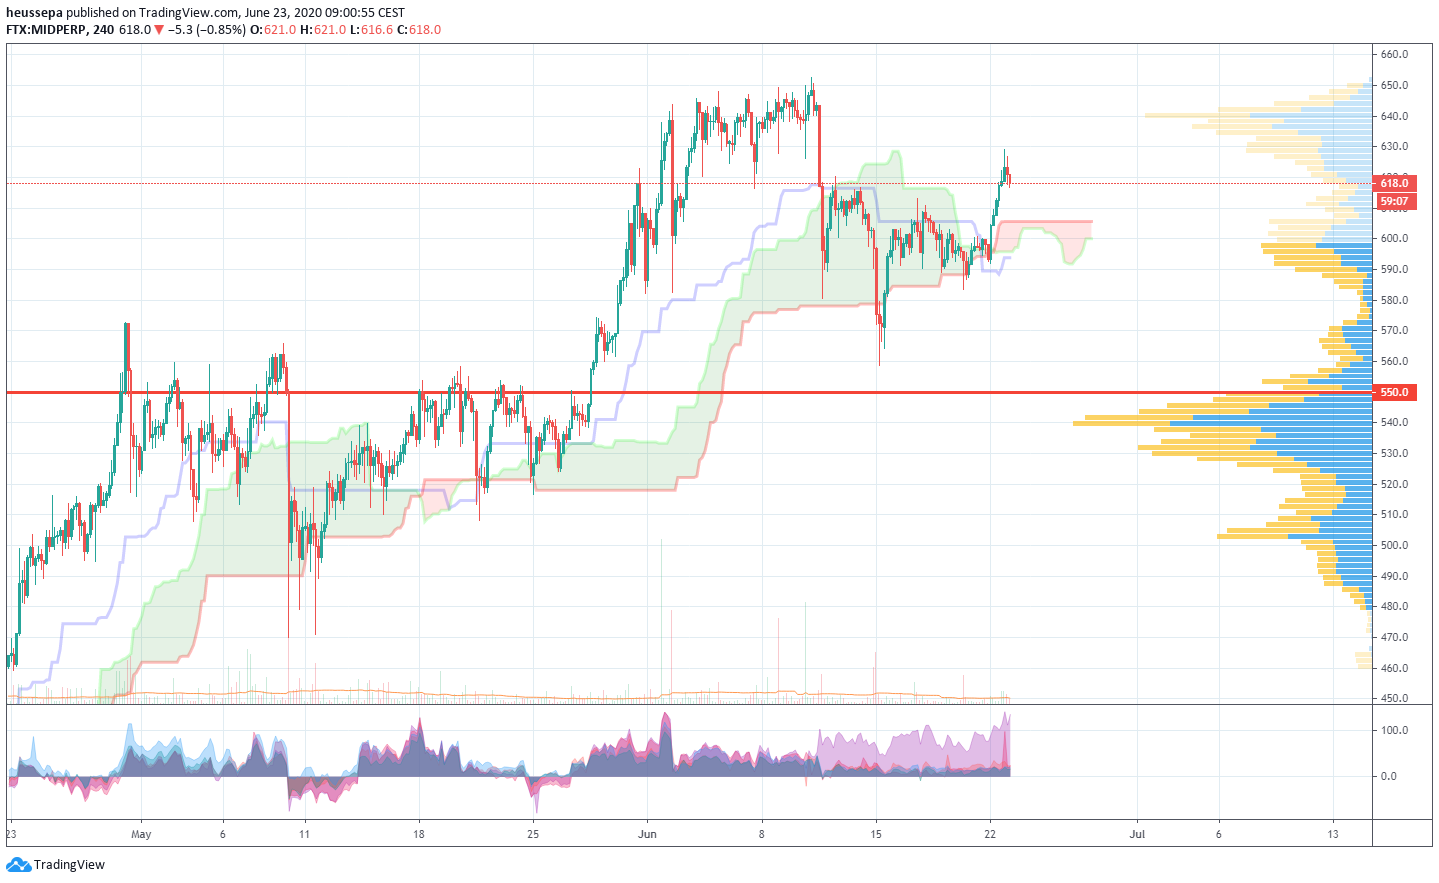
    The support level of $550 has held up well and triggered a significant recovery. But prices were unable to move towards a new ATH.

    SHIT$ FTX index (4 hours)


    This market simply does not want to correct. We see some small consolidations, and then the trend resumes: surprisingly strong so far. We are not far from ATH, and the way this index is trading suggests that we will reach ATH sooner rather than later.
    Market Commentary

    Share. Facebook Twitter LinkedIn Email Telegram WhatsApp

    About the author

    Patrick Heusser

      Patrick Heusser is Head of Trading at Crypto Broker AG. Prior to joining the company, Patrick worked as an Interest Rate Trader at UBS and held various positions in the IRCC (interest rate, commodity and foreign exchange trading) in London, New York, Singapore and Zurich. Patrick is an expert in trading and risk management. He also gained experience in other areas, such as building start-up companies. Patrick has a degree in banking from a business school. He has also taken various courses in technical chart analysis.

      Related Articles

      technical chart analysis

      Technical Analysis August 23, 2022

      technical chart analysis

      Technical Analysis August 2nd, 2022

      Bitcoin USD

      Weekly Bitcoin USD chart analysis calendar week 24 – 2022

      The US Senate has unanimously passed a prediction market ban for members and staff. The trigger is a series of insider trading scandals.
      1. May 2026

      US Senate bans members from trading on prediction markets

      Robinhood misses Q1 2026: crypto revenue halved to 134 million USD, stock falls 11 percent. Schwab and Coinbase intensify competition.
      30. April 2026

      Robinhood misses Q1 estimates: Crypto revenue cut in half

      Canada announces national crypto ATM ban. Roughly 4,000 machines are affected as Ottawa targets fraud and money laundering.
      29. April 2026

      Canada bans crypto ATMs

      twitter image button instagram image button linkedin image button youtube image button

      About Crypto Valley Journal
      About Crypto Valley Journal

      On the pulse of the movement

      • Academy
      • Contact
      • Advertising
      • About us
      • Partner
      • Imprint
      • Privacy
      • Disclaimer
      Search

      Type above and press Enter to search. Press Esc to cancel.