
Technical Analysis
Good Morning!
After such strong moves, it is always good to zoom out and take a look at the big picture. Also, I would like to dive into "my list" of altcoins that I have been talking about for the past few weeks.
BTC (weekly)
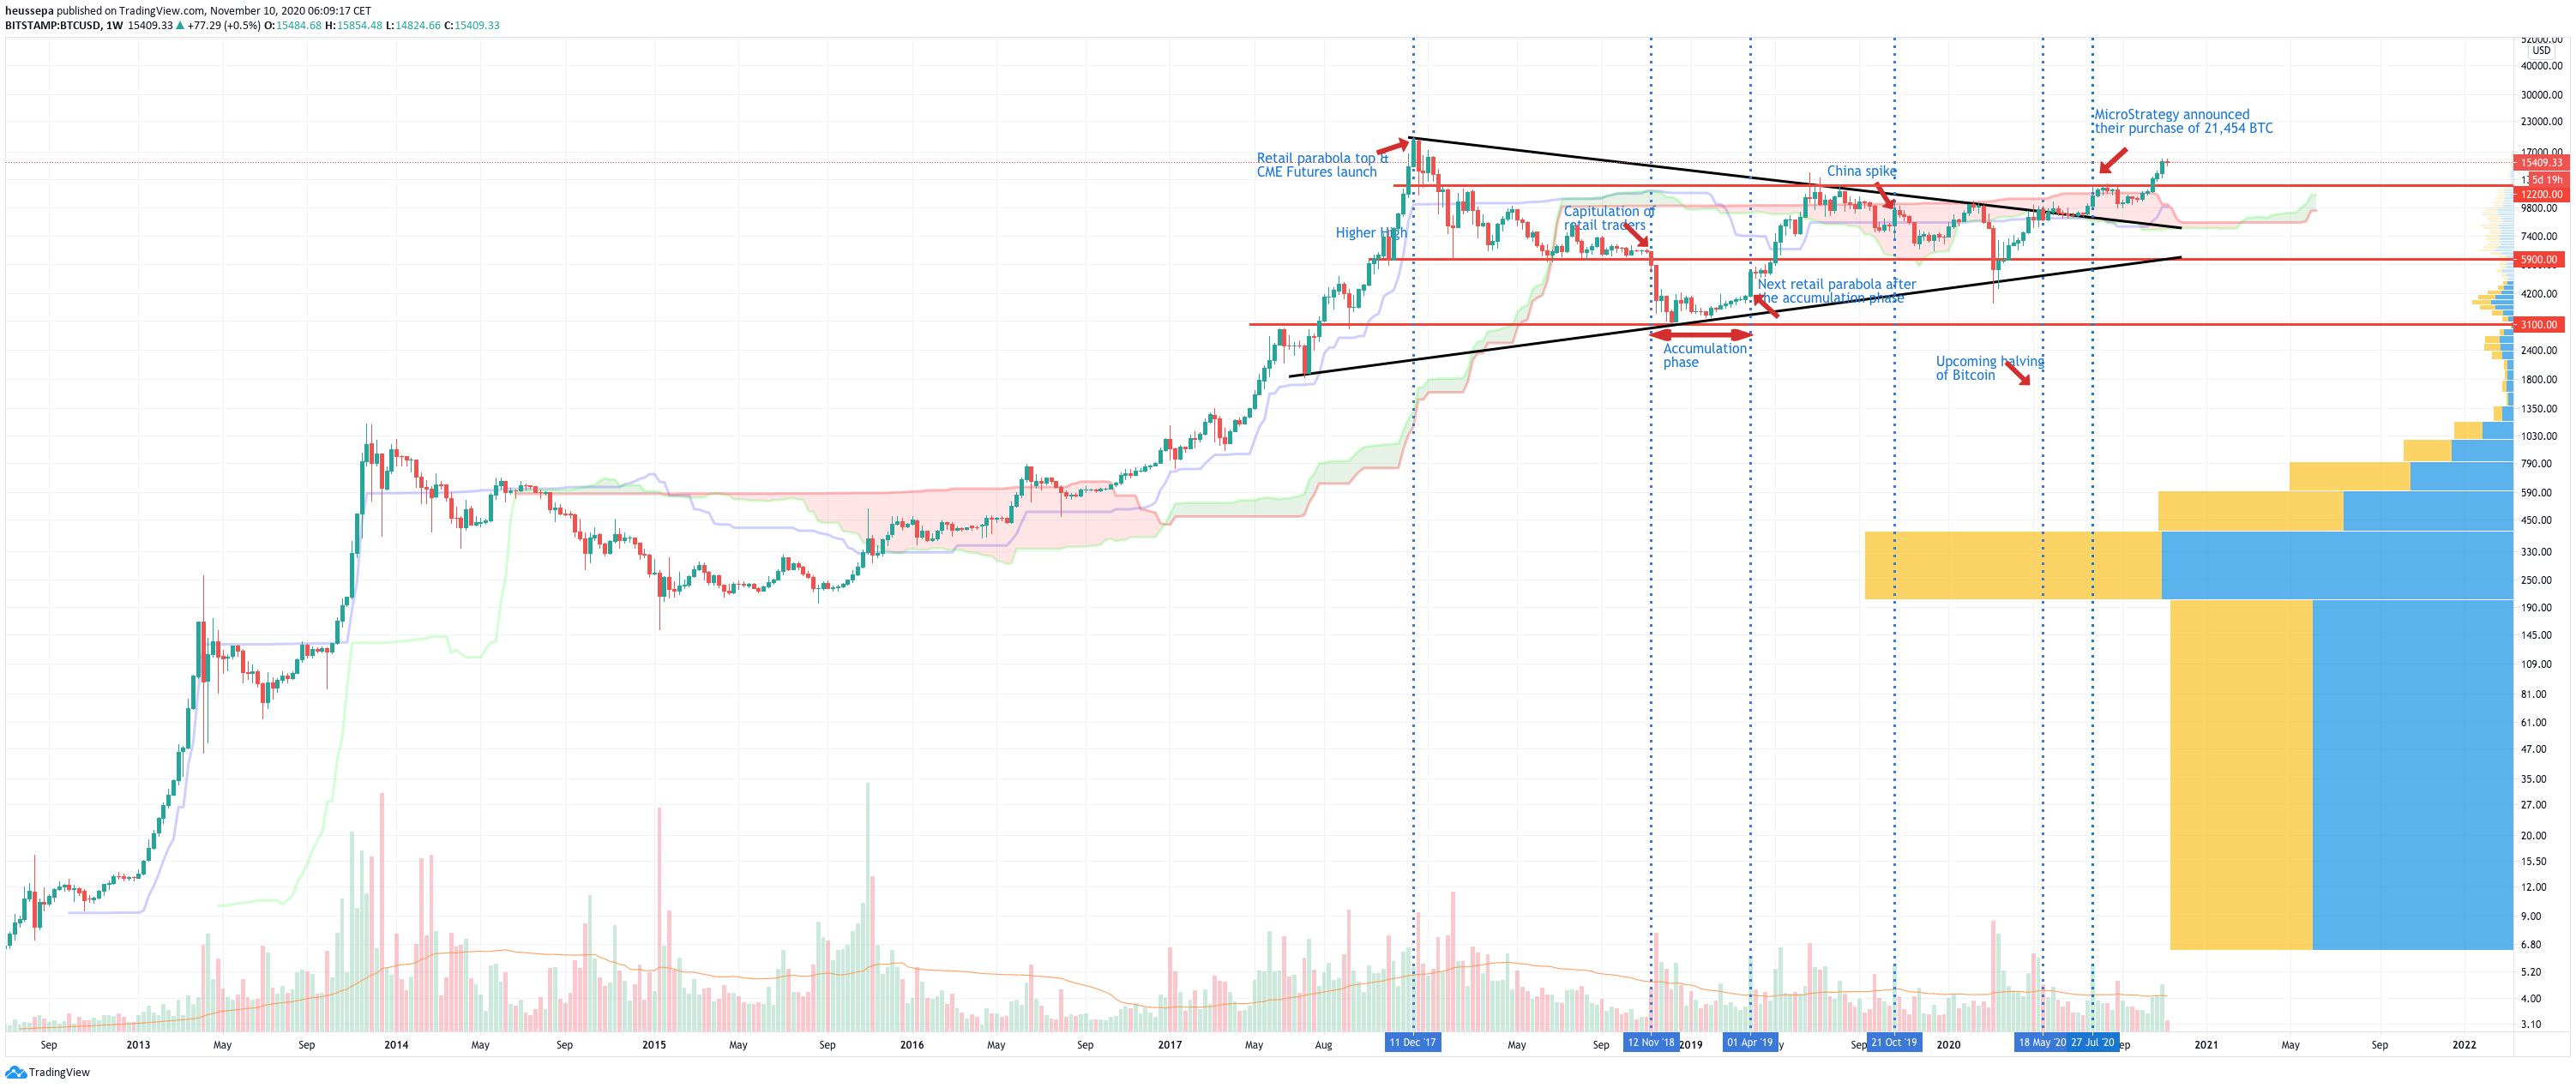
A great deal has happened over the past three years when this large triangle has formed. The breakout occurred in the summer of 2020, with the last noteworthy macro news being large corporates announcing that they had purchased bitcoin.
The prices have pushed out of the cloud and the cloud has turned bullish. It is only the third time that this has happened. So far, we are on track to the target of this large triangle, which comes in at around $40k.
$12.2k looks like a good support level for long-term traders. The upside is very much uncharted territory. Only the ATH is out there as our last reference point.
BTC (4h)
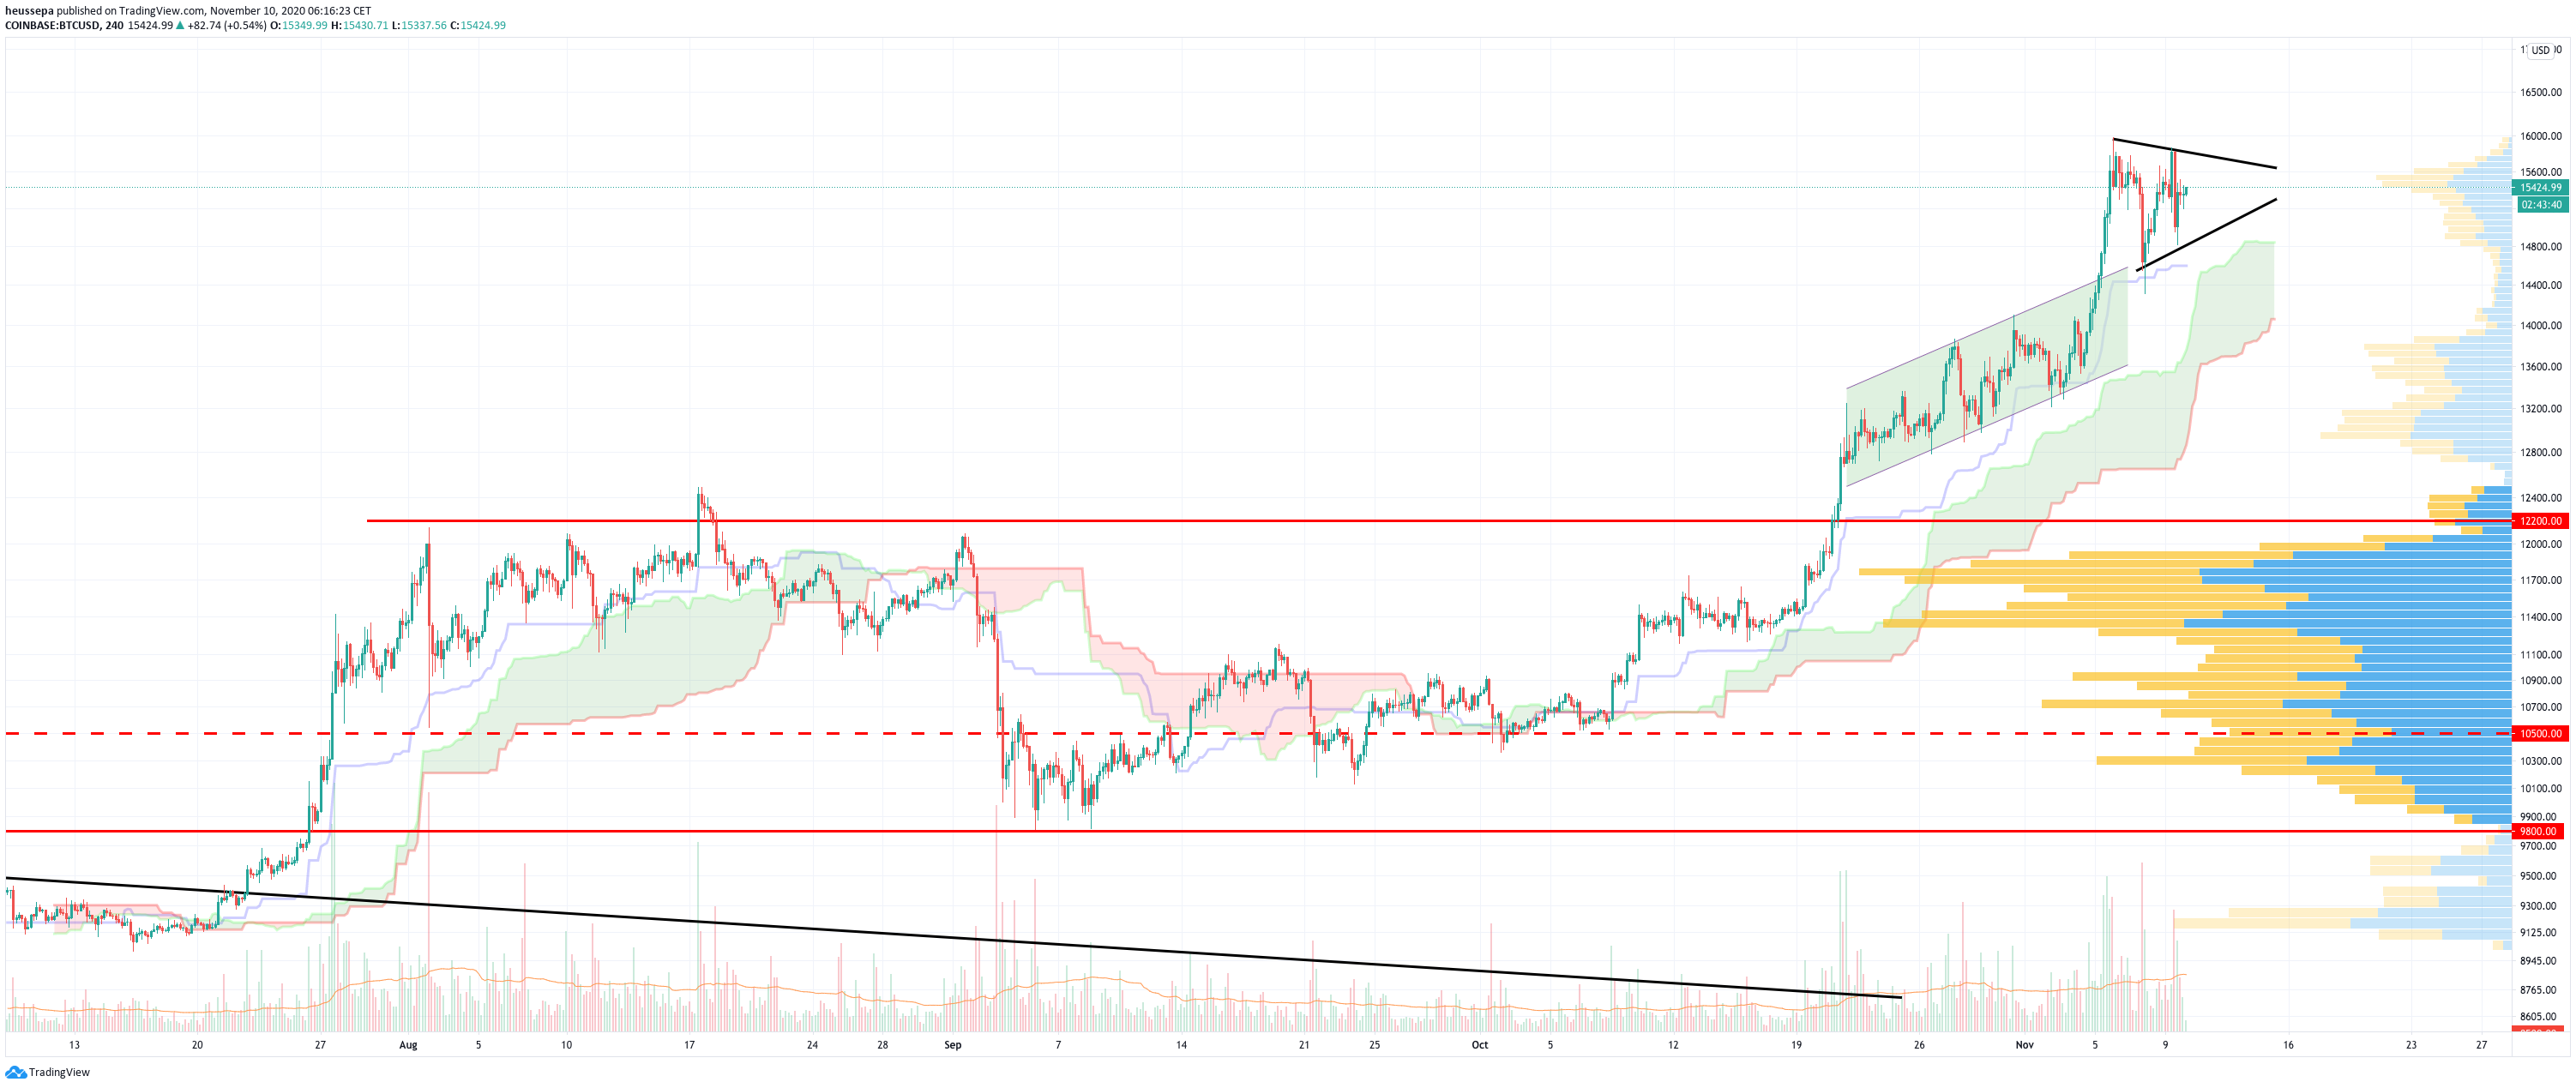
The market looks bullish - there is no doubt about it. We were shown some signs of overheating when we hit the $16k level. This then resulted in a swift correction back down to roughly $14.3k, but was bought up quickly by fresh spot/cash buyers.
The setup looks good for a triangle consolidation phase, which could last for another 5-7 days. To me, the triangle formation is too early to call. Therefore, I would rather play the range $14-16k.
ETH (weekly)
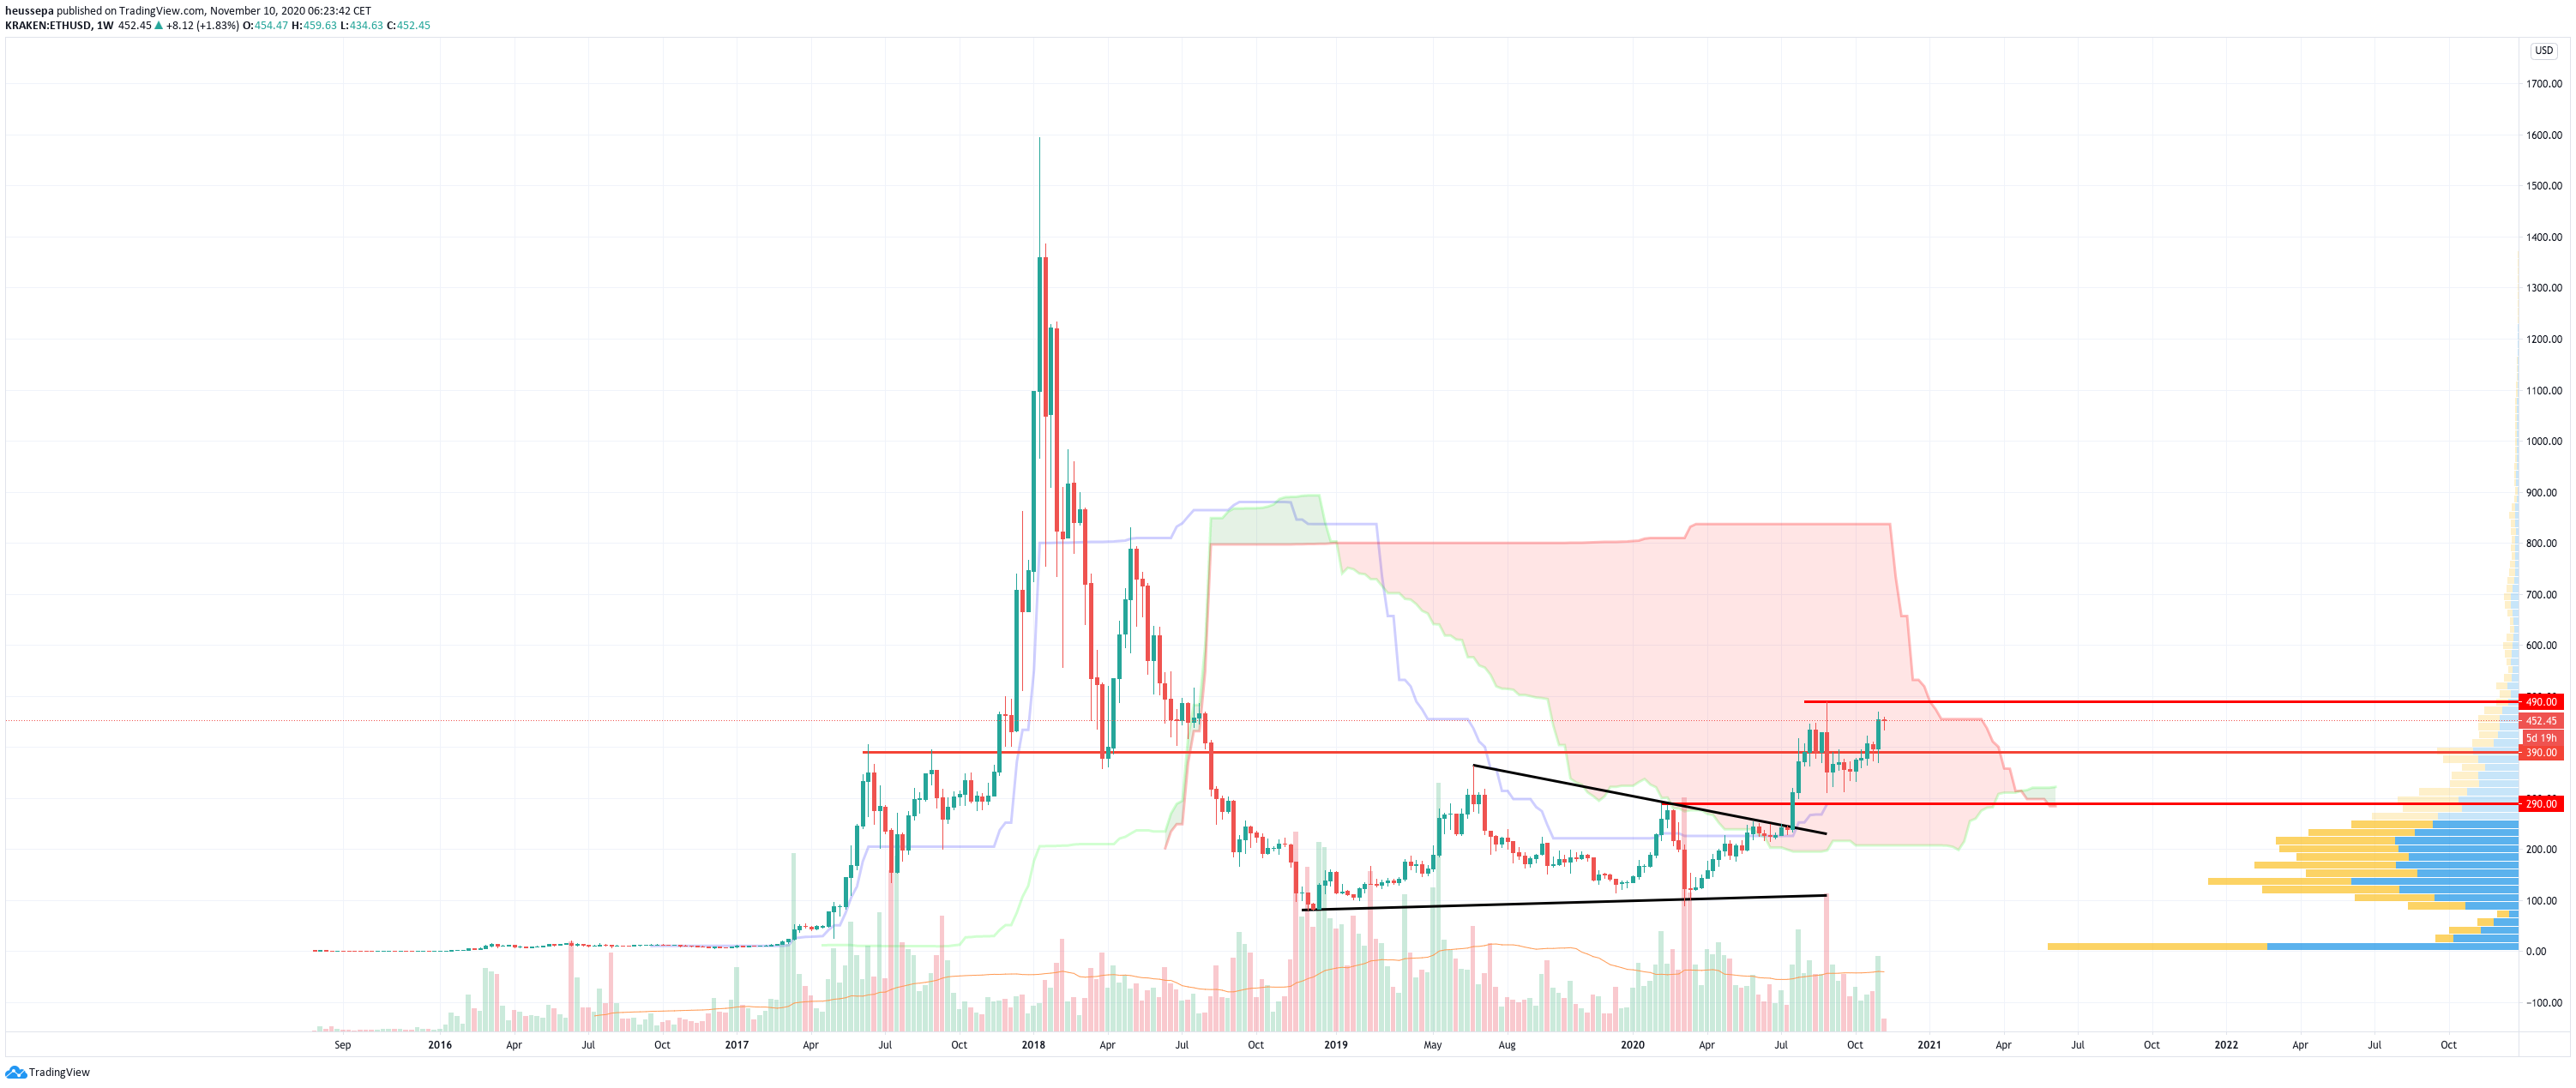
We just turned bullish on the Ichimoku cloud (which, by the way, was a very large bearish cloud). $500 will be the level to watch and break if we want to keep up the bullish momentum.
Similar to that of the BTC$ weekly chart, I would like to see the price push out of the cloud (with the cloud still in bullish mode). Some further consolidation is probably needed. Play the range of $390-$490.
ETH (4h)
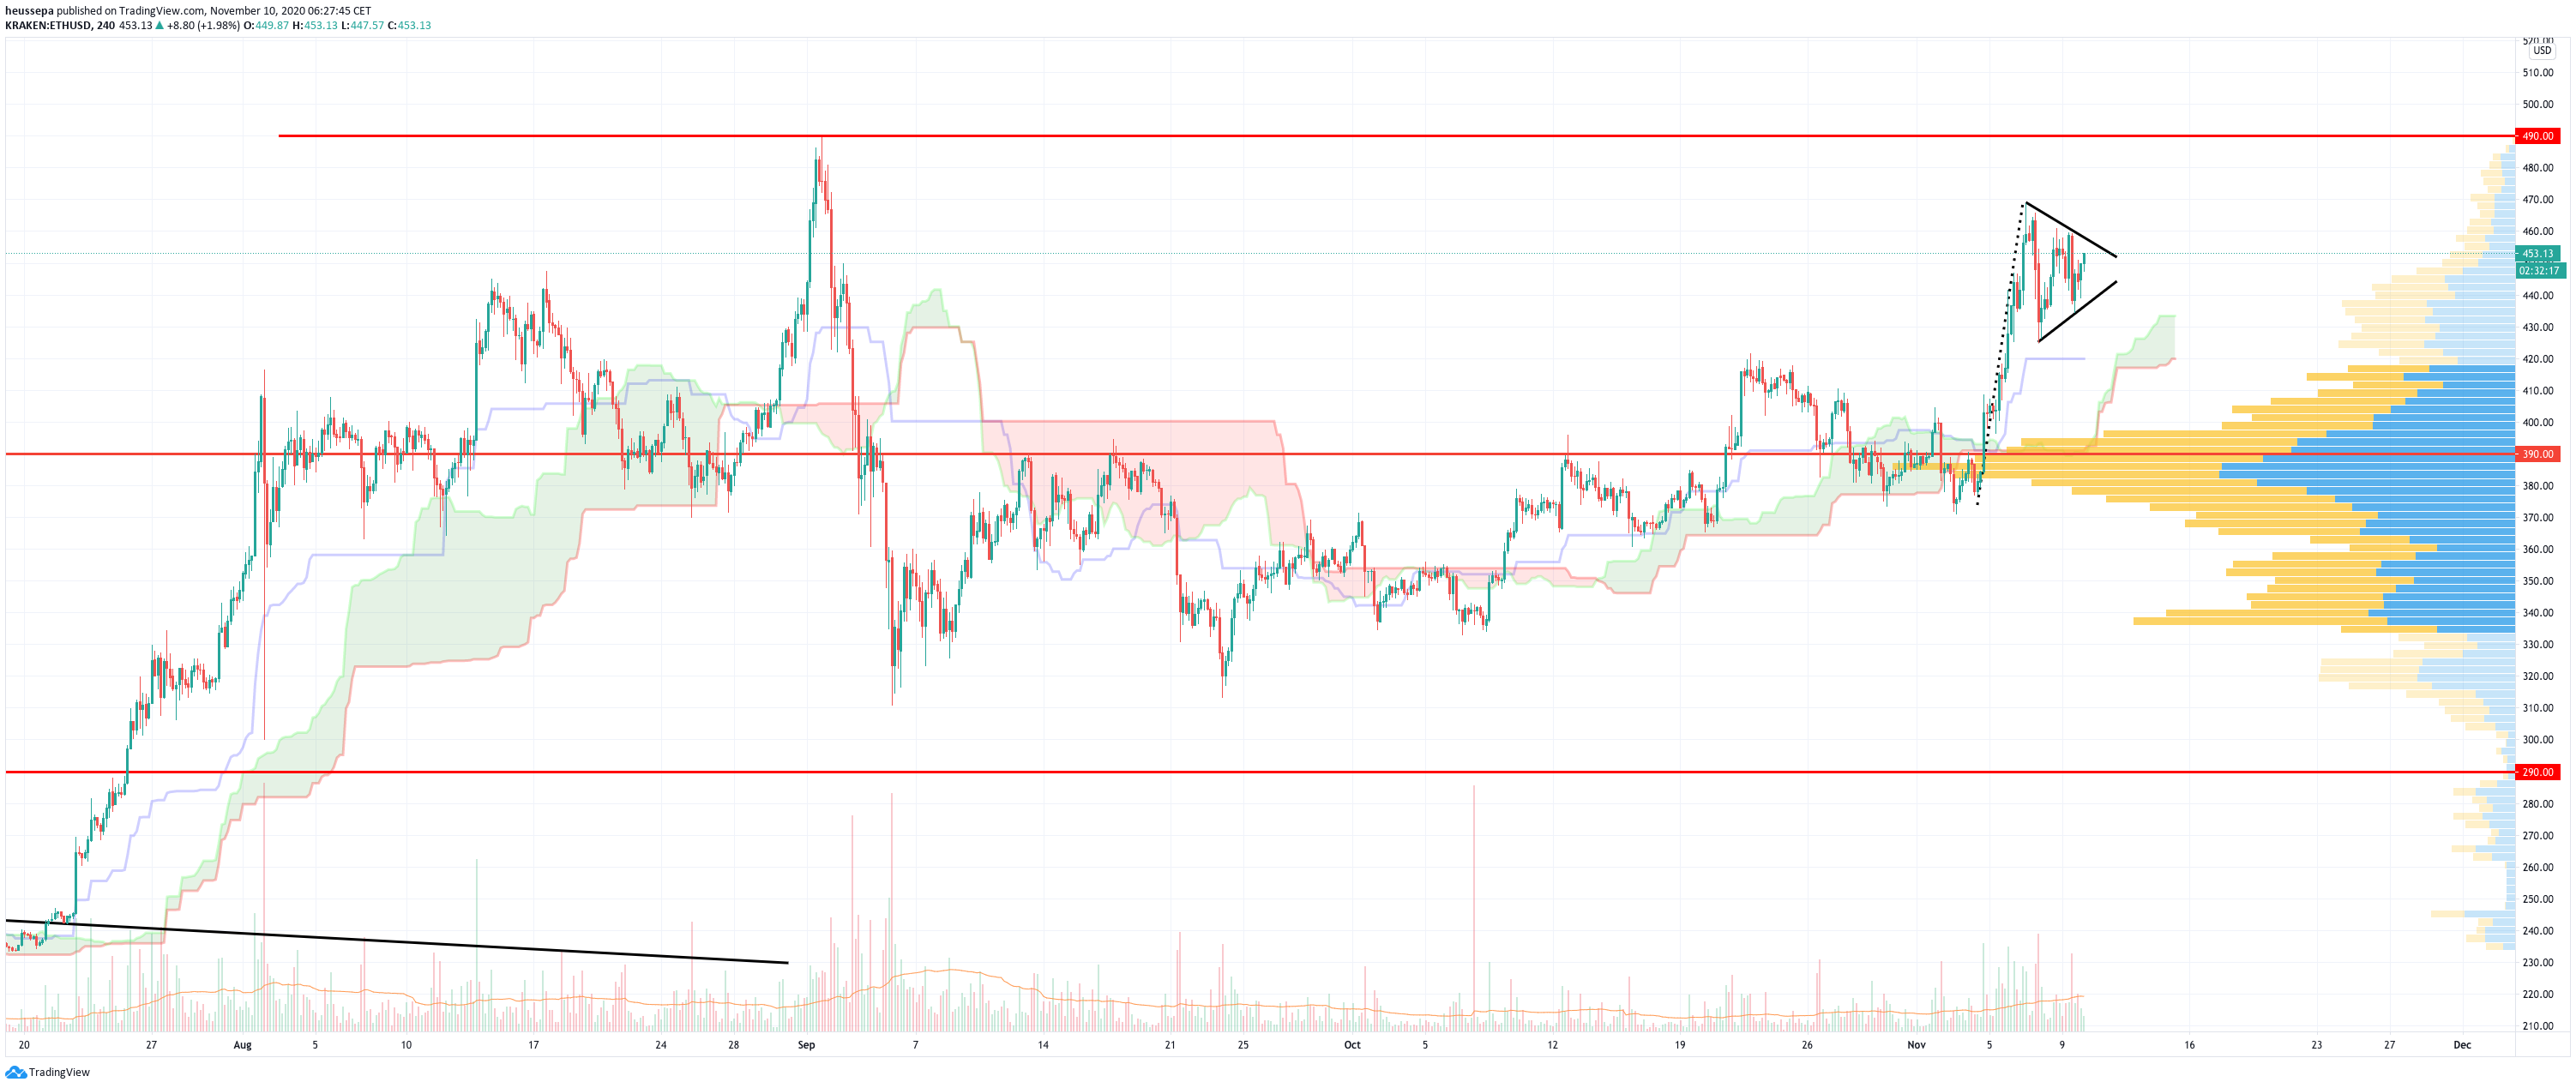
The bullish momentum is fully intact. Maybe we are just forming a bull flag (confirmation if price is above $465-ish). But other than that, the same range applies that I mentioned on the weekly chart: $390-$490.
ETH/BTC (daily)
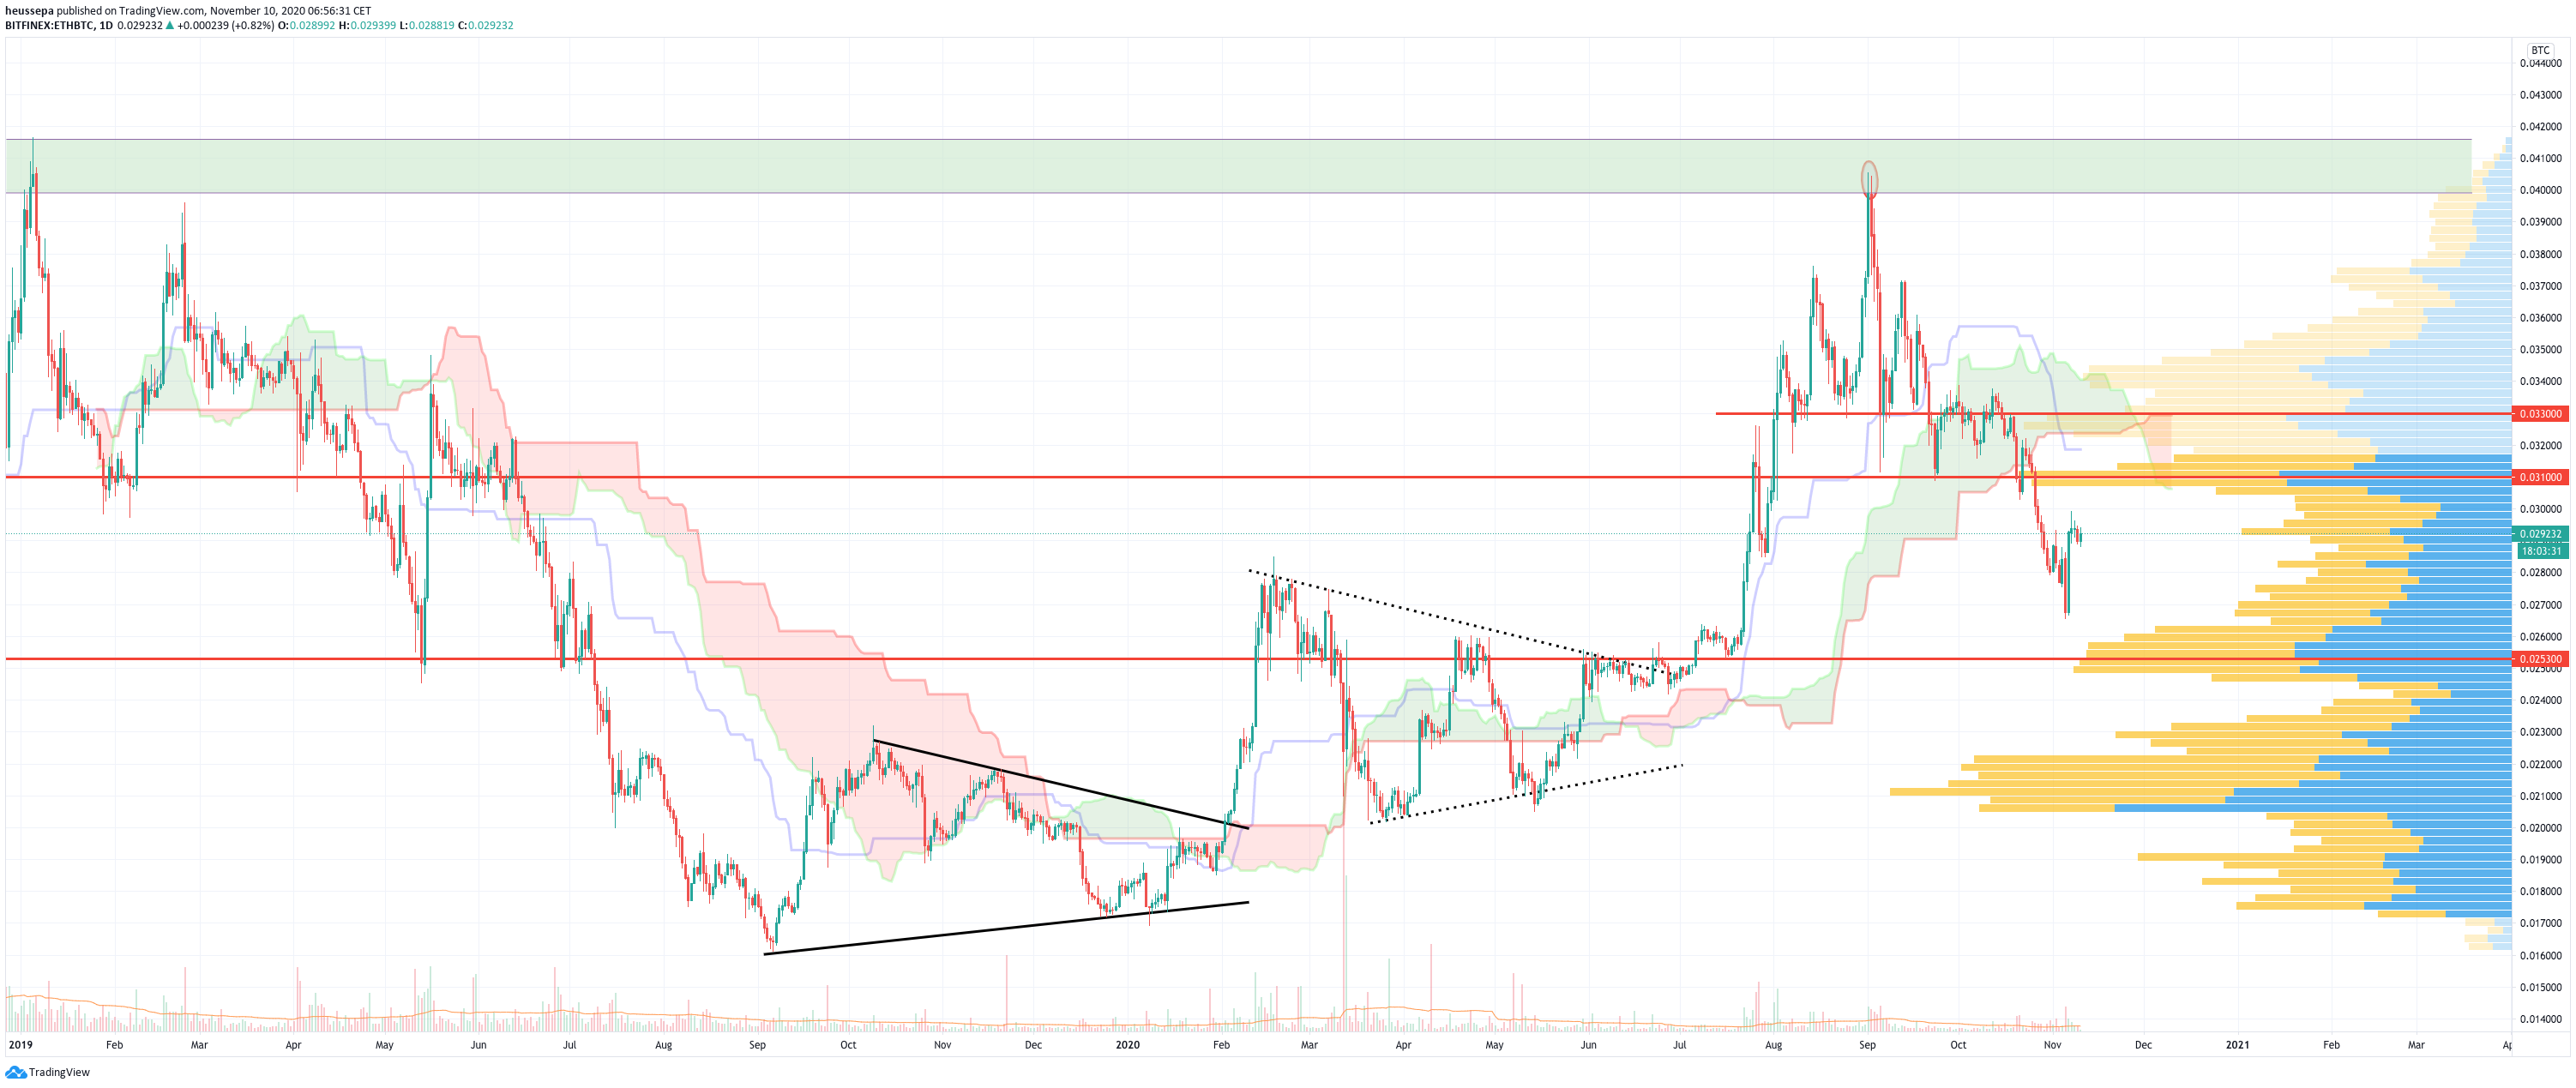
This is the pair that keeps me up at night. We have seen a nice correction from the blow-off top just above 0.040 down to 0.027 (almost 35%).
The chart has not turned bullish yet from the indicators I am watching. But with the price being close to a very strong support line at 0.0253, it is worth trying to take the first leg of a long position (we entered at around 0.0275).
First resistance is 0.031 and then either the push through the cloud or 0.033. I will give up my longs when we break through 0.025.
Now, let's move on to my list. I will show you the ones that have a noteworthy setup. Plus, I will try to add some fundamental analyses.
Technische Analyse Altcoins (4h)
AAVE (4h)
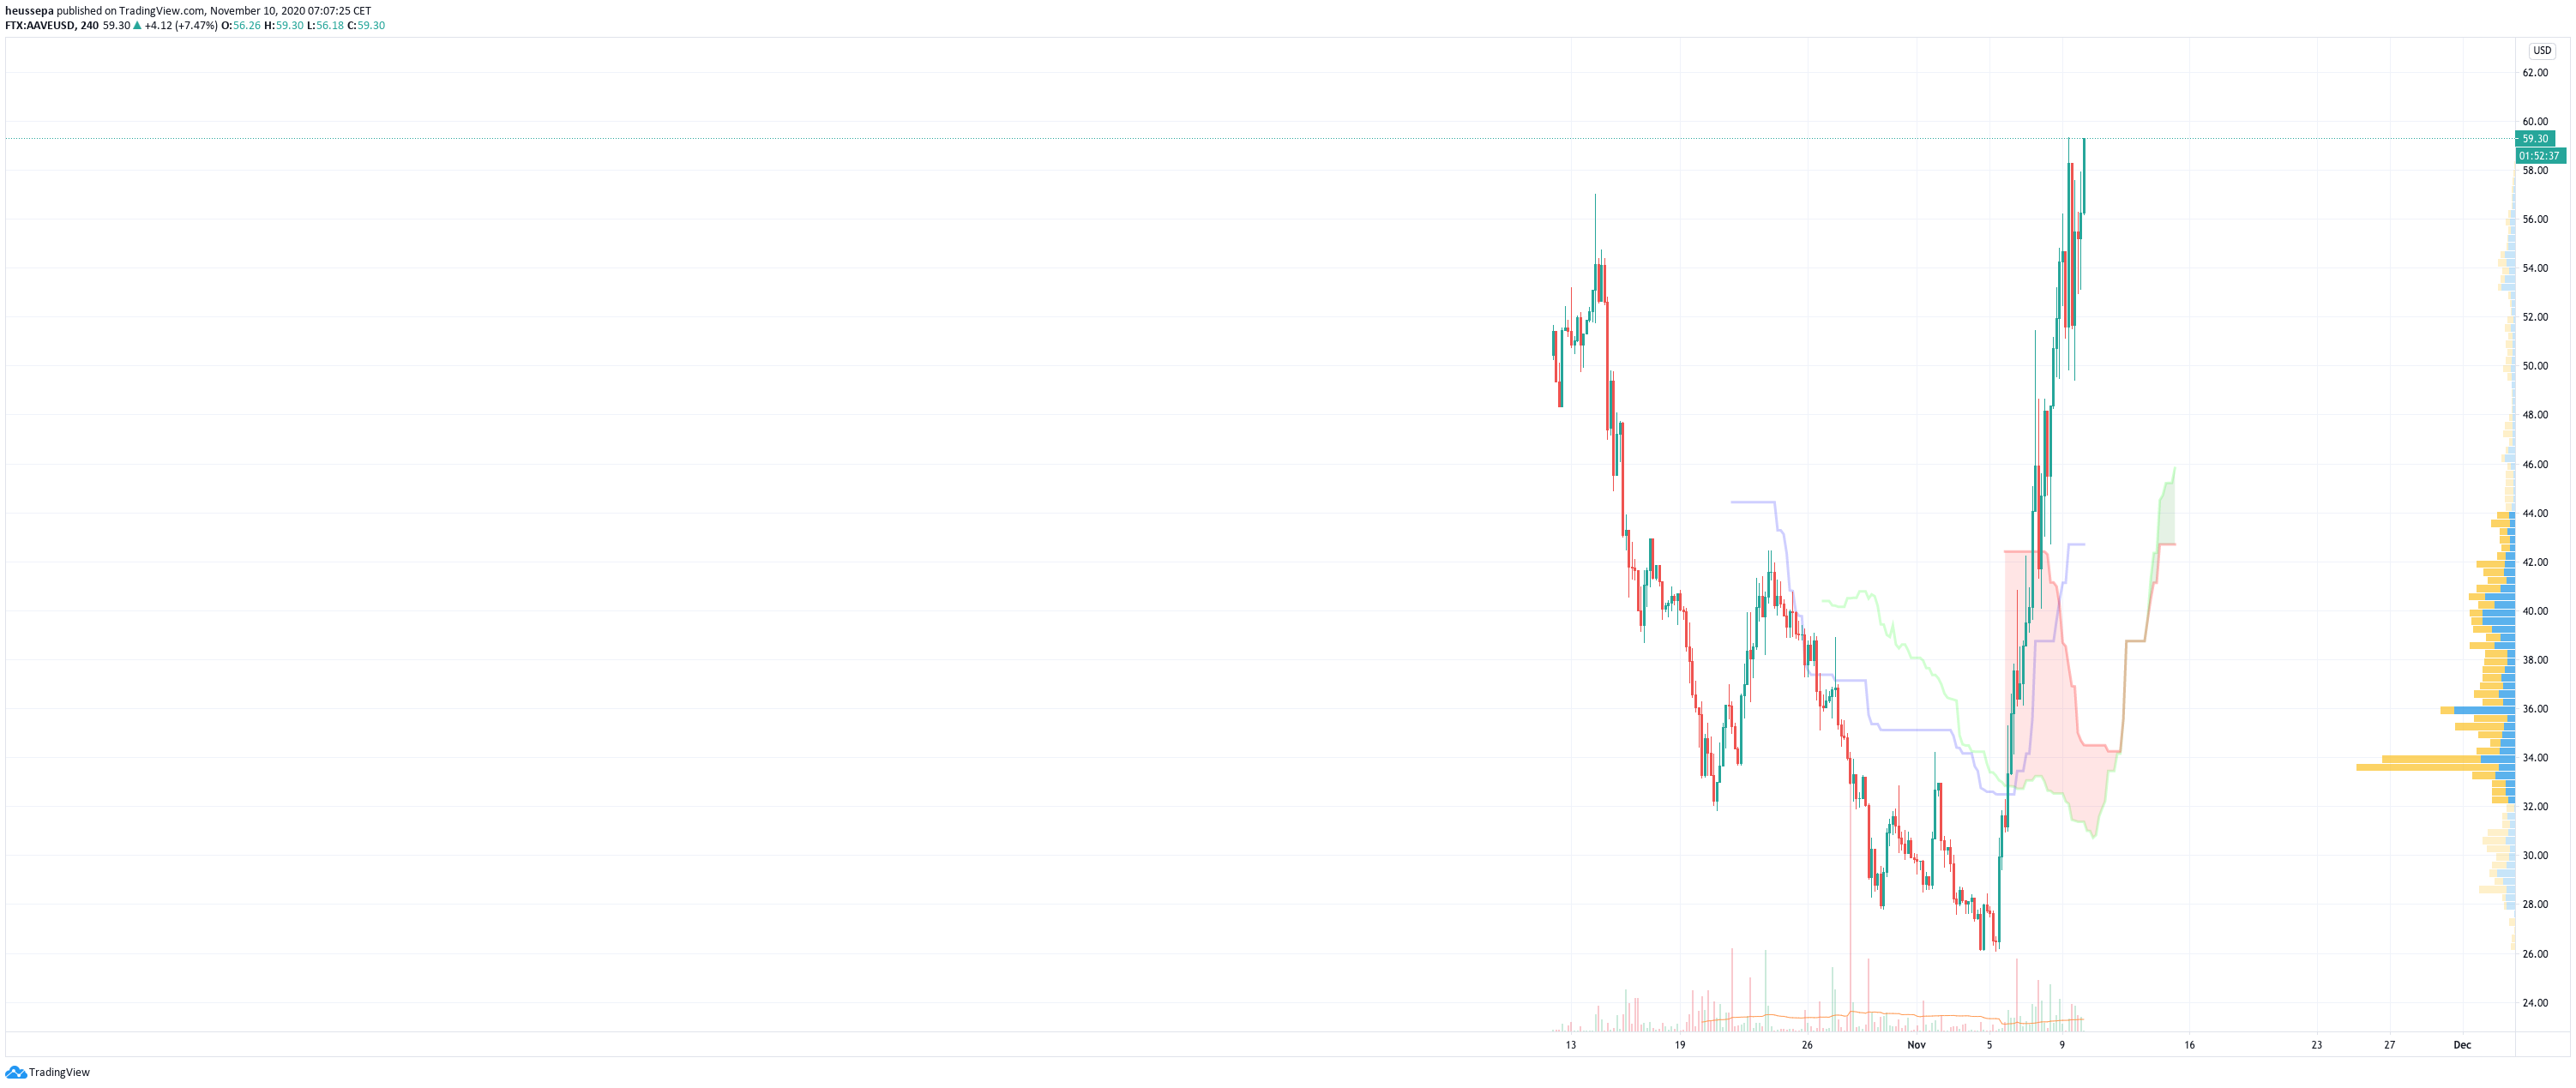
We saw a massive v-shape correction just after the LEND --> AAVE migration. Agreed, there is not really enough data to chart, but I am a huge believer in the AAVE platform. I am long, and this is one of the long-term investments. Also, the platform offers reasonable staking possibilities to offset some of the inflation.
COMP (4h)
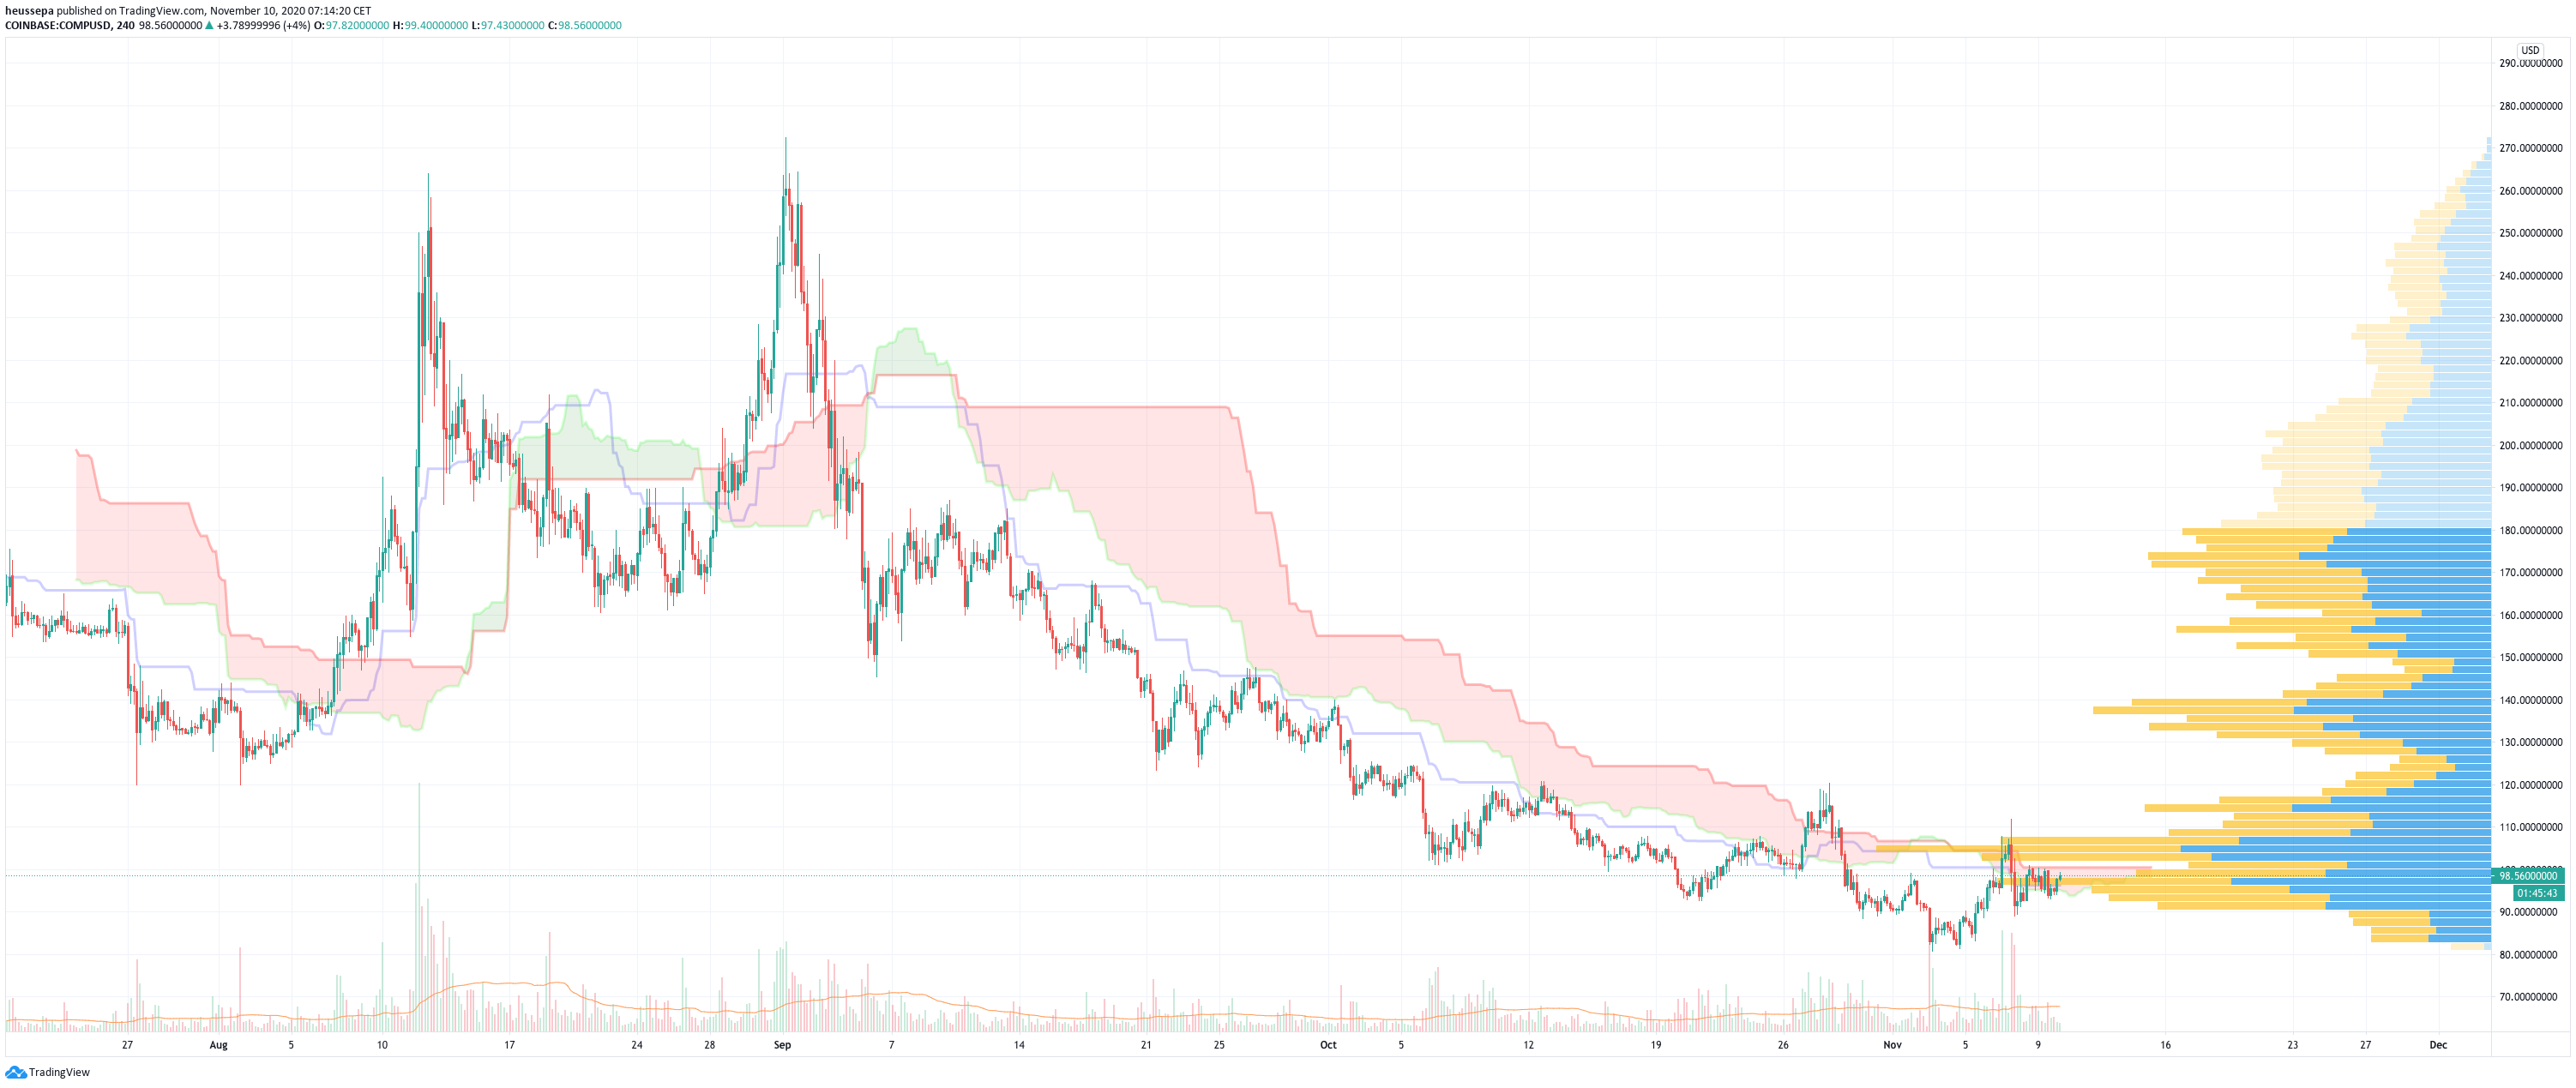
Compound is one of the heavyweights and has not yet shown a bullish structure. The last higher low was in October at around $120. This needs to be taken out for me as a confirmation to turn bullish.
LINK (4h)
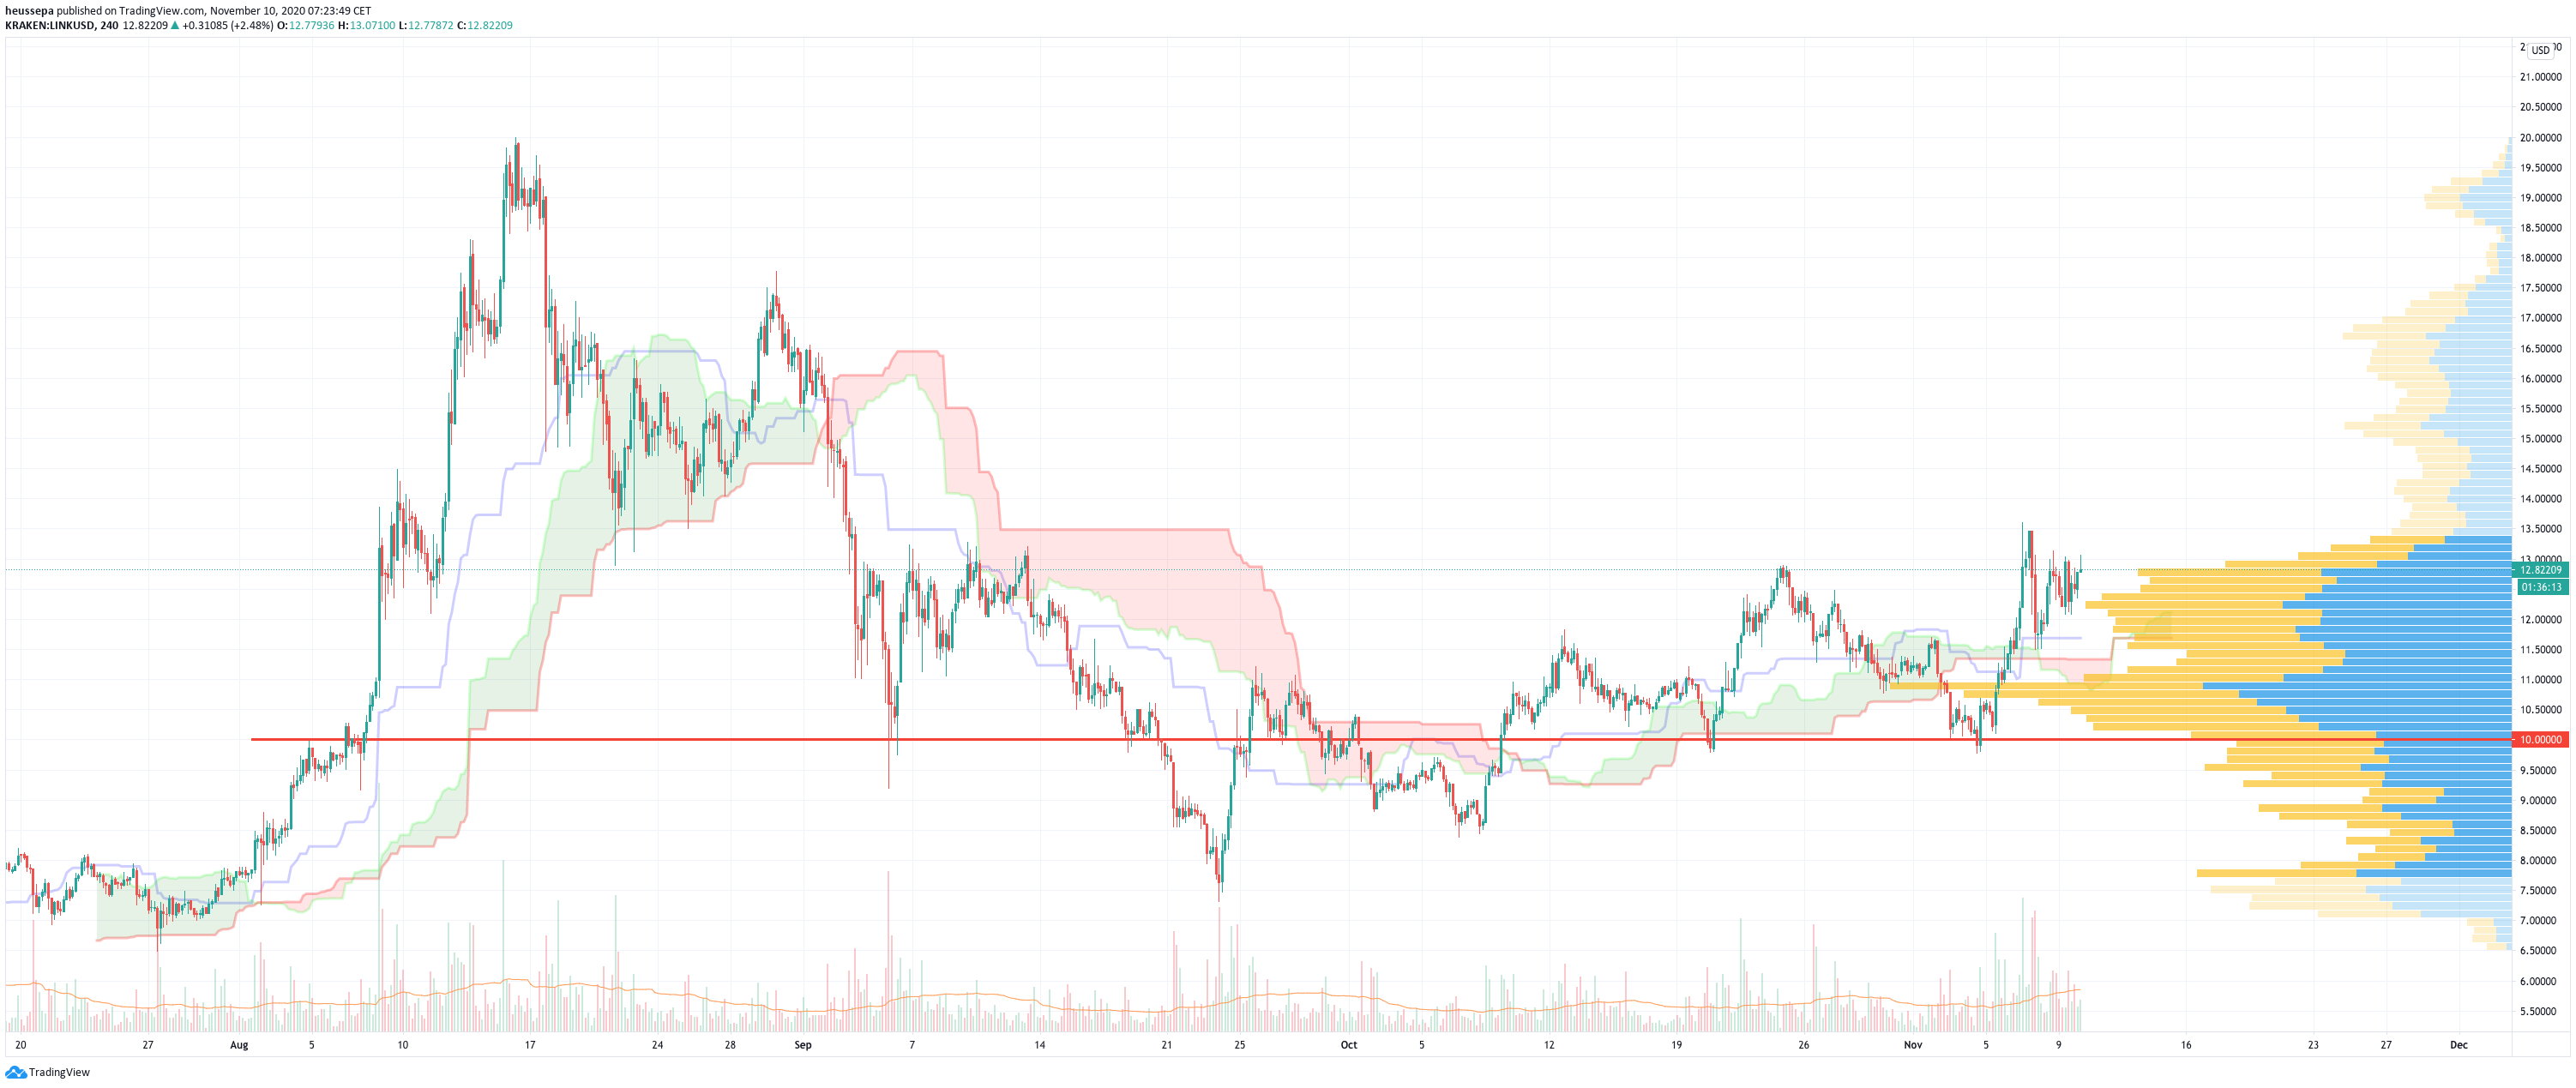
This is one of the few coins that managed to turn the bearish wave structure into a bullish one (already at around mid-October). The major support line of $10 needs to hold for further bullish momentum. I am long and am looking for further upside towards $17. The stop is below $10.
SOL (4h)
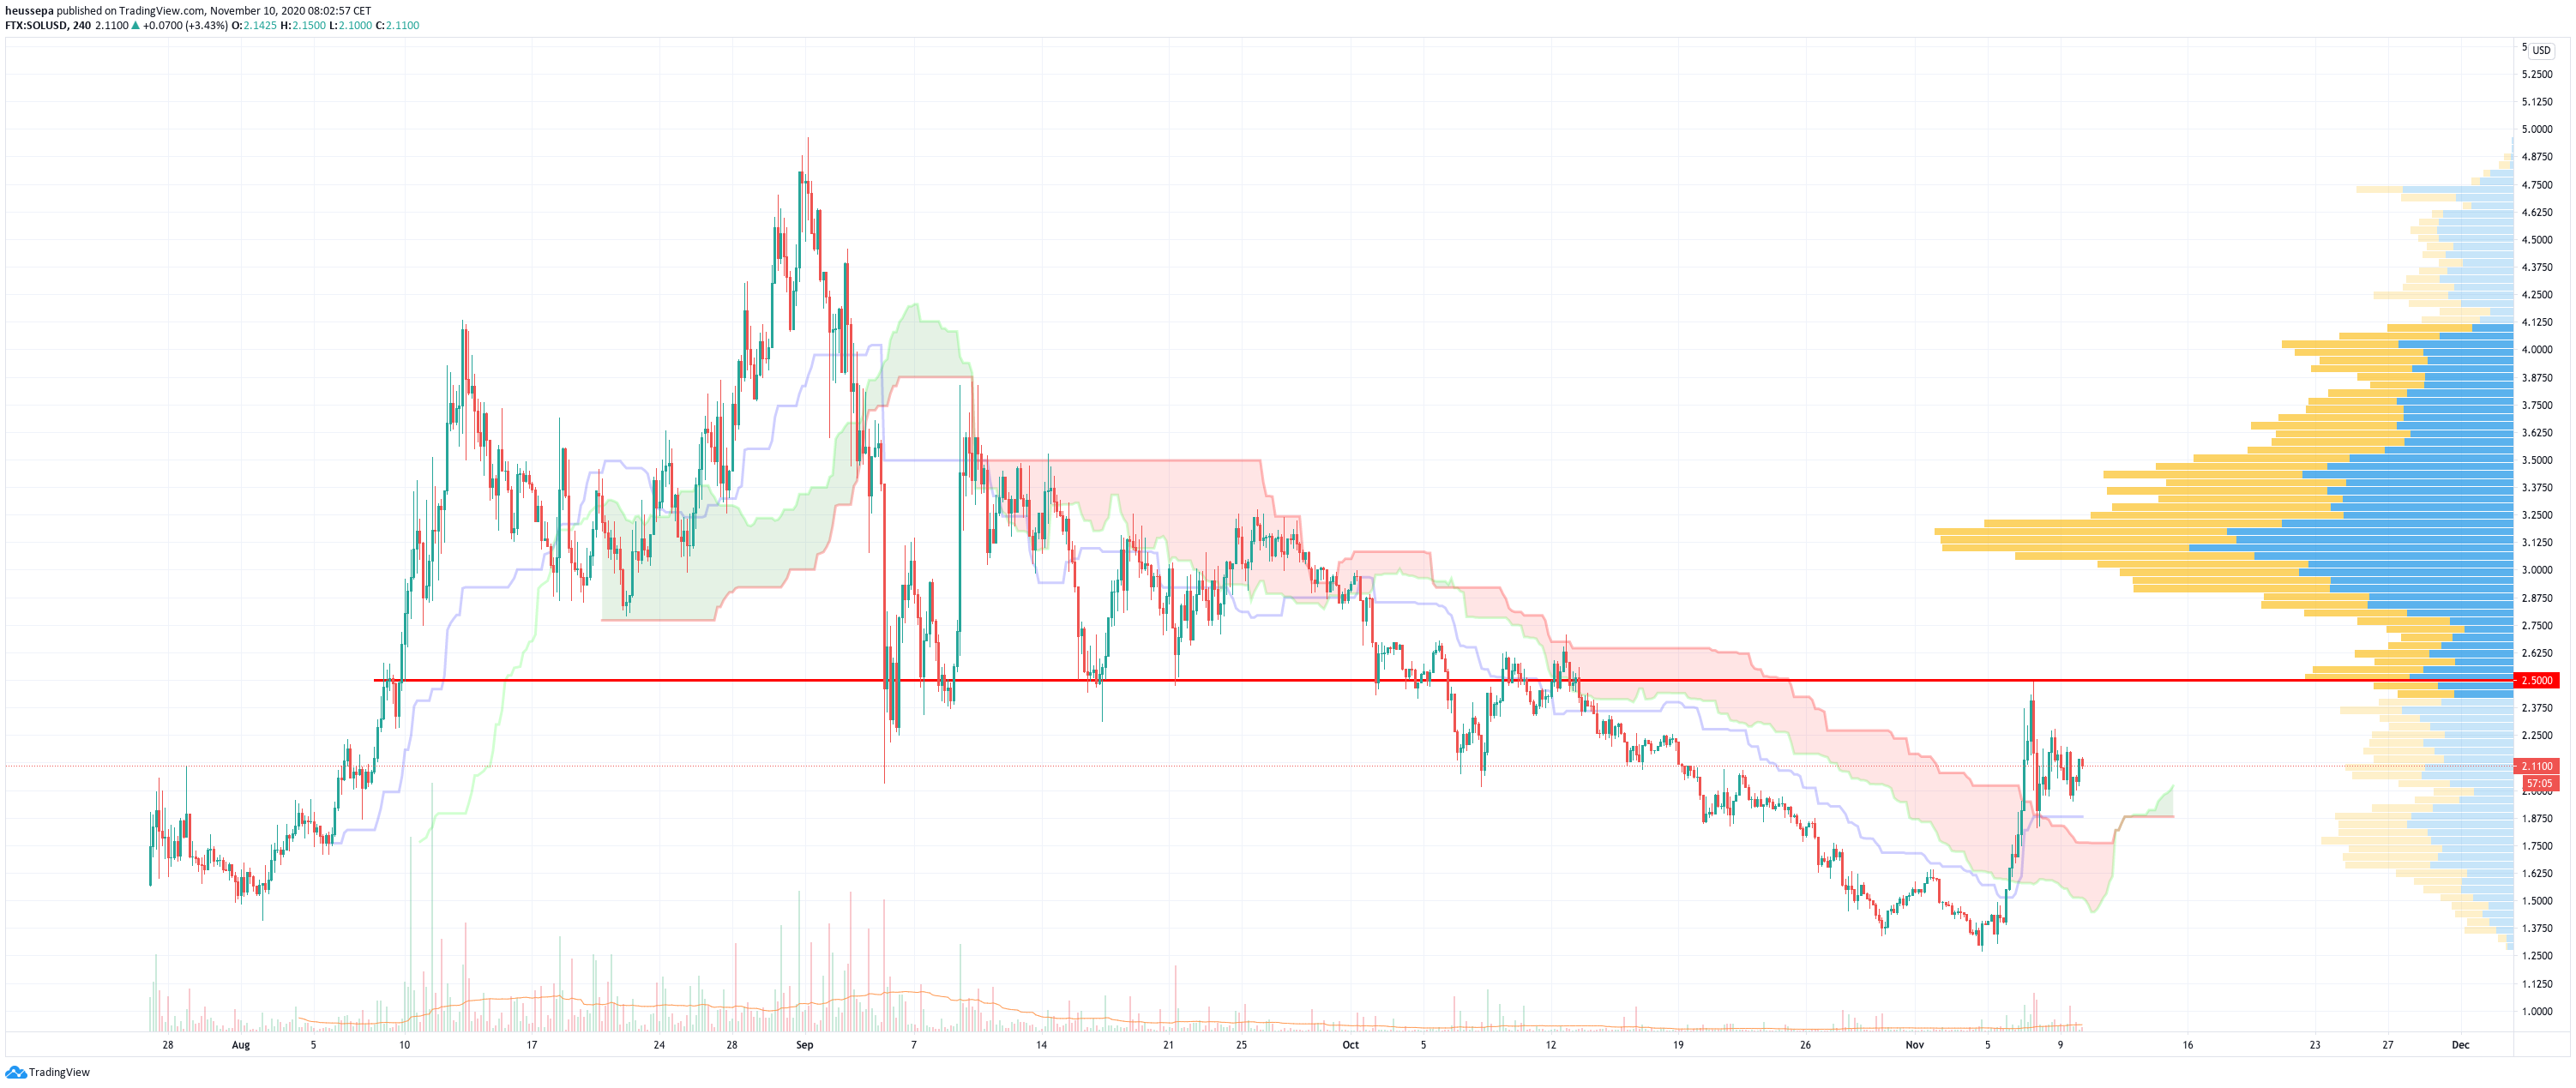
This was initially a pretty hyped coin with some high volatility. A nice s/r flip line is $2.50. I am already long from higher levels, but am looking to add more when we push through $2.50. The only thing to remember (or watch) is the emission schedule. The lock-up period of VC stakes will be set free in January 2021, which might flood the market.
SNX (4h)
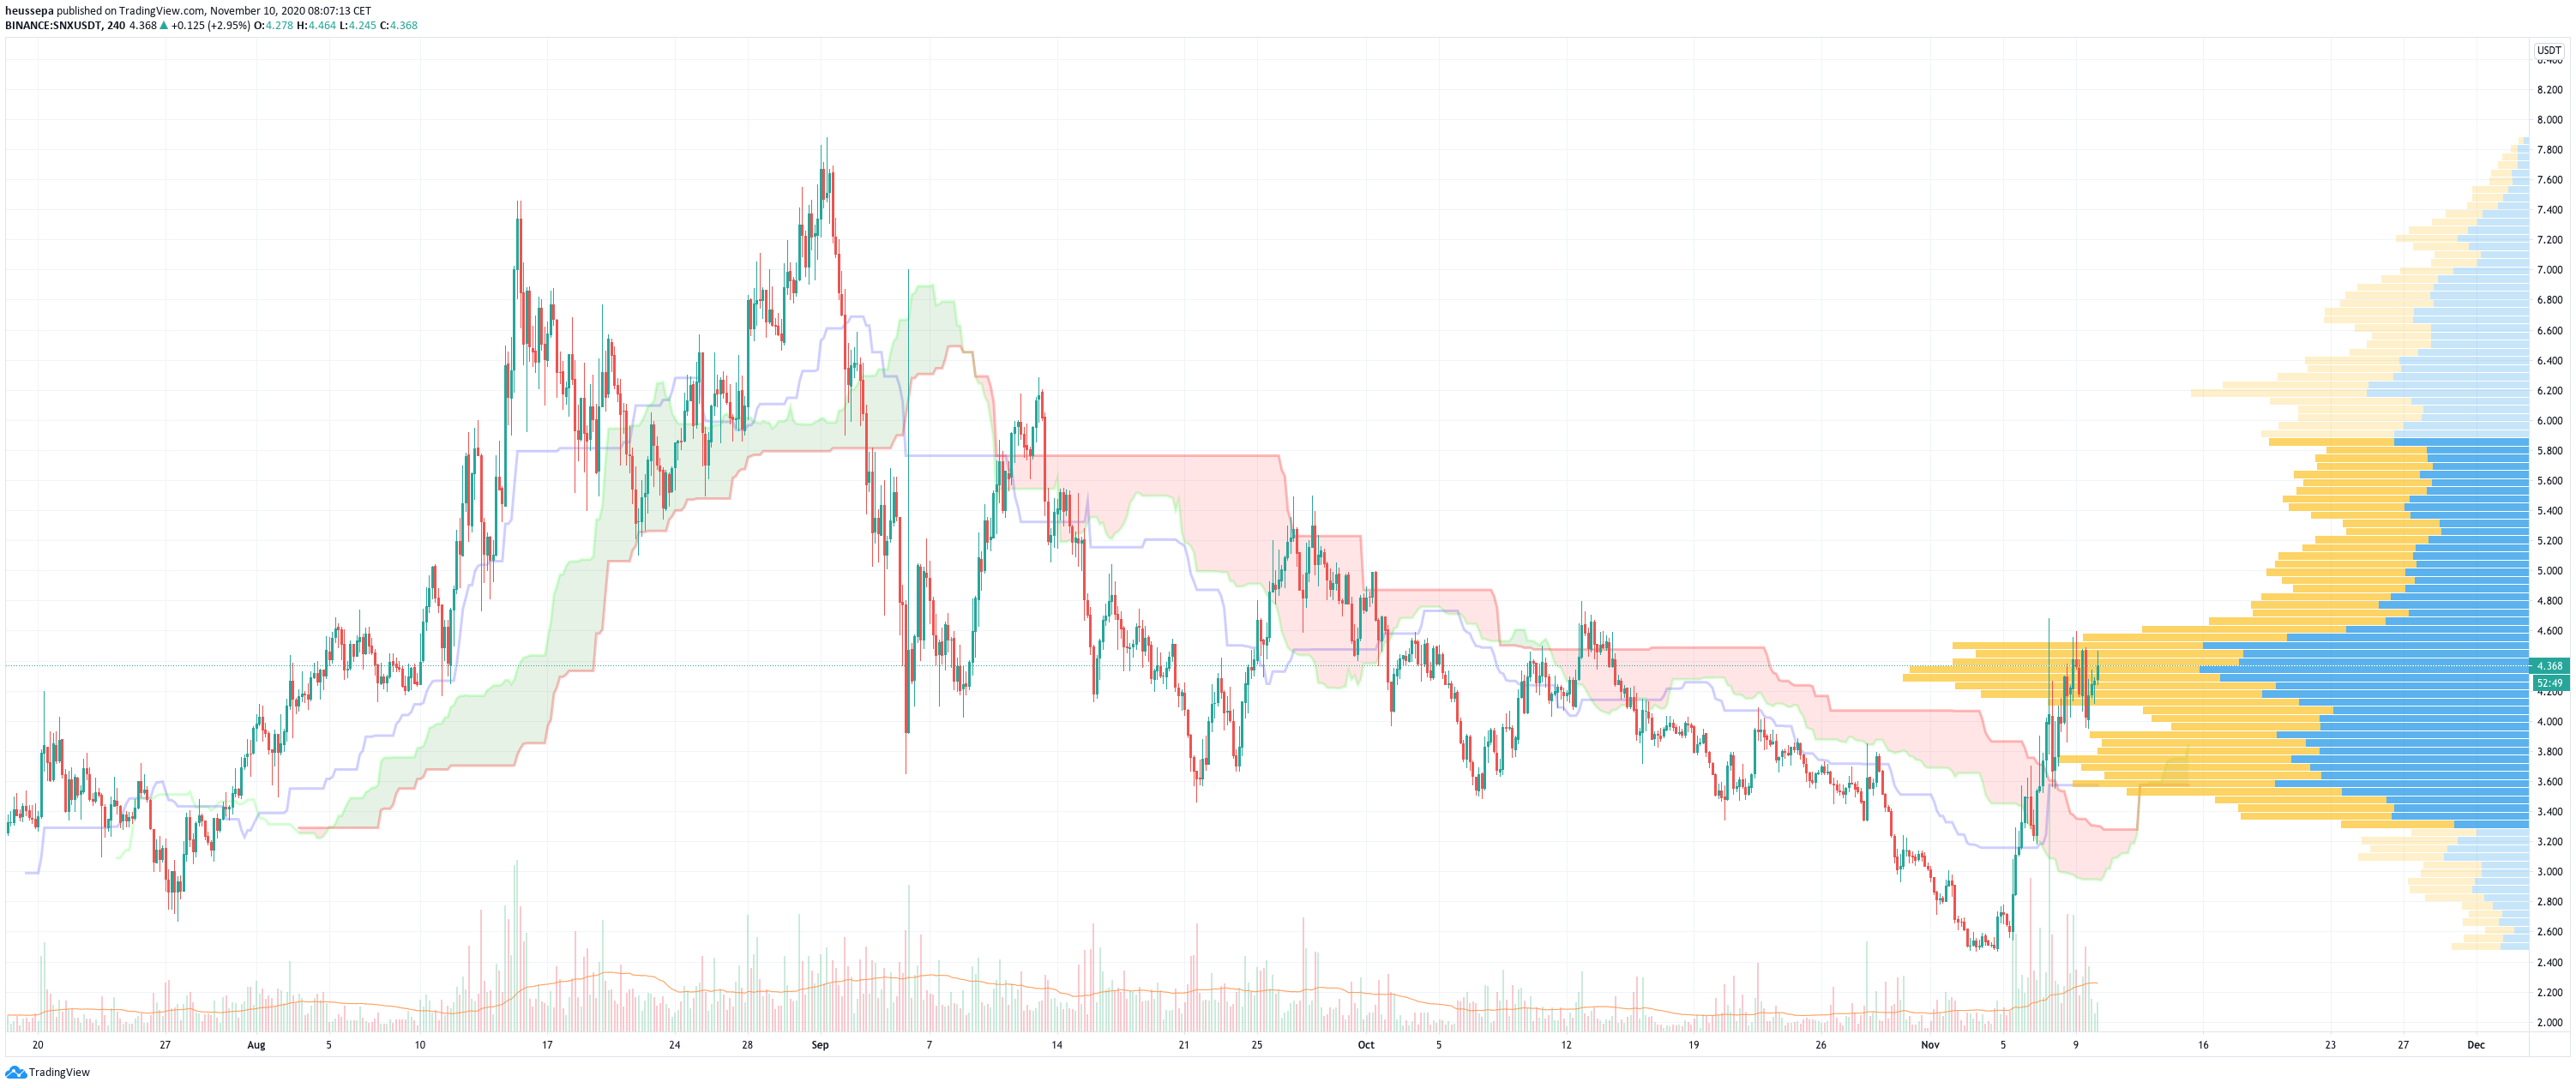
There was another impressive move by Synthetix.
With lots of volume, the coin jumped from the $2.40 level straight up towards $4.50. There is some tough resistance between $4.50-$4.80, but I am confident that we will have the power to push through. The difficulty with this coin is to place a stop. In my opinion, the only proper stop is below $2.40.
YFI (4h)
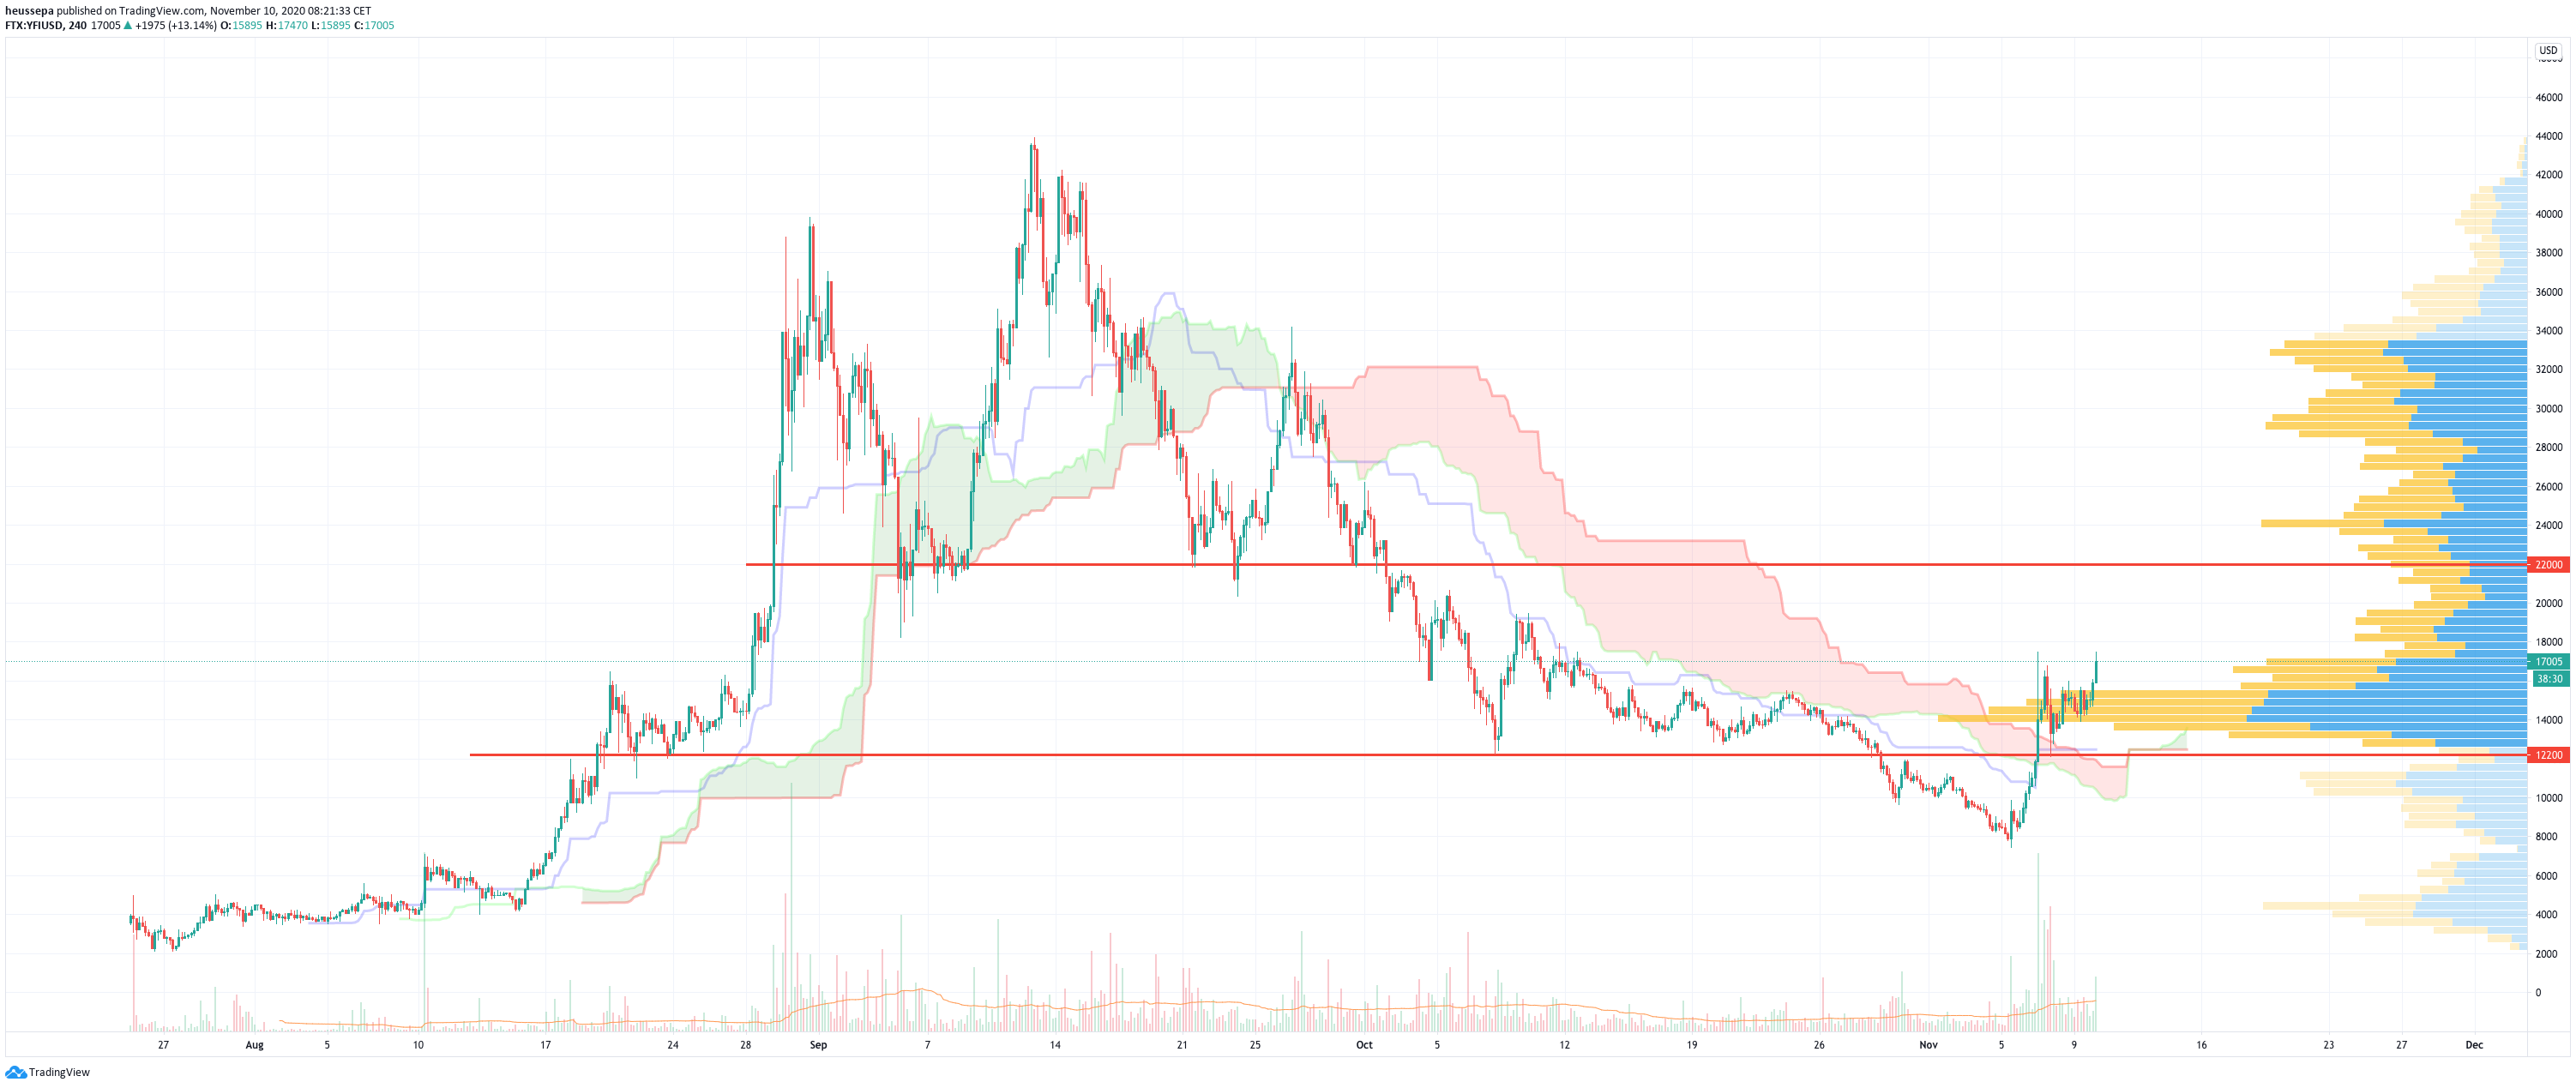
The big one among the DeFi tokens. It is massively volatile, but (in my view) a coin to have as a longer term investment. The large shoulder-head-shoulder formation, with the neck line at around $22k, almost reached its target when we traded below $8k. In my opinion, it is time for a reversal. The first indication was the push through the $12k level. The next tough resistance level will be $22k (the neck line).
Diese Publikation und ihr Inhalt, einschliesslich aller Namen, Logos, Designs und Marken sowie aller damit verbundenen Immaterialgüter- und sonstigen Rechte sind Eigentum der Crypto Broker AG oder Dritter. Sie dürfen ohne deren vorherige Zustimmung nicht vervielfältig oder weiterverwendet werden.
Haftungsausschluss
Alle Angaben in dieser Publikation erfolgen ausschliesslich zu allgemeinen Informationszwecken. Die in dieser Publikation zur Verfügung gestellten Informationen stellen keine Anlageberatung dar und sind auch nicht als solche beabsichtigt. Diese Publikation stellt kein Angebot und keine Empfehlung oder Aufforderung für eine Anlage in ein Finanzinstrument einschliesslich Kryptowährungen und dergleichen dar und ist auch nicht als solches Angebot, Empfehlung oder Aufforderung beabsichtigt. Diese Publikation ist nicht für Werbezwecke bestimmt, sondern dient nur der allgemeinen Information. Die in der Publikation enthaltenen Inhalte stellen die persönliche Meinung der jeweiligen Autoren dar und sind nicht als Entscheidungsgrundlage geeignet oder beabsichtigt. Alle Beschreibungen, Beispiele und Berechnungen in dieser Publikation dienen nur der Veranschaulichung. Obwohl bei der Erstellung dieser Publikation mit üblicher Sorgfalt darauf geachtet wurde, dass die Angaben zum Zeitpunkt der Veröffentlichung zutreffend und nicht irreführend sind, übernimmt die Crypto Broker AG keinerlei Gewähr oder Garantie, weder ausdrücklich noch stillschweigend, in Bezug auf die darin enthaltenen Informationen, deren Marktfähigkeit oder Eignung für einen bestimmten Verwendungsweck oder hinsichtlich ihrer Genauigkeit, Richtigkeit, Qualität, Vollständigkeit oder Aktualität. Die Crypto Broker AG schliesst jede Haftung und Verantwortlichkeit für die Verwendung der in der Publikation enthaltenen Informationen, auch durch Dritte, im Zusammenhang mit Handels- oder anderweitigen Aktivitäten aus und ebenso für allfällige Fehler oder Unvollständigkeiten, welche in dieser Publikation enthalten sind.
Risikohinweis
Anlagen und Investitionen, insbesondere in Kryptowährungen, sind grundsätzlich mit Risiko verbunden. Der Totalverlust des eingesetzten Kapitals kann nicht ausgeschlossen werden. Kryptowährungen sind sehr volatil und können daher in kurzer Zeit extremen Kursschwanken ausgesetzt sein. Eine Nutzung der Informationen aus dieser Publikation erfolgt ausschliesslich und einzig auf eigenes Risiko des Nutzers. Ein Nutzer sollte sich in jedem Fall vor einer Anlage- und Investitionsentscheidung über die damit verbundenen Risiken im Klaren sein und sich bei Bedarf geeignet beraten lassen.
About the author
Patrick Heusser is Head of Trading at Crypto Broker AG. Prior to joining the company, Patrick worked as an Interest Rate Trader at UBS and held various positions in the IRCC (interest rate, commodity and foreign exchange trading) in London, New York, Singapore and Zurich. Patrick is an expert in trading and risk management. He also gained experience in other areas, such as building start-up companies. Patrick has a degree in banking from a business school. He has also taken various courses in technical chart analysis.
Related Articles

