Technical Analysis
Good Morning!
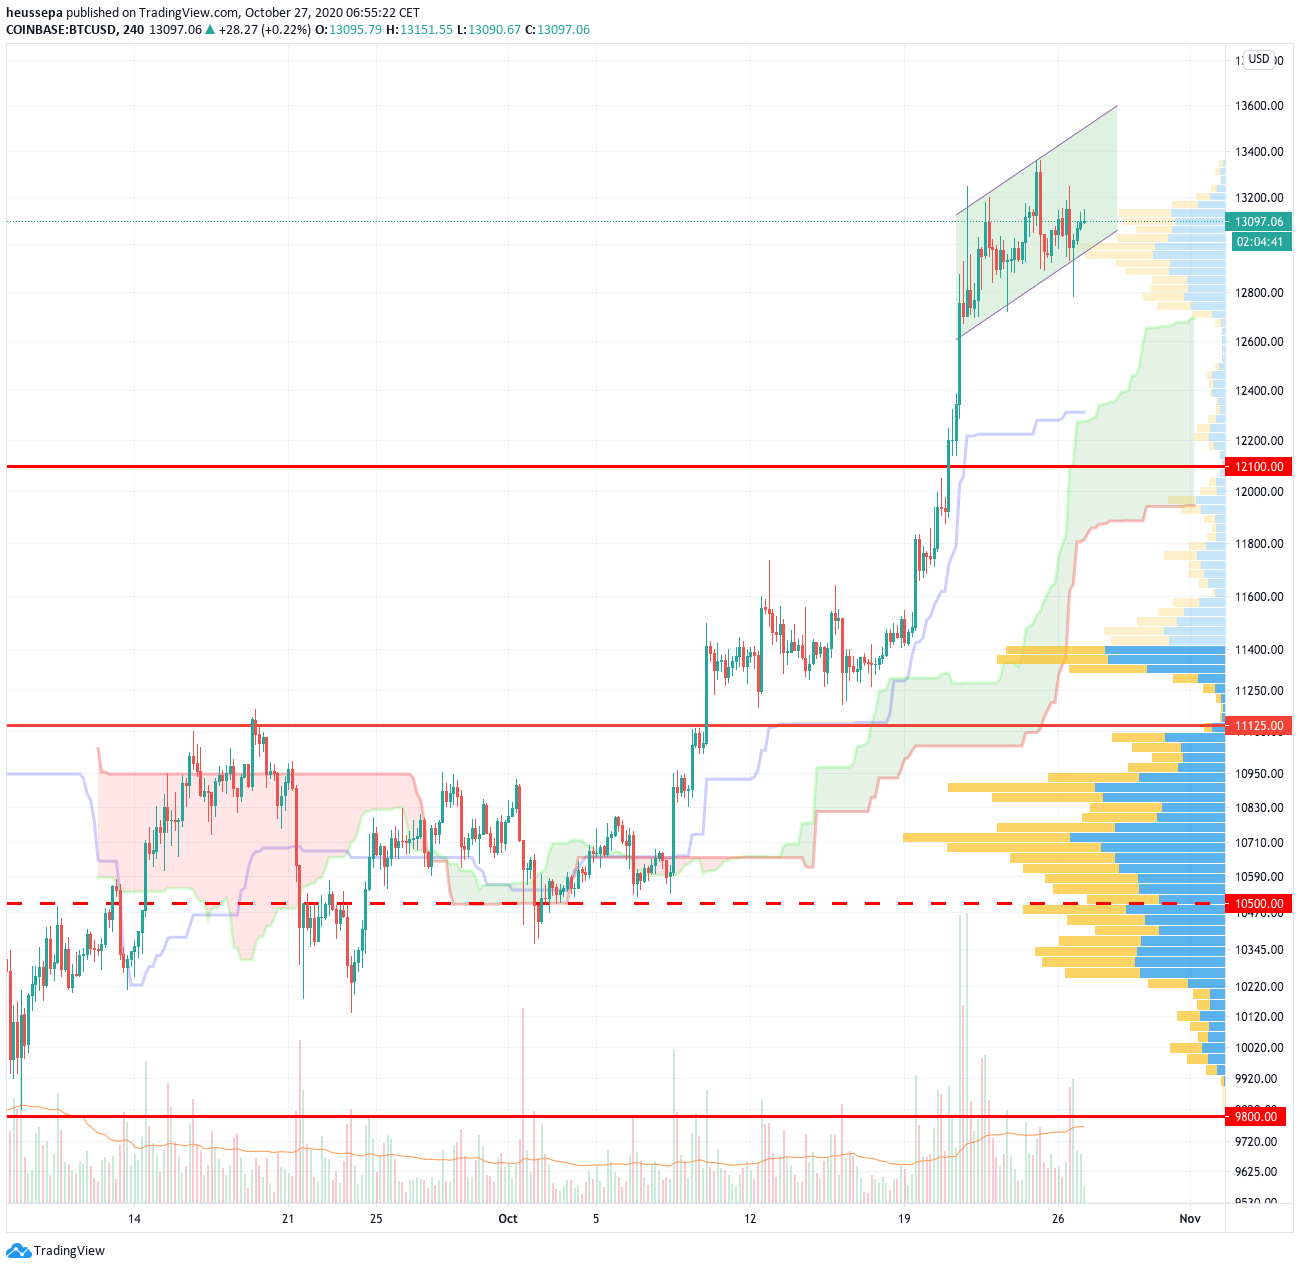
Bitcoin BTC$ (4h) - 12.7k is still relevant!
We nailed it last week. The move up to 12.5k came as predicted. Now, it is key not to give the gains away by trading during the consolidation phase.
So far, I believe this is a healthy consolidation. I cannot see any indication of a blow-off top or a round top. As I mentioned a few times on various channels: 12.7k is still relevant.
We have reduced a small portion of our longs. If we break 12.7k, we will take action and decrease our exposure further. The upside steps are really straightforward. It looks like for every $500, we have some supply coming in. The next resistance to take out is 13.5k.
This rather mechanical behaviour is probably driven by the very few trades that have taken place around the current price levels. Throughout bitcoin's trading lifespan, we have only been up here for a few weeks.
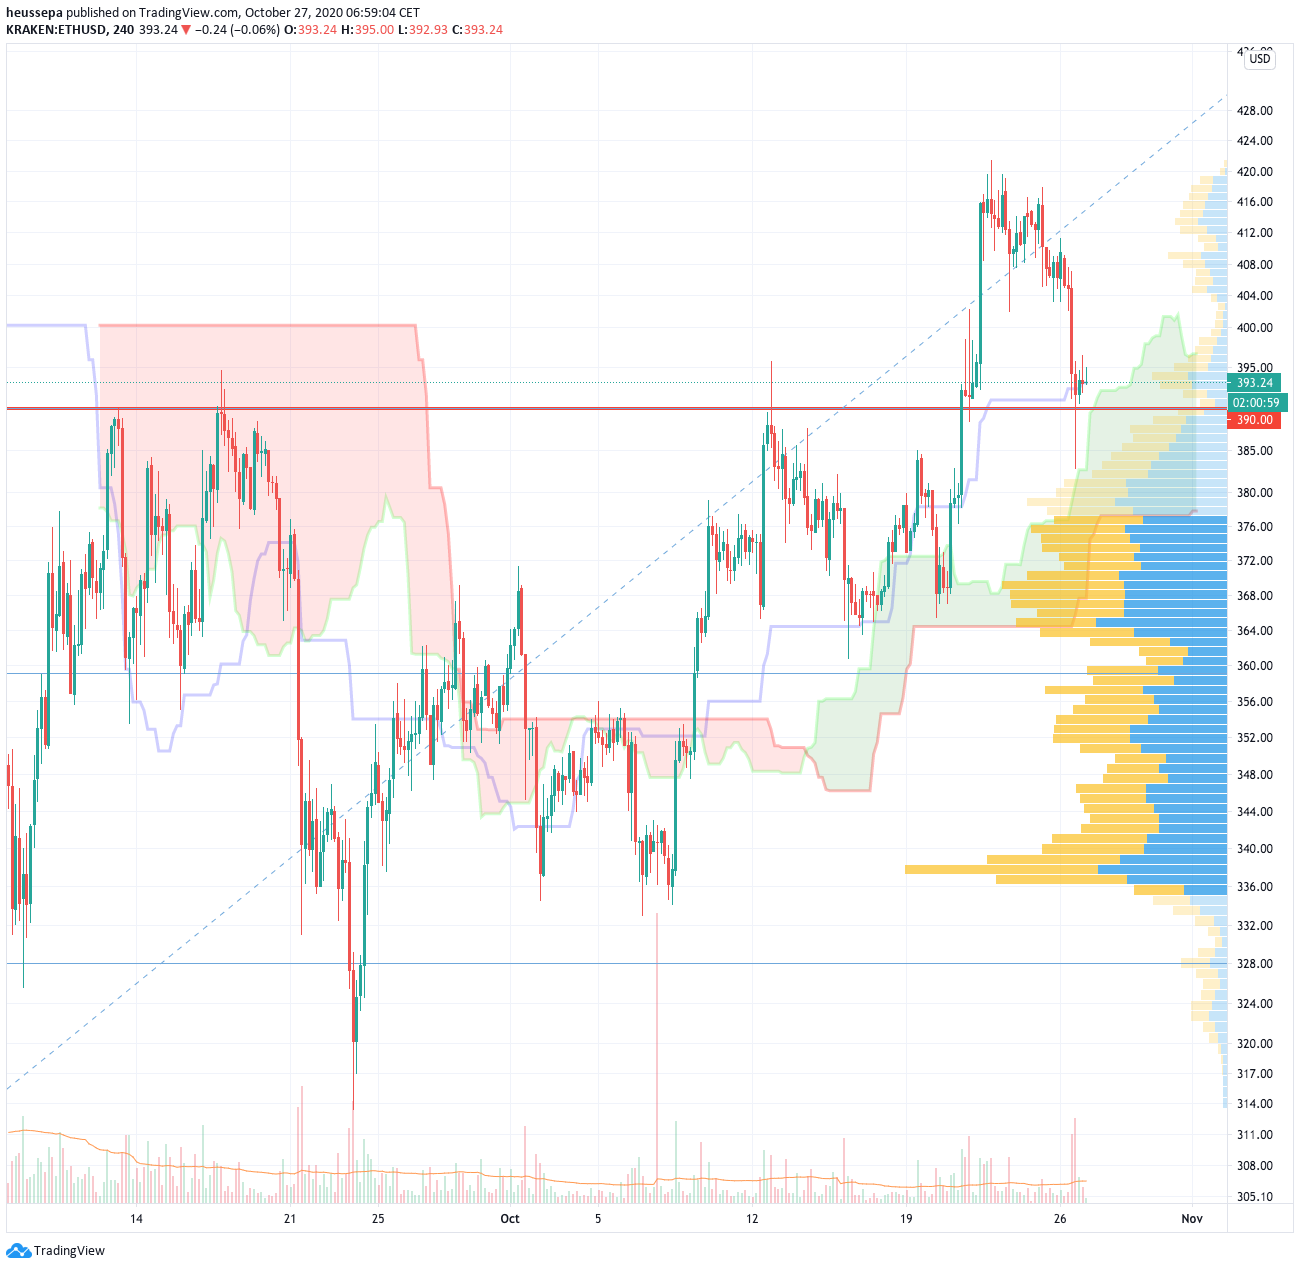
Ethereum ETH$ (4h)
We broke $390 and shot up to $420 within no time. But in the end, we were unable to hold on to the gains. Now, we are back down to $390 and have returned to the baseline (blue line).
I have no strong feelings about ETH$, and the chart does not give me a great deal of hints. All I know is that if we break $390 to the downside on a daily closing basis, things will get ugly.
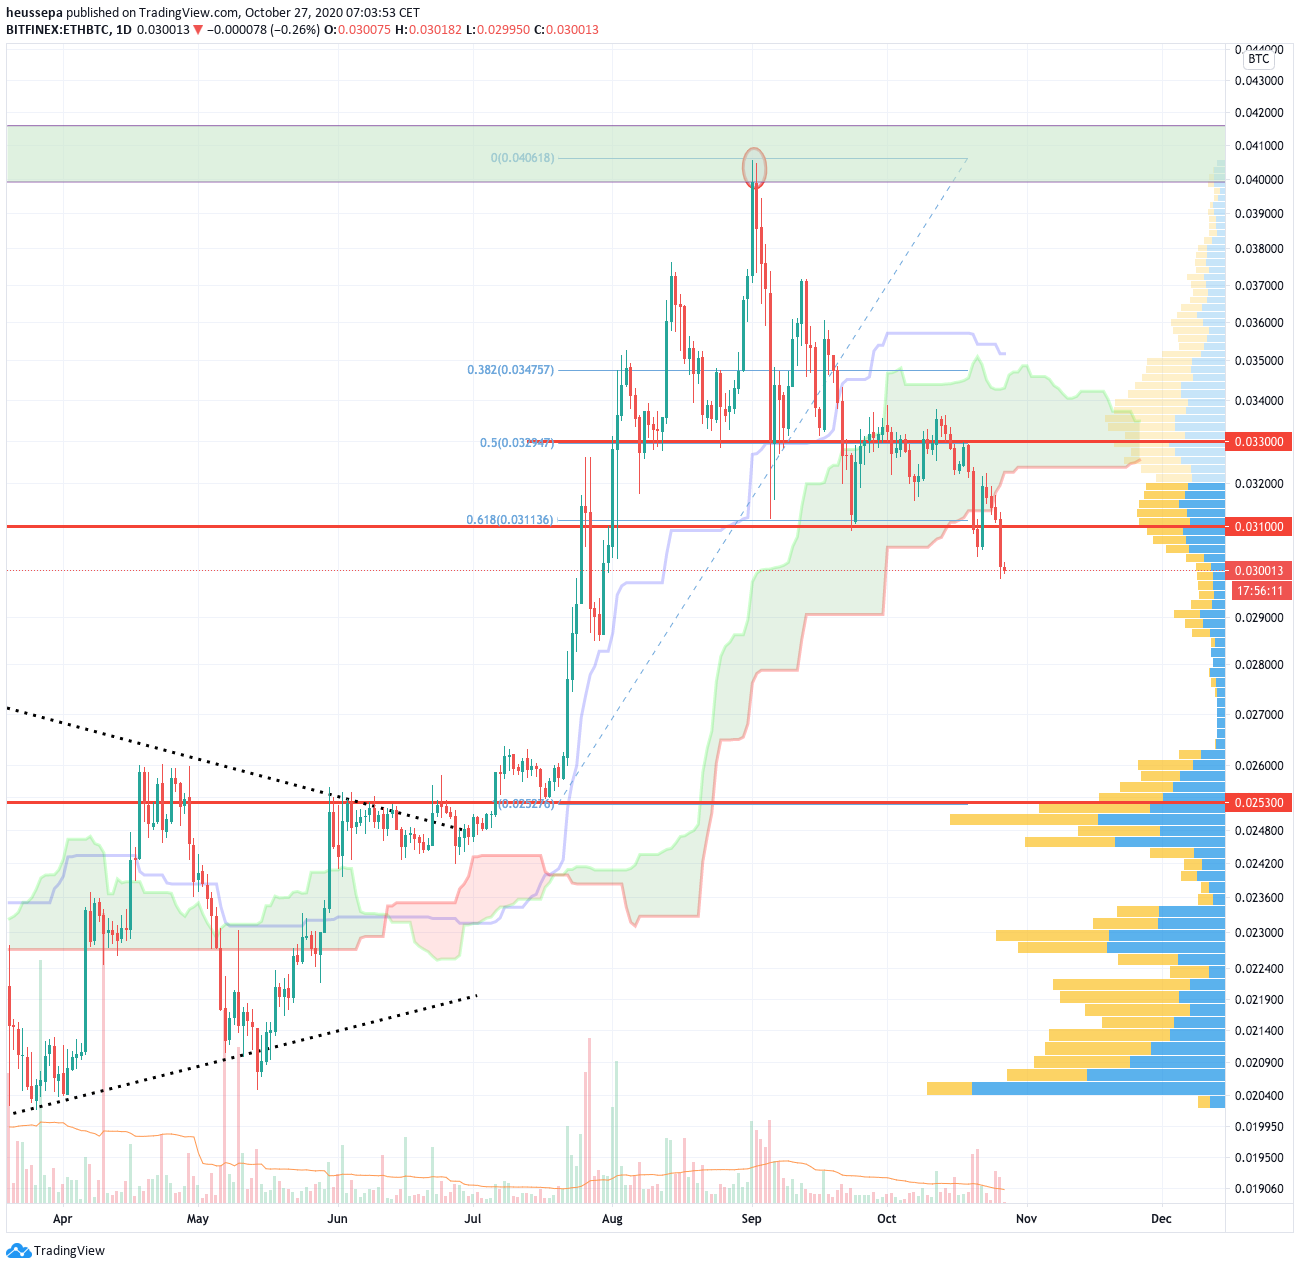
Ethereum/Bitcoin ETHBTC (daily)
I had to pan out to the daily timeframe. Things are not looking too good. The 0.033 level was an important level after all. I guess 0.031 is important as well.
The entire structure looks bearish to me. I have no position and will not enter into one until we are either trading above 0.033 or below 0.025.
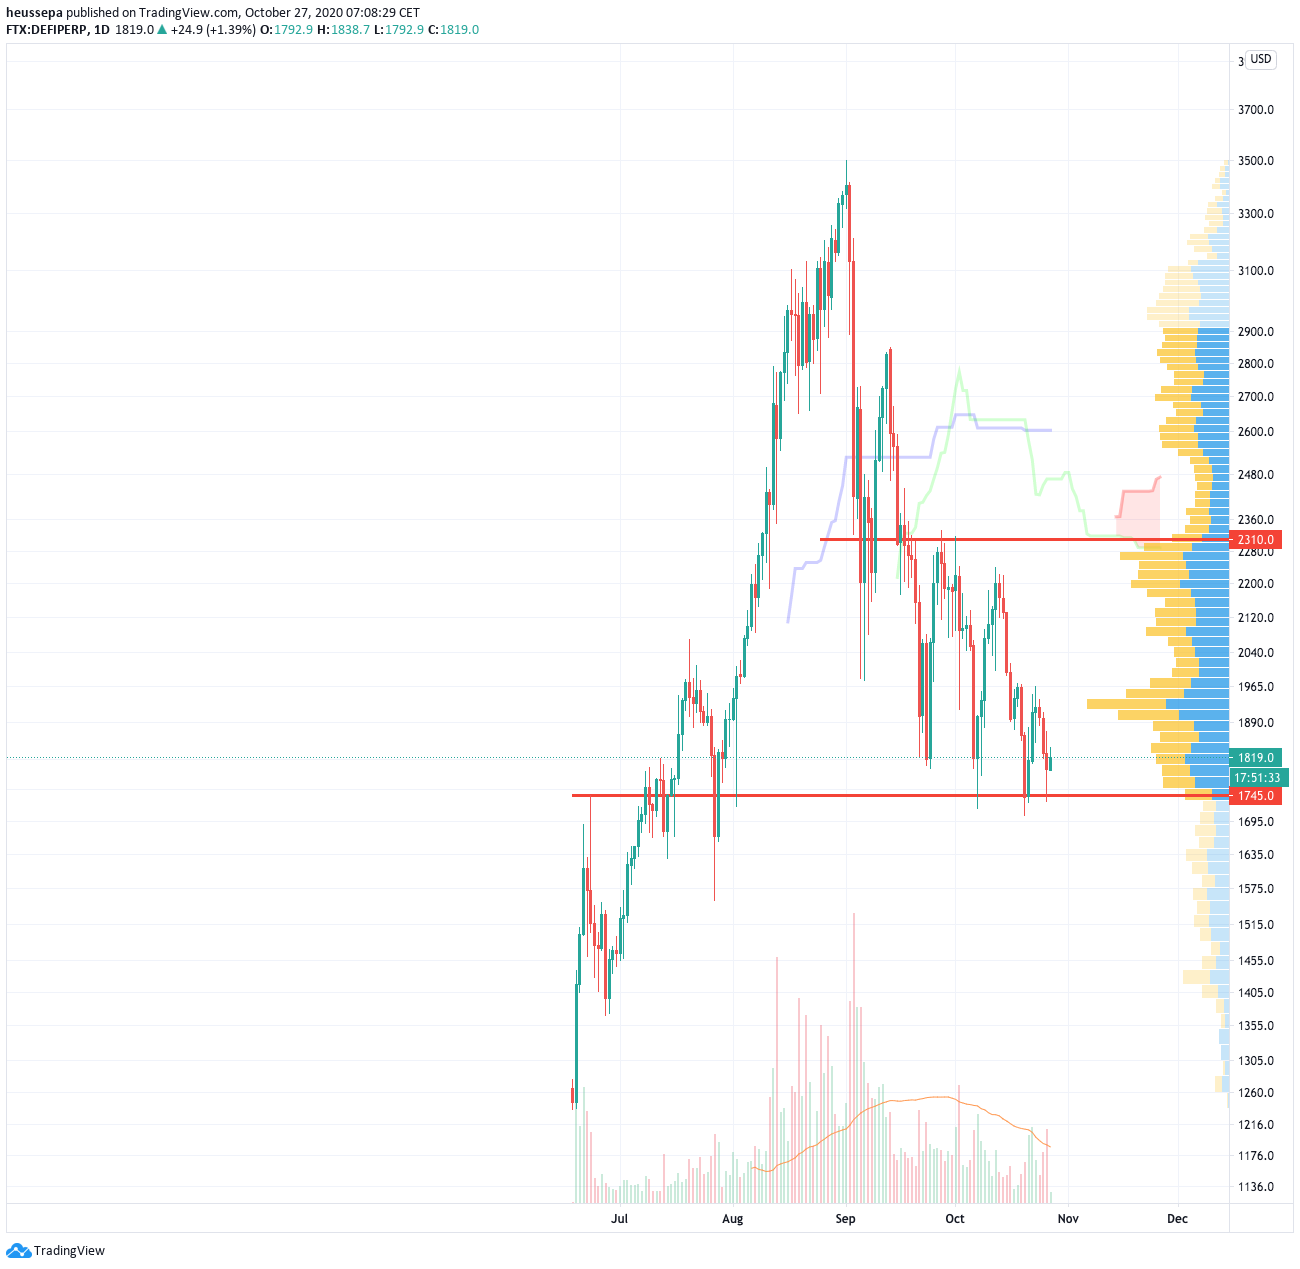
DEFI$ (daily)
I had to move the support line from 1,800 down to 1,745. My guess is that we should consider the 1,730-1810 range as the support zone.
The wave structure does not look bullish, but then again, we are not seeing the large volume driving the price down. This makes me mildly bullish. But only if we are able to hold 1,745 on a daily closing basis.
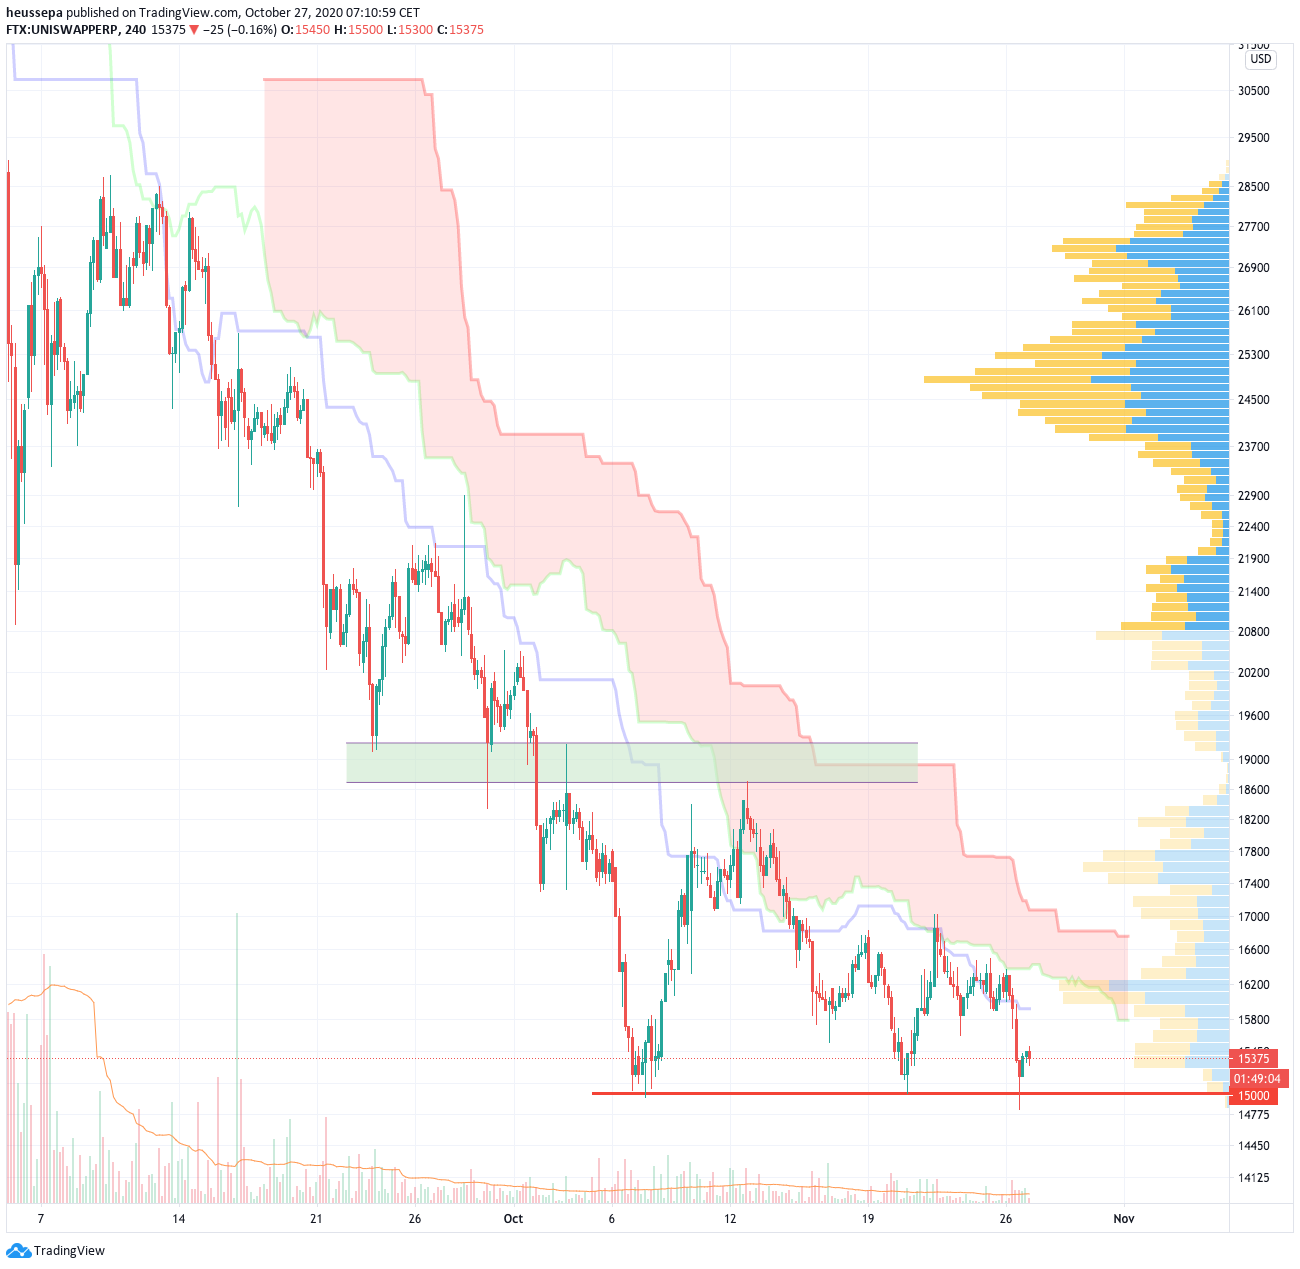
UNISWAP$ (4h)
We are just not getting any traction to the upside. But maybe there is a floor around 15,000. The first attack target to the upside is the baseline (blue line), which comes in at around 15,800, and after that, the lower band of the Ichimoku cloud (just shy above 16,200). Let's wait and see...
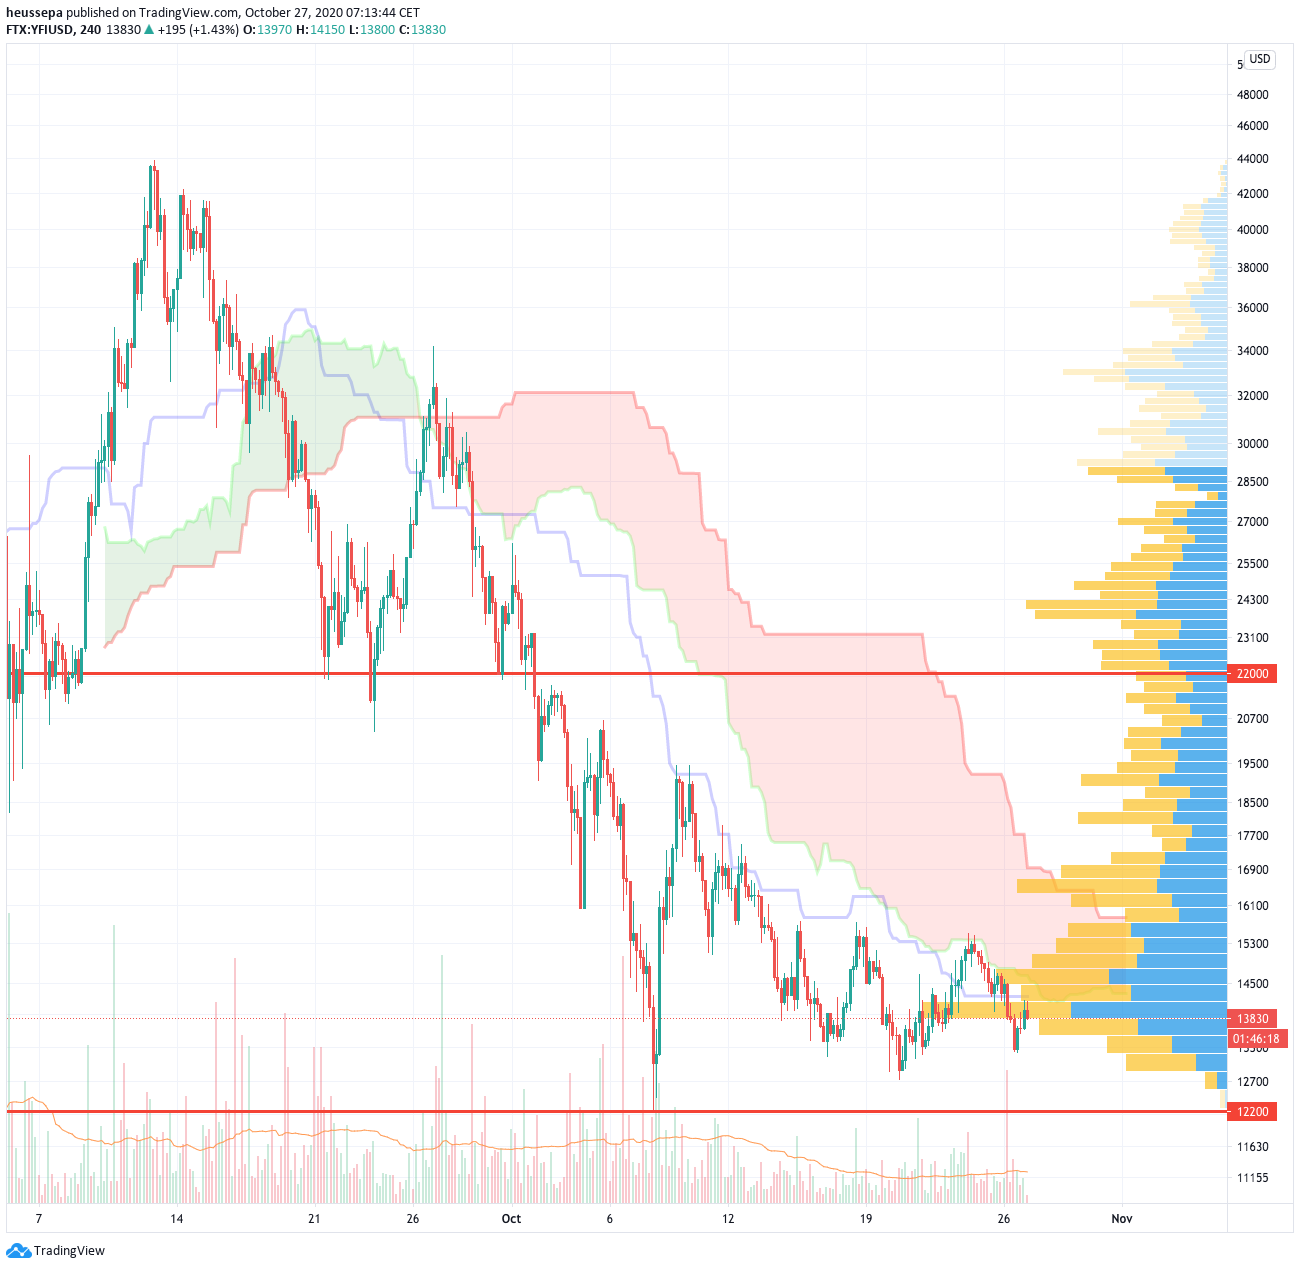
YFI$ (4h)
UNISWAP and YFI are almost look-alikes. As we mentioned before, this is because YFI is such a large contributor to the UNISWAP index.
12.2k needs to hold... Otherwise, it looks dire for this sector.
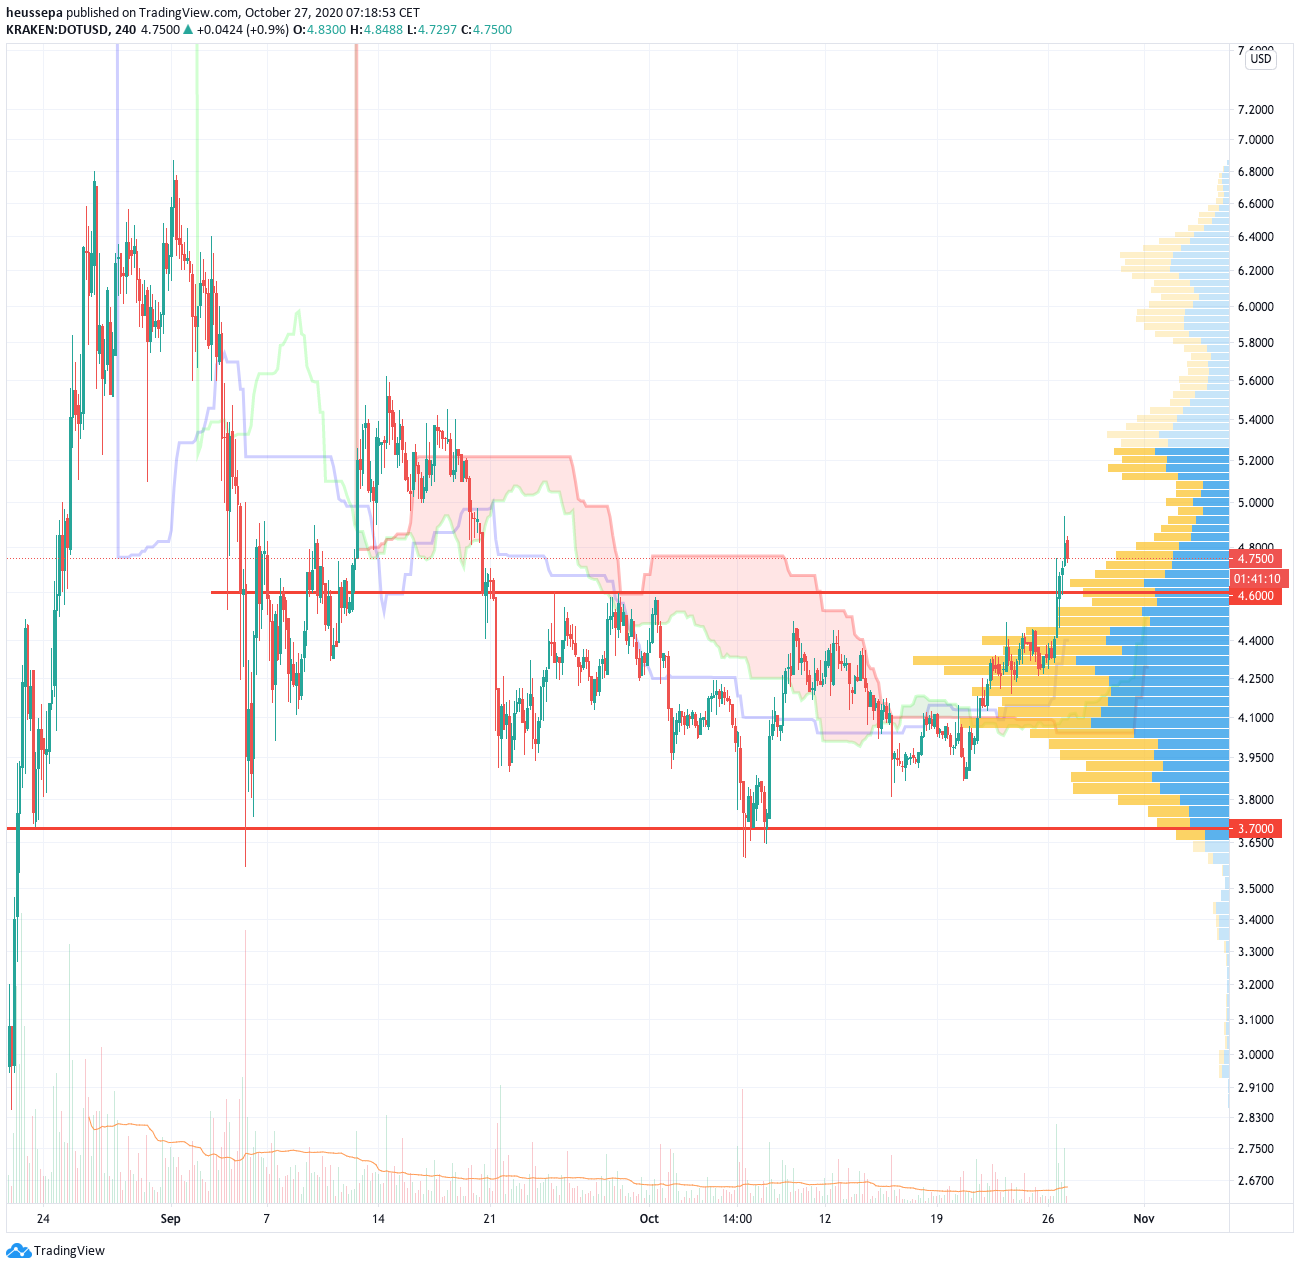
DOT$ (4h)
Finally, a coin in the DeFi sector that is showing some signs of life. It was a nice break out of the old $3.70-4.60 range with good volume. It's worth looking at getting into a long position during this consolidation phase.
However, the issue with entering into a long is knowing where to take the stop. I think you need to give it a bit of room: maybe down to $4.40.
It is one of these setups where you cannot enter into a meaningful sized position due to the support/resistance lines not being very clean.
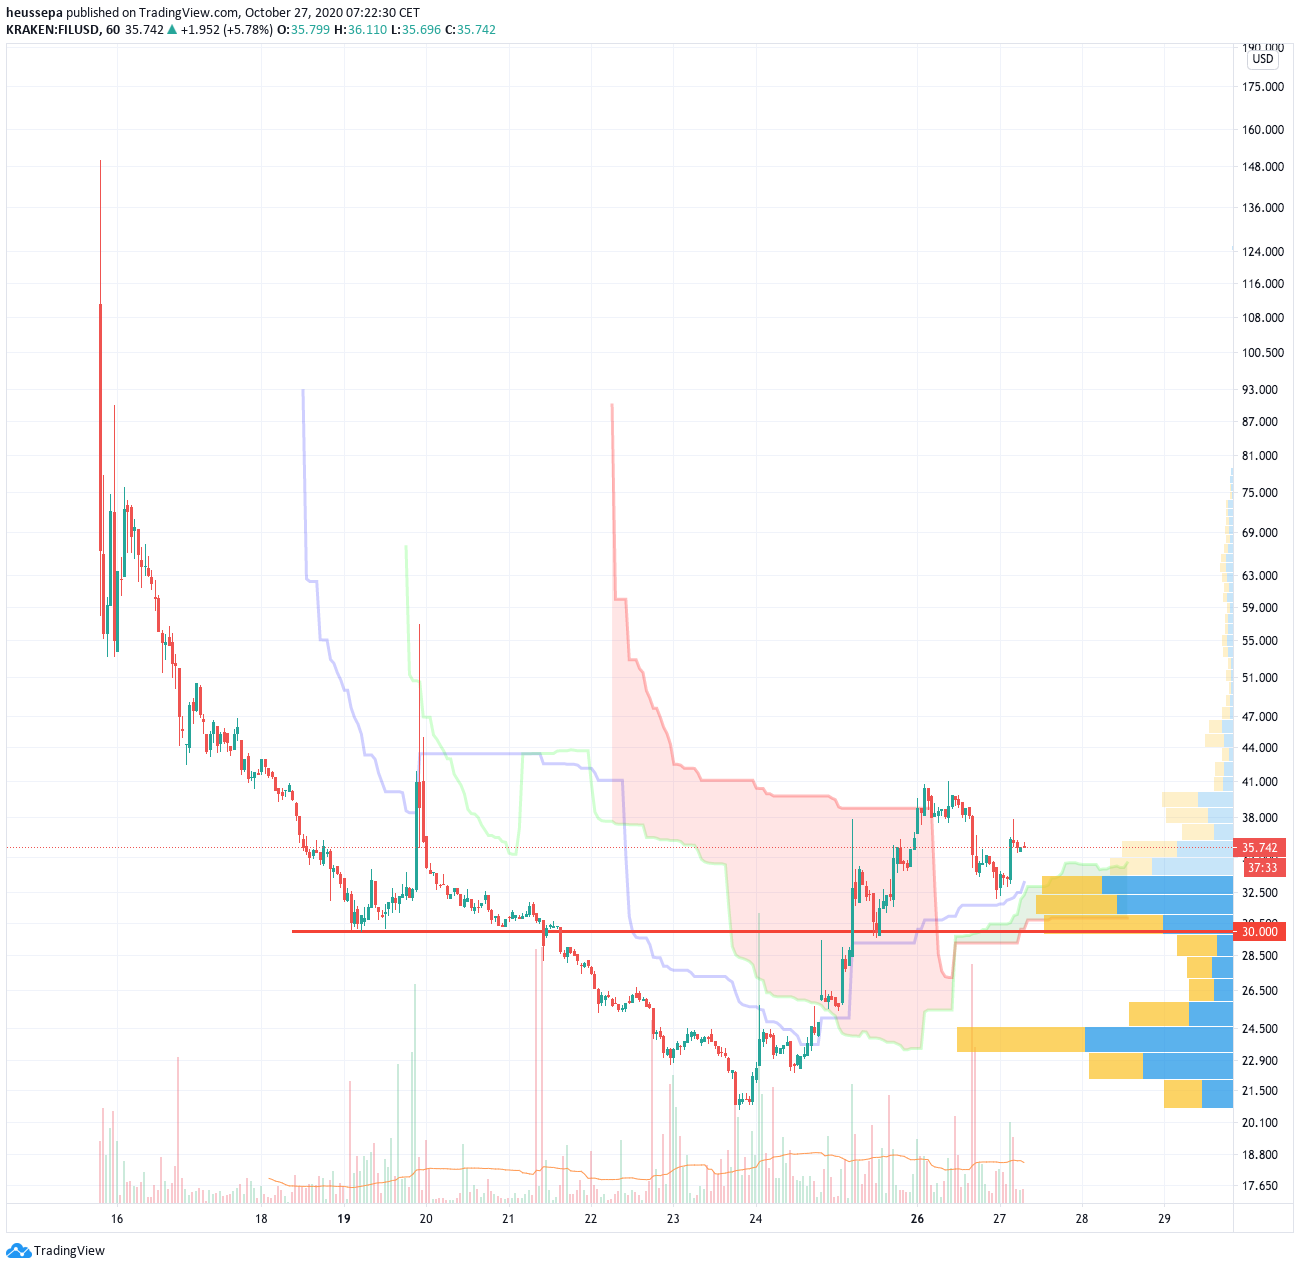
FIL$ (1h)
Since I have mentioned Filecoin a few times now, I thought it would be good to include it in our TA-Report.
Filecoin does not have many data points, but from what I can tell $30 is a nice support/resistance flip line. It also shows a good volume cluster (volume bars on the right-hand side). Plus, the Ichimoku cloud turned bullish when the price went above all the indicator lines.