
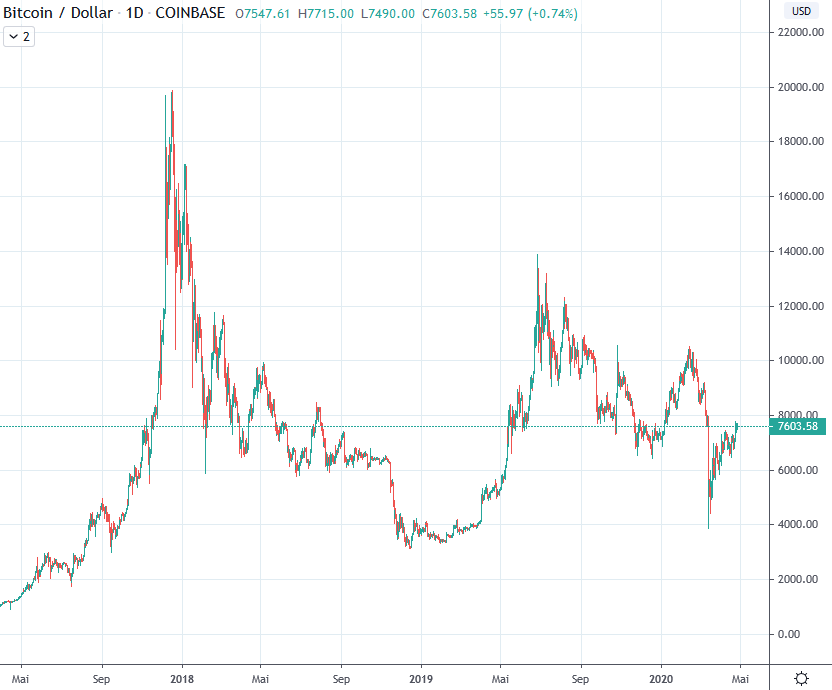
Bitcoin/USD daily basis
 Source: Tradingview.com
Bitcoin USD - New highs since March crash
At the beginning of the reporting week, the Bitcoin price was still testing the newly created support zones around USD 6,800. From the middle of the week onward, it climbed again and closed above the USD 7,000 mark. Already on Thursday, an advance into higher regions was seen, which came to a temporary halt at USD 7,800. The following days were characterized by a slightly higher trend in the share price. Consistently slightly higher daily lows in the last three trading days of the week, with narrow daily bandwidths, brought the price back to the provisional high marked on Wednesday.
Advancing to the upper-end of the resistance zone in the microtrend
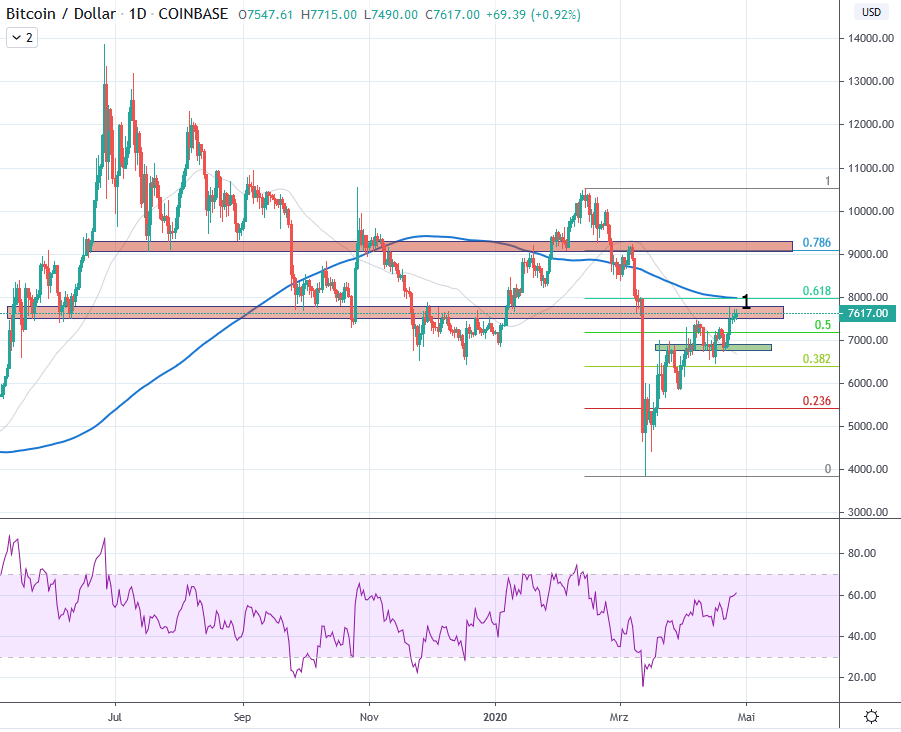
Bitcoin is forming a pattern of higher lows in the micro-trend after its price fall in mid-March. This countermovement failed for the time being due to the resistance zone formed by the bottom formation between November and January 2019, as well as earlier supports (red). From a Fibonacci perspective, we are just above the 0.5 point of the correction since the high in February.
With the USD 7,600 mark, the highs of the last two weeks were breached. The foundation in the micro-trend can now be strengthened if the 7'500 - 7'700 zone can be broken sustainably. A possible setback should not go below the support at USD 6,800 (green) in order not to breach the trend of higher lows. If these components are present, there is no reason not to extend the most recent micro-trend. A testing of the 8'000 USD mark should follow for the time being. Above USD 8,000, there is almost no resistance to historical price movements. Only on the indicators side, the 0.618 Fibonacci point and the 200-day average at around 8,000 USD (1)remain to be observed.
In order not to weaken the new positive structure, the newly created supports at 6,700 and around 6,300 USD should be respected. A drift below USD 5'900 would have to be seen as a capitulation of the young upward trend and increases the probability of a renewed visit to the 5200 - 5'000 USD zone. Consequently, a renewed testing of the USD 3,000 - 4,000 spheres would have to be attributed an increased probability.
Macro: Chronology of lower highs since the end of 2017
Bitcoin has so far failed to set a higher high in the weekly interval, which would have broken the prevailing bearish trend since December 2017. In its last attempt since the beginning of the year, the upward trend in the relevant zone at around USD 10,500 failed to establish itself. The sharp price correction in mid-March is further confirmation of the prevailing downtrend.
Bitcoin is now clearly below the 21-week average (1), which in the past often decided about bull markets or bear markets. The 200-week average(2), which has never been broken since its inception, and the trend line (3)of the lower bandwidth of the uptrend since March 2017 are also being tested. They will serve as further indications of how distressed Bitcoin is at present.
The macro picture remains dominated by lower highs since December 2017 in the downtrend. Bitcoin must create a new basis for itself. If the USD 5,000 mark does not hold, between USD 3,000 and USD 3,500 support is expected from the bottoming out of early 2018.
The negative macro picture can only be broken in the medium term if the trend of lower highs since 2017 is sustainably overcome.
Disclaimer
All information in this publication is for general information purposes only. The information provided in this publication does not constitute investment advice and is not intended as such. This publication does not constitute an offer, recommendation or solicitation for an investment in any financial instrument including crypto currencies and the like and is not intended as an offer, recommendation or solicitation. The contents contained in the publication represent the personal opinion of the respective authors and are not suitable or intended as a basis for a decision.
Notice of risk
Investments and investments, especially in crypto-currencies, are generally associated with risk. The total loss of the invested capital cannot be excluded. Crypto-currencies are very volatile and can therefore be subject to extreme exchange rate fluctuations within a short period of time.


