Good Morning!
And welcome the return of 10k BTC$!
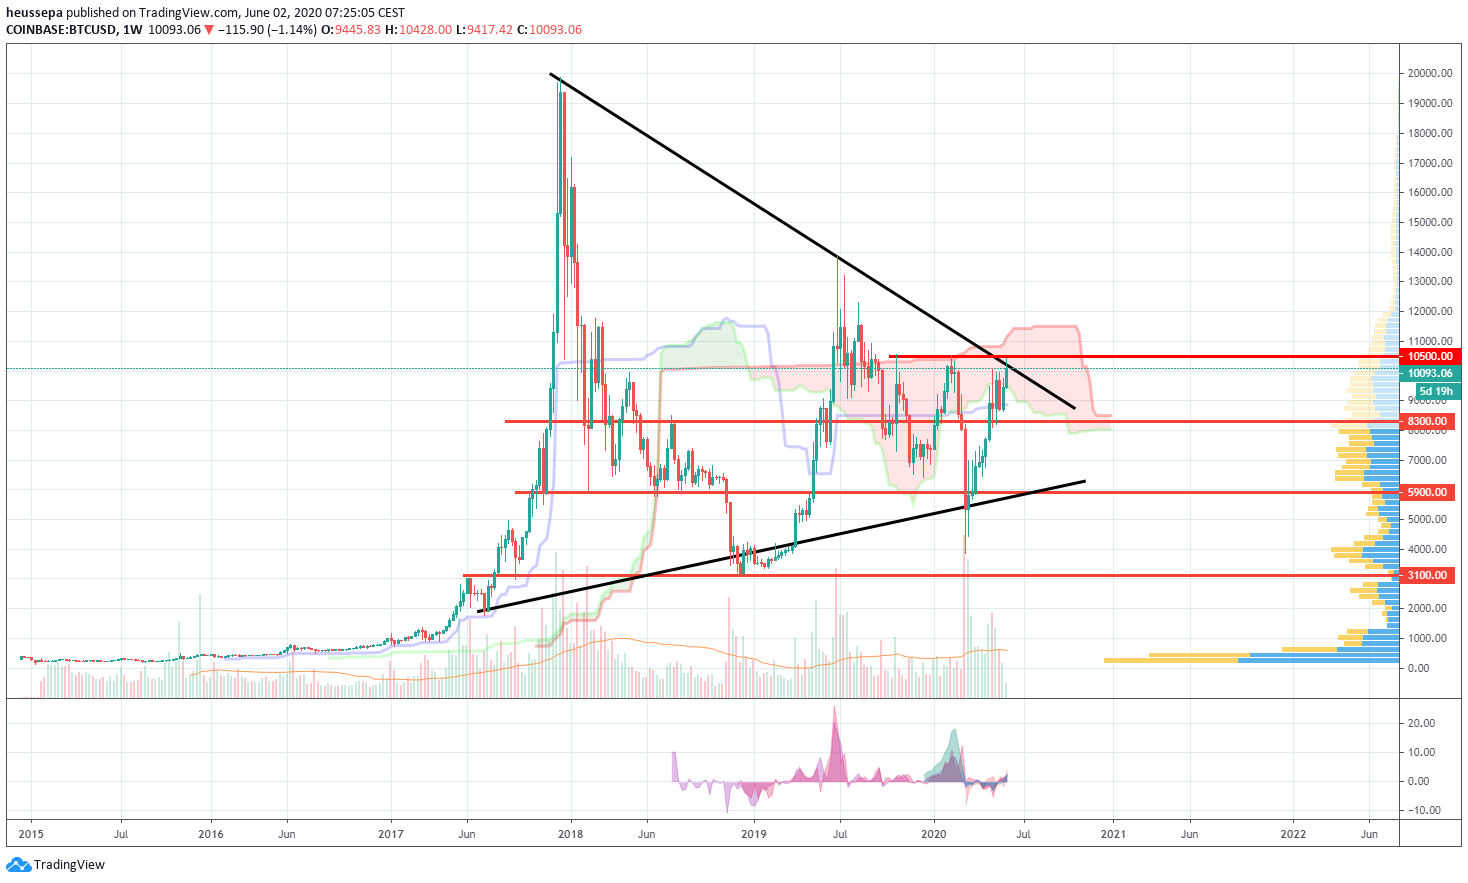
BTC$ (weekly)
Log or non-log scale: the market looks strong. But I believe in the symmetrical triangle regardless of if 10.5k is key or not.
Non-log
log

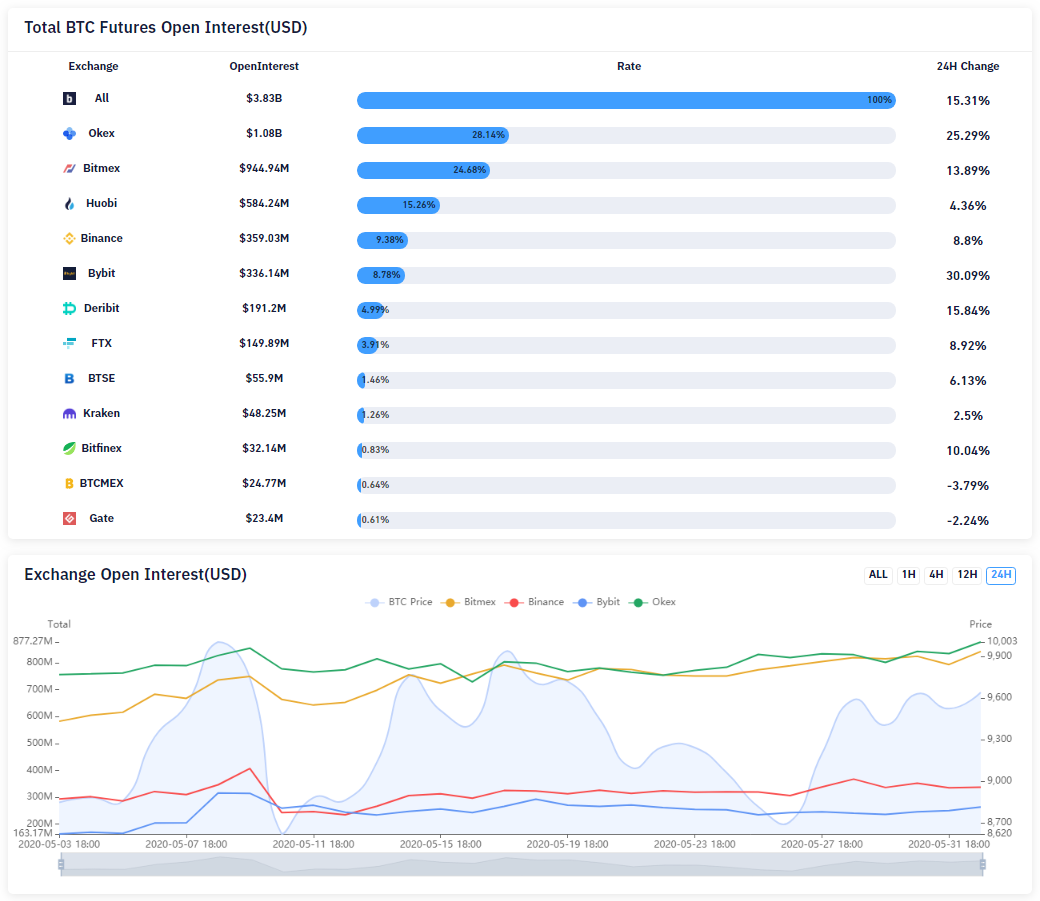
This is a proper v-shaped recovery, driven from both sides: spot and derivatives. Over the last few days, the push was mainly driven by derivatives. Especially ETH had a massive increase in trading volume and OI on various exchanges.
During the last overnight push, we saw some insanely high funding levels on the perpetual swaps. This is not sustainable over time. Either we will see some physical spot buying closing the gap, or some of the derivative longs will feel the funding pain and throw in the towel.
BTC$ (daily)
The 10.5k level looks quite important on the daily chart. A clean break with physical spot buying would be the preferred way of clearing the resistance. But with the stretched derivatives market structure, it would be healthier to retrace back down and attack again with more gun powder. The Ichimoku cloud looks very wide, which is a sign of a stretched market structure situation.
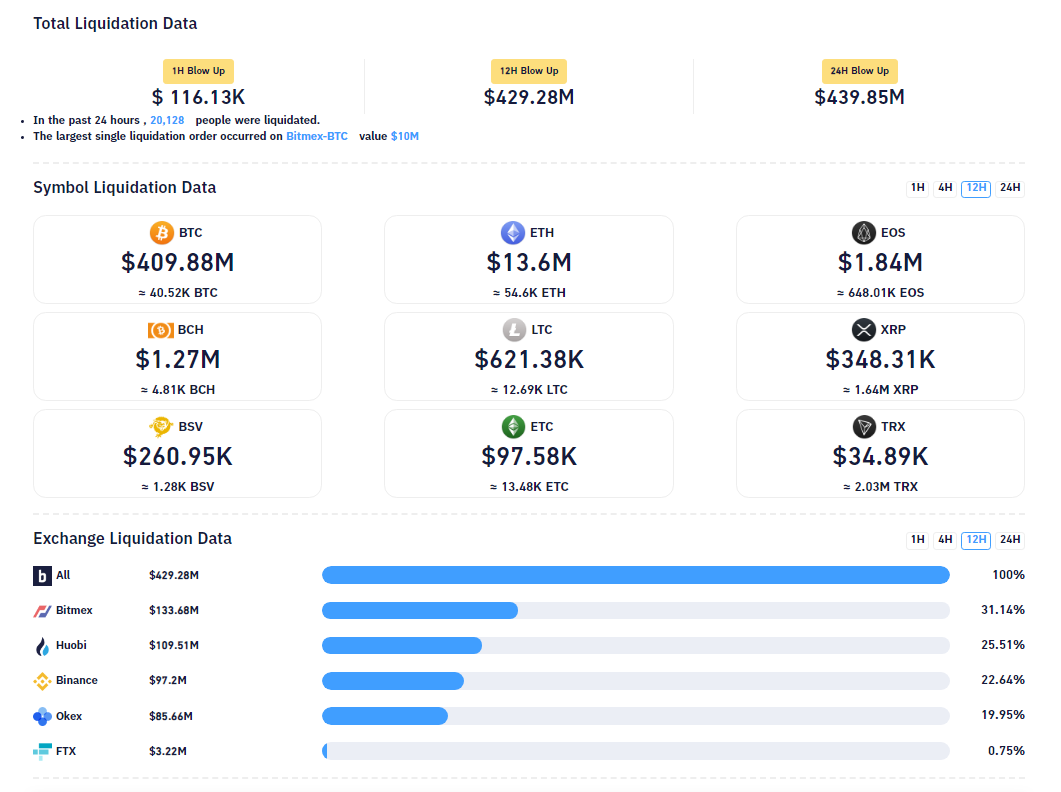
In terms of liquidations, we have already consumed a great deal of the gun powder (see picture liquidation_data).
An interesting fact worth mentioning is that OI did not collapse. In fact, it went higher. In combination with the very high funding, I assume that many leveraged longs opened up right around the 10-10.4k level (see data from skew and bybt below).

BTC$ (4h)
To me this chart looks the least bullish. Yes, agreed, we are pleasantly above the Ichimoku cloud, and we just took out the most recent high (at around $10,050). But with the tough resistance at 10.5k, and all the abovementioned high funding indicators, OI, and liquidations, I am staying flat or short rather than long.

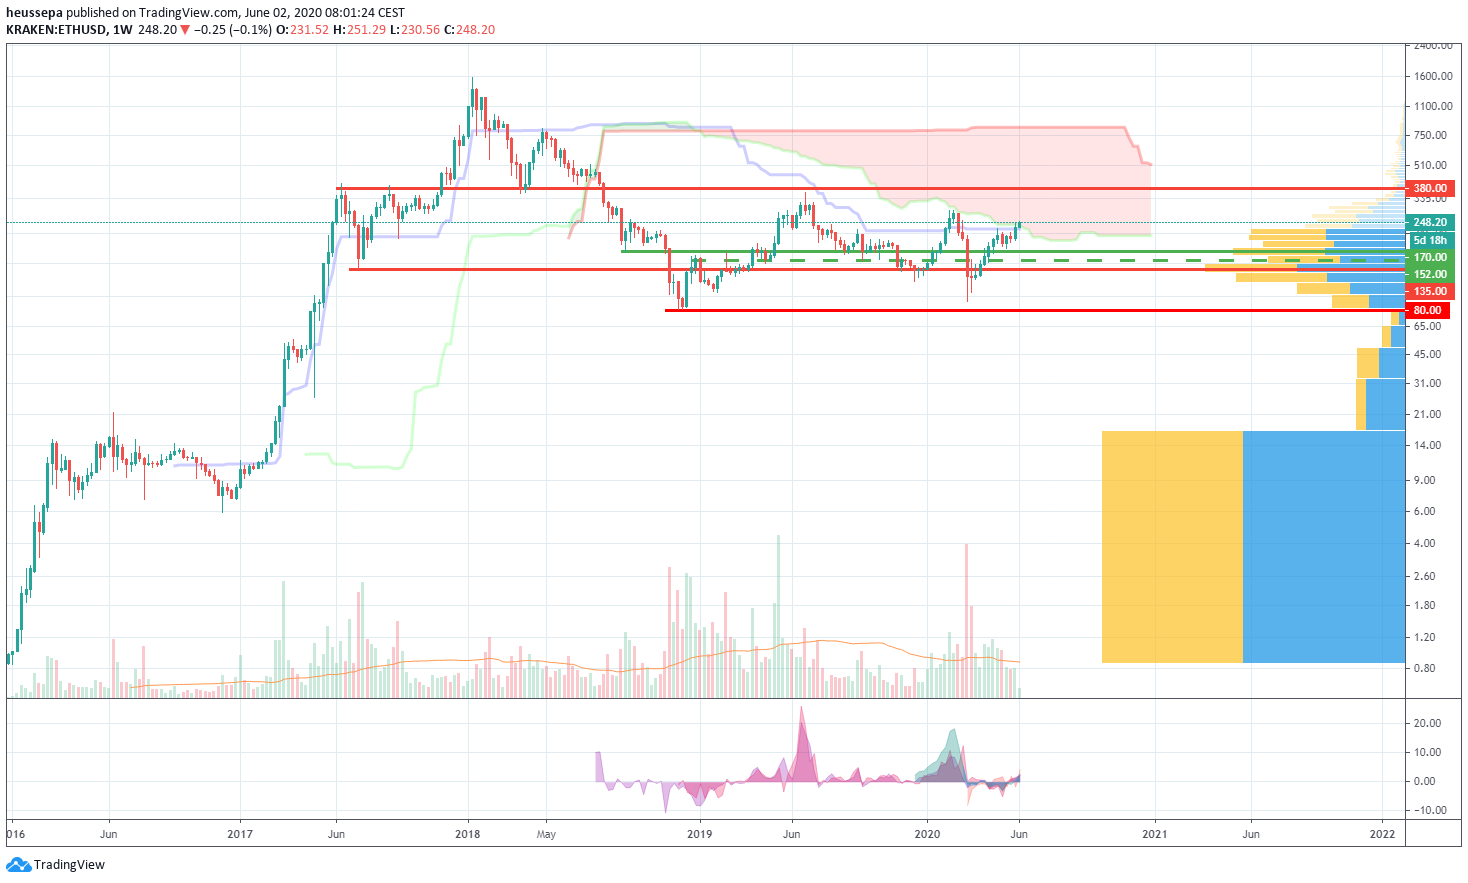
ETH$ (weekly)
It took us nearly two years to push back into the Ichimoku cloud. This is the second time now that we have pushed through the baseline (blue line).
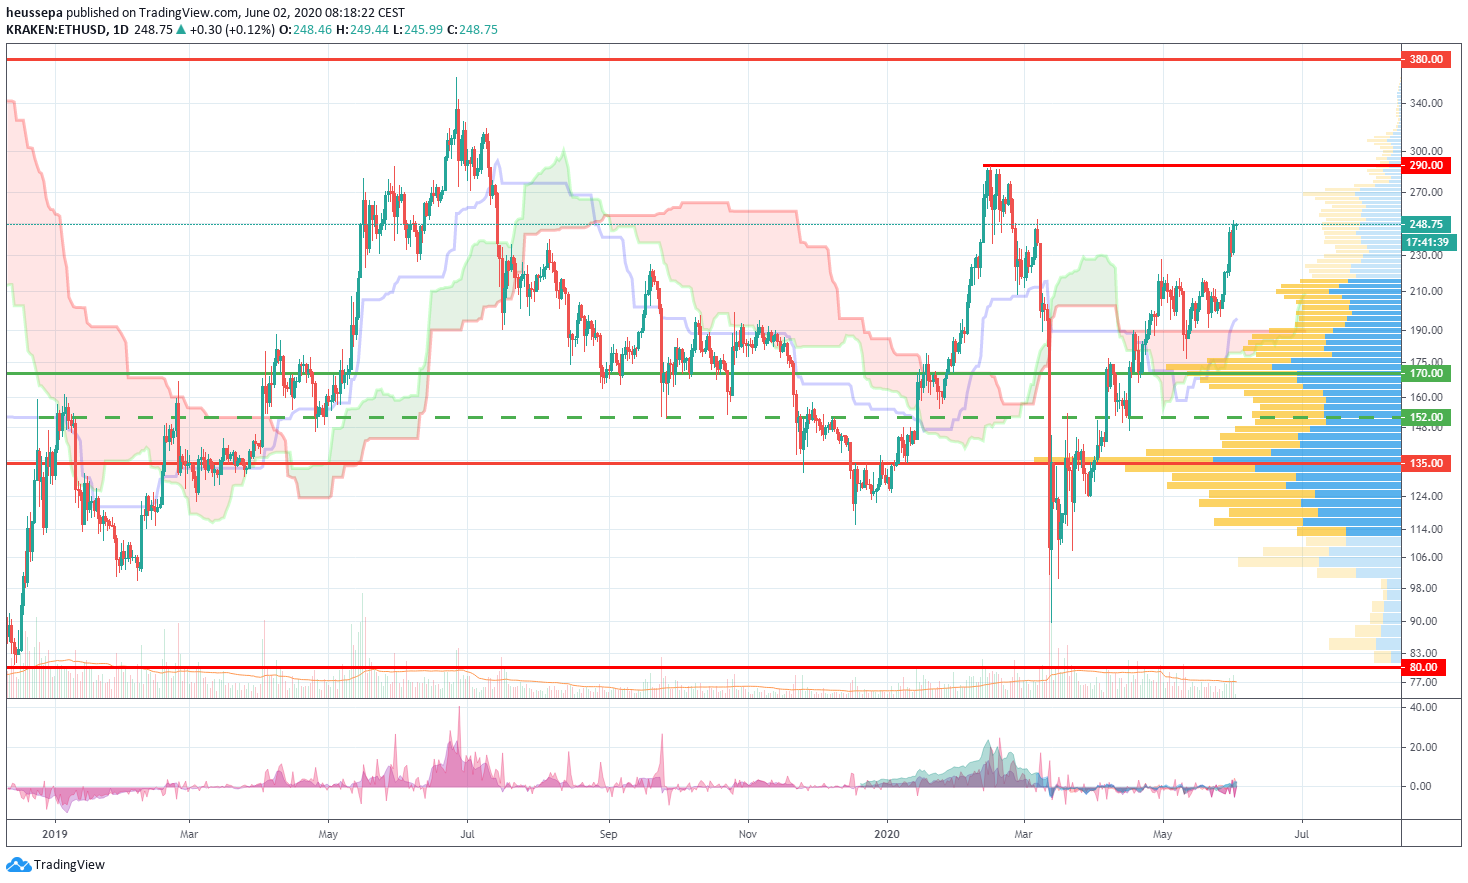
ETH$ (daily)
The price is currently dancing around the Ichimoku cloud in a massively wide zigzag. What is interesting to note is the difference in funding levels between the two bullish phases. Between December 2019 and February 2020, the funding was a great deal higher (especially on Deribit) compared to the rally from April 2020 until today.
My take is that there has been a lot more physical spot buying, especially at the beginning of the second rally (with the exception of yesterday's move).
In last week's Market Commentary, we mentioned that the overall trend is still bearish if you look at the highs and lows (lower highs and lower lows). The last relevant high is $290. If we take it out, the bearish structure will be broken.
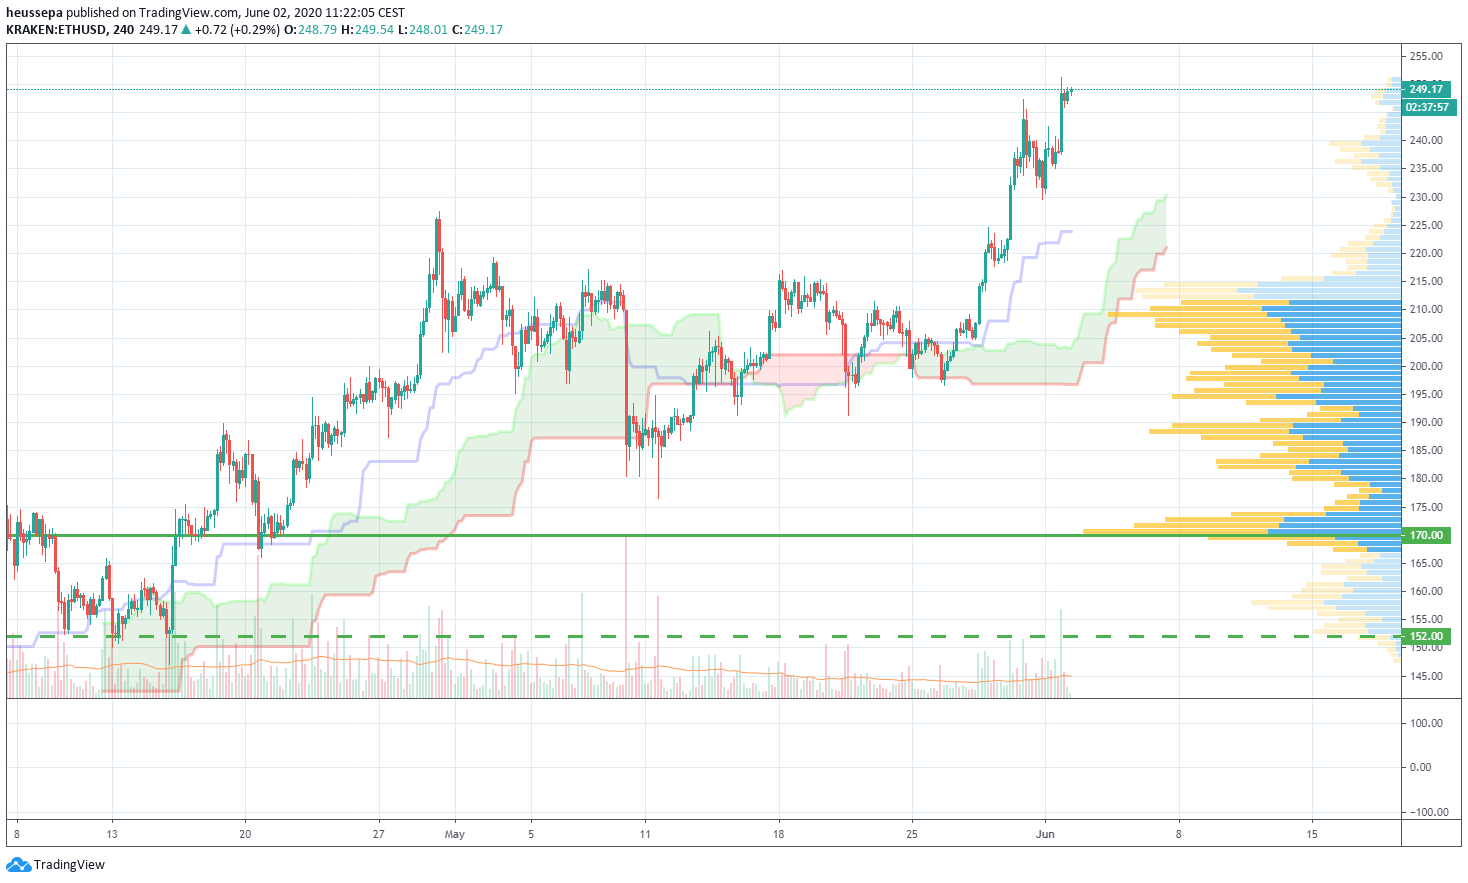
ETH$ (4h)
There isn't much to say. The picture speaks for itself. The trend is up and looks healthy. A correction down to $210-220 would still be considered healthy. The upside level to watch is $290.
ETHBTC (weekly)
It is make-or-break time. We just hit the upper leg of the triangle, the lower band of the Ichimoku cloud, the baseline (blue line), and the resistance level of 0.02530.
This will be a tough cookie to break!

ETHBTC (daily)
Things do not look very bullish. The Ichimoku cloud is bearish, and we stopped at the abovementioned resistance of 0.02530.

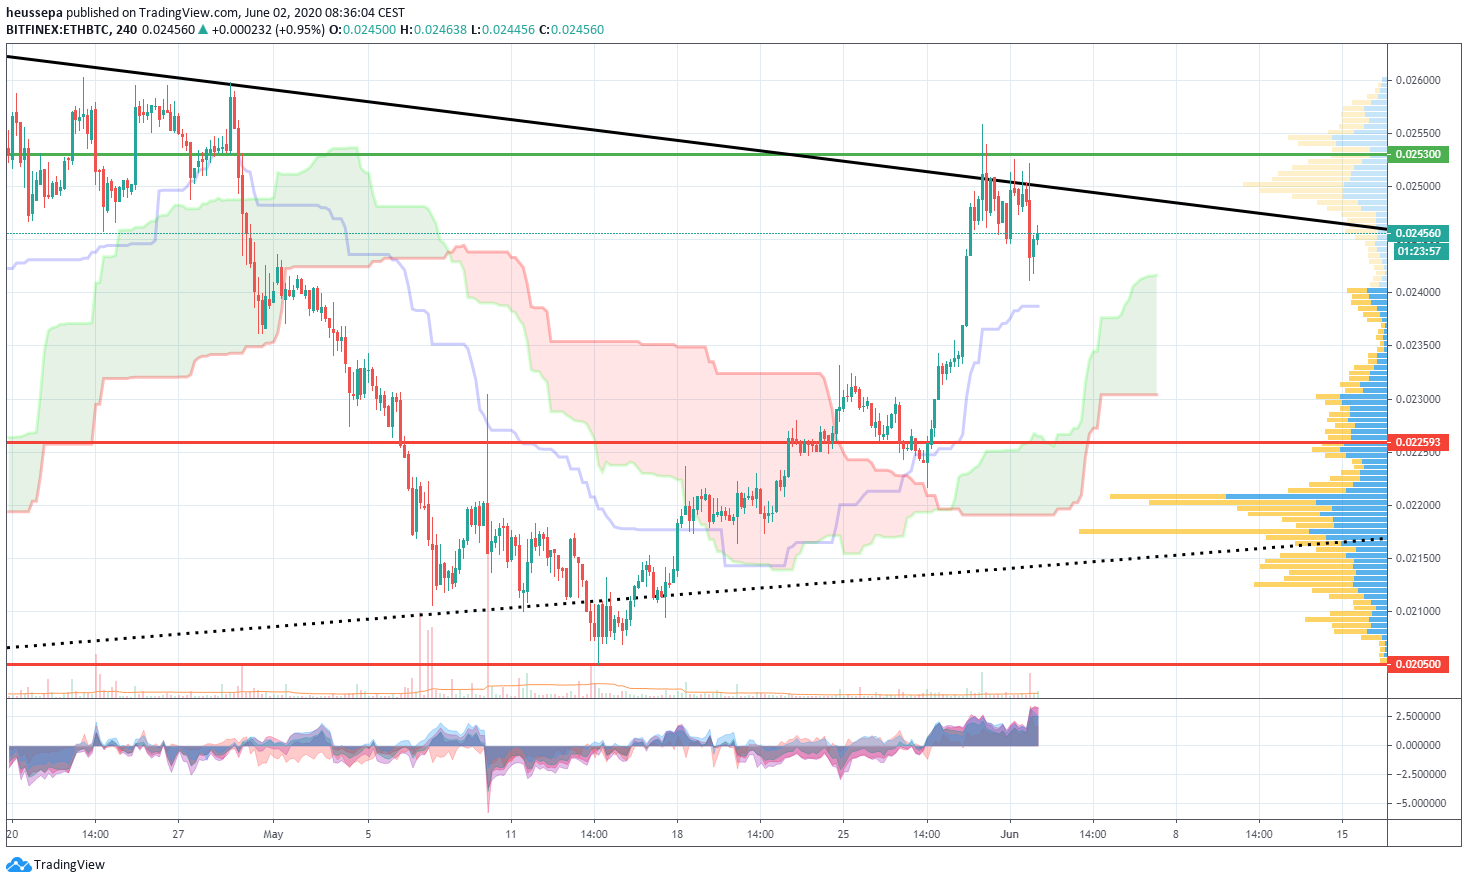
ETHBTC (4h)
This is the least conclusive chart. Keep your eye on the 0.02530 resistance level.
How have the altcoins been doing over the past few days? Looking at the FTX indices will give you the best overview on how the top 100 coins have fared.
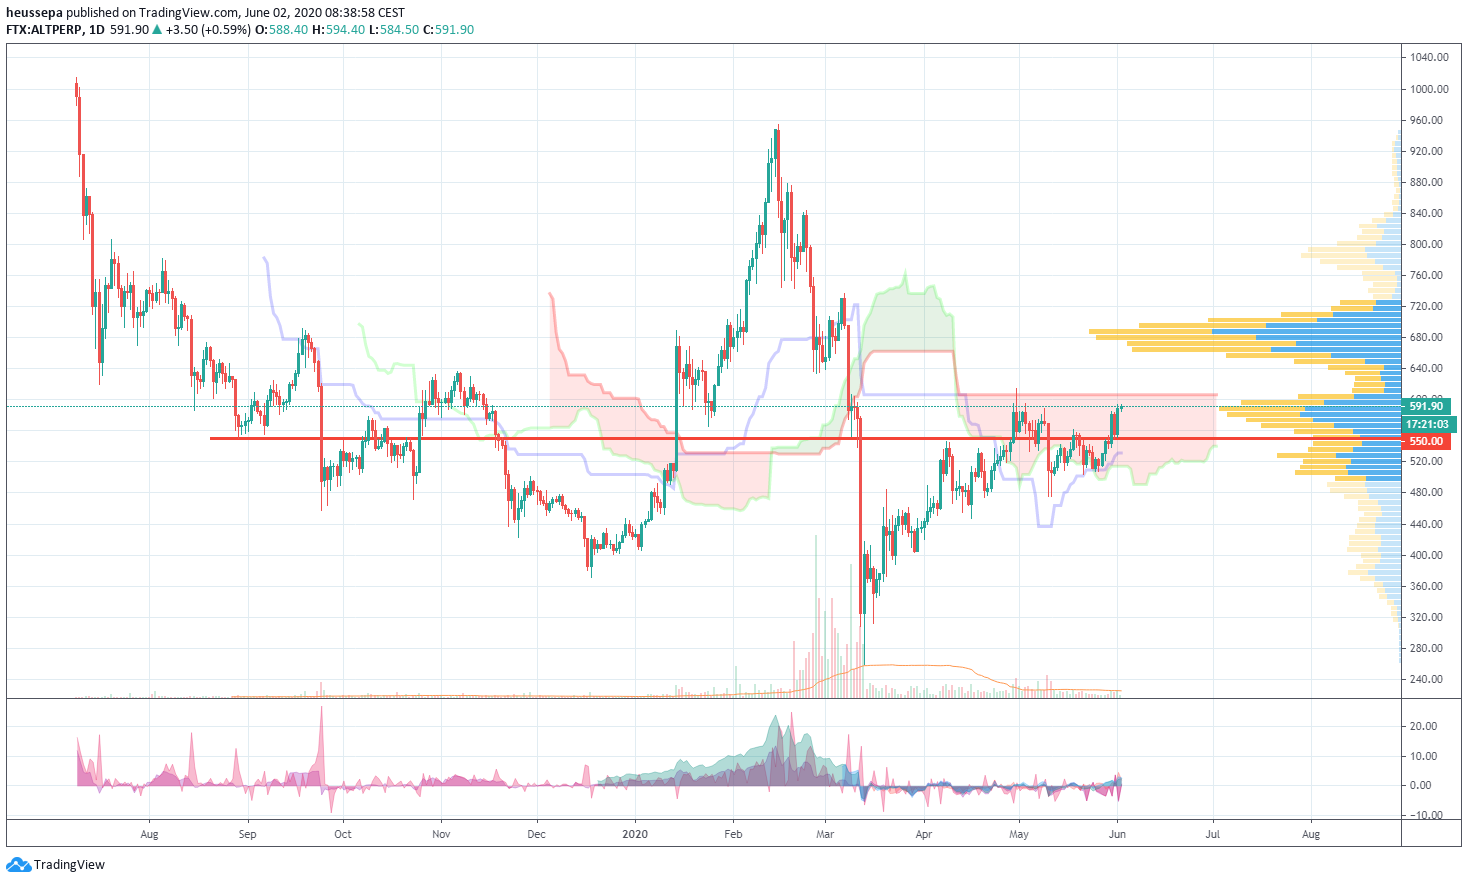
ALT$ (daily)
The recovery was not as strong as we saw for BTC$. We seem to be having a tough time getting through the 600 level. It has formed a nice resistance in combination with the upper band of the Ichimoku cloud.
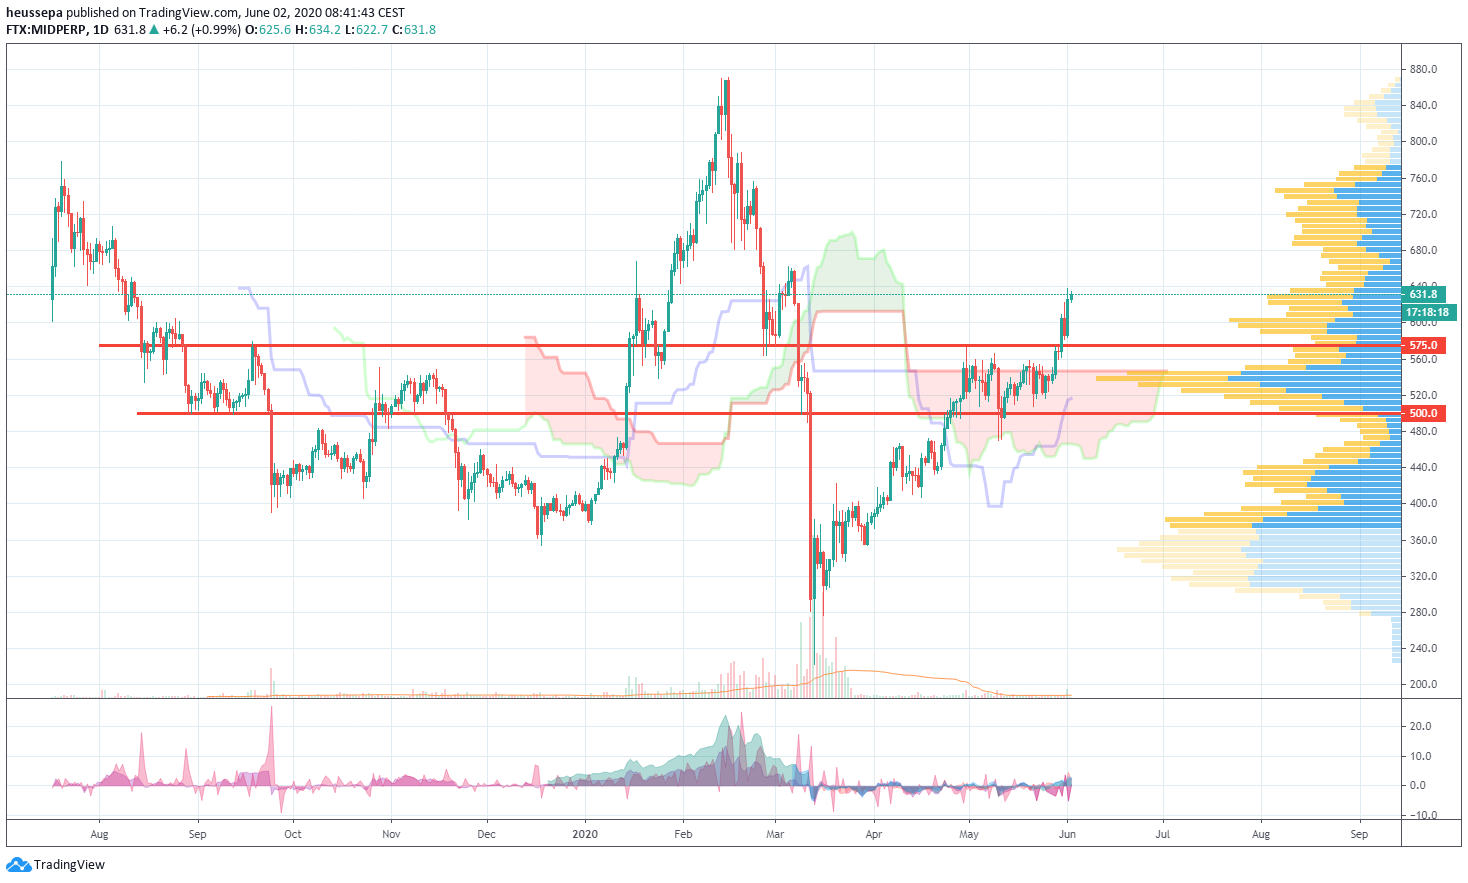
MID$ (daily)
Things are looking better already. The price pushed through the bearish Ichimoku cloud and we have almost made the flip from bearish to bullish.
The last resistance at 575 was taken out nicely. Now, it will be the support level I watch.
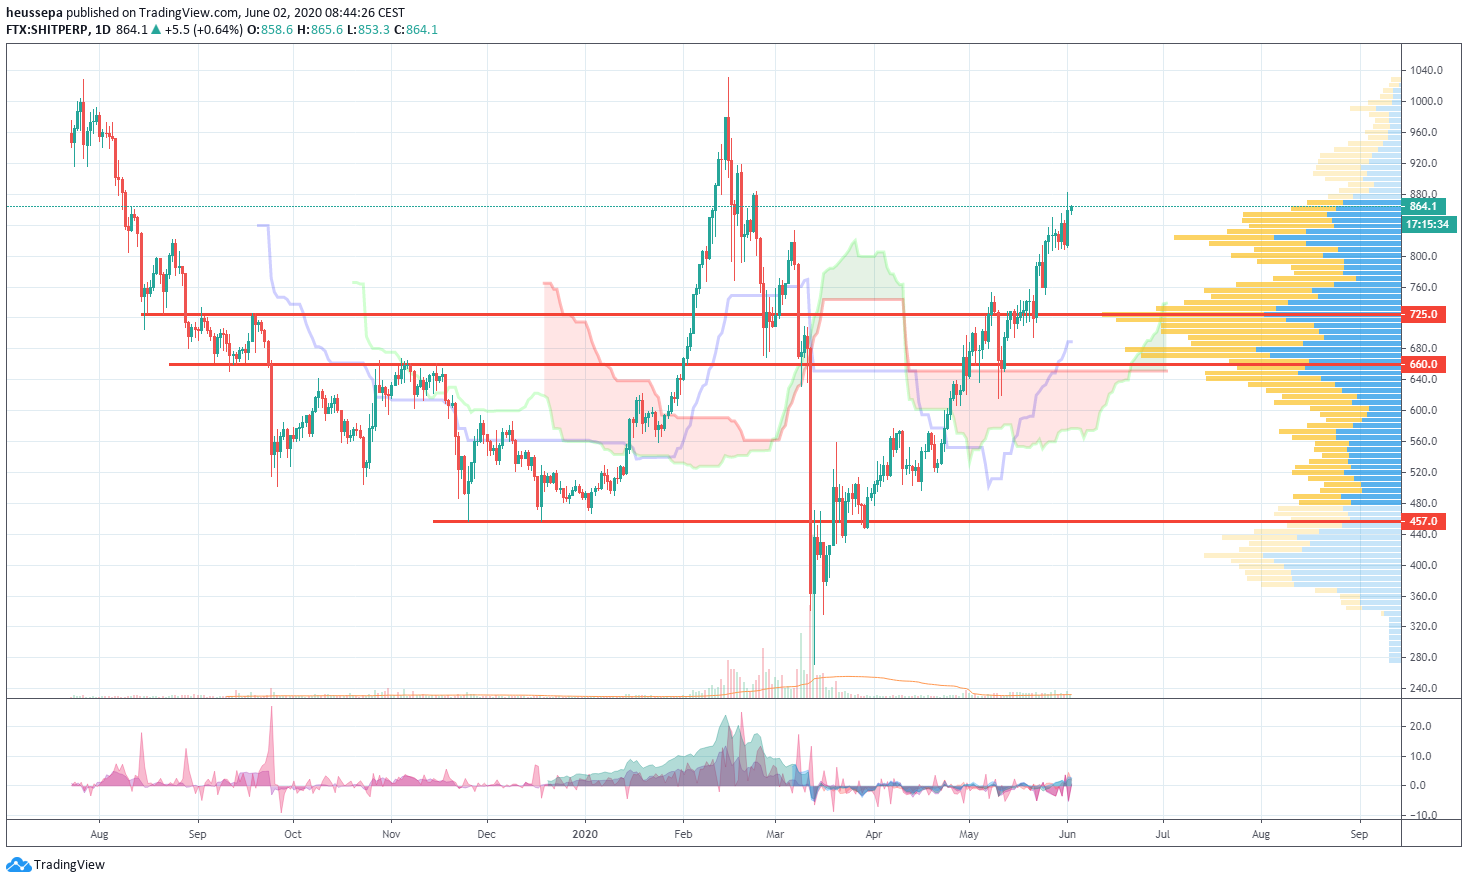
SHIT$ (daily)
The most impressive comeback of the three of them. We are close to the ATH. The Ichimoku cloud is bullish and we trade above the high before the March selloff.
Bitcoin HASHRATE-FUTURE 2021 Q1
The back end contract has reacted the most on the current price increase. The front end contracts did not do much. With the expected difficulty adjustment at around -10%. Bitcoin Difficulty Calculator