
Technical Analysis
Good Morning!
What could be better than TA-Tuesday after the long Easter break?
With all the macro news in TradFi, but also in the crypto space, it makes sense to start with a zoomed out view and then work our way into the shorter time frames.
Bitcoin BTC (daily)
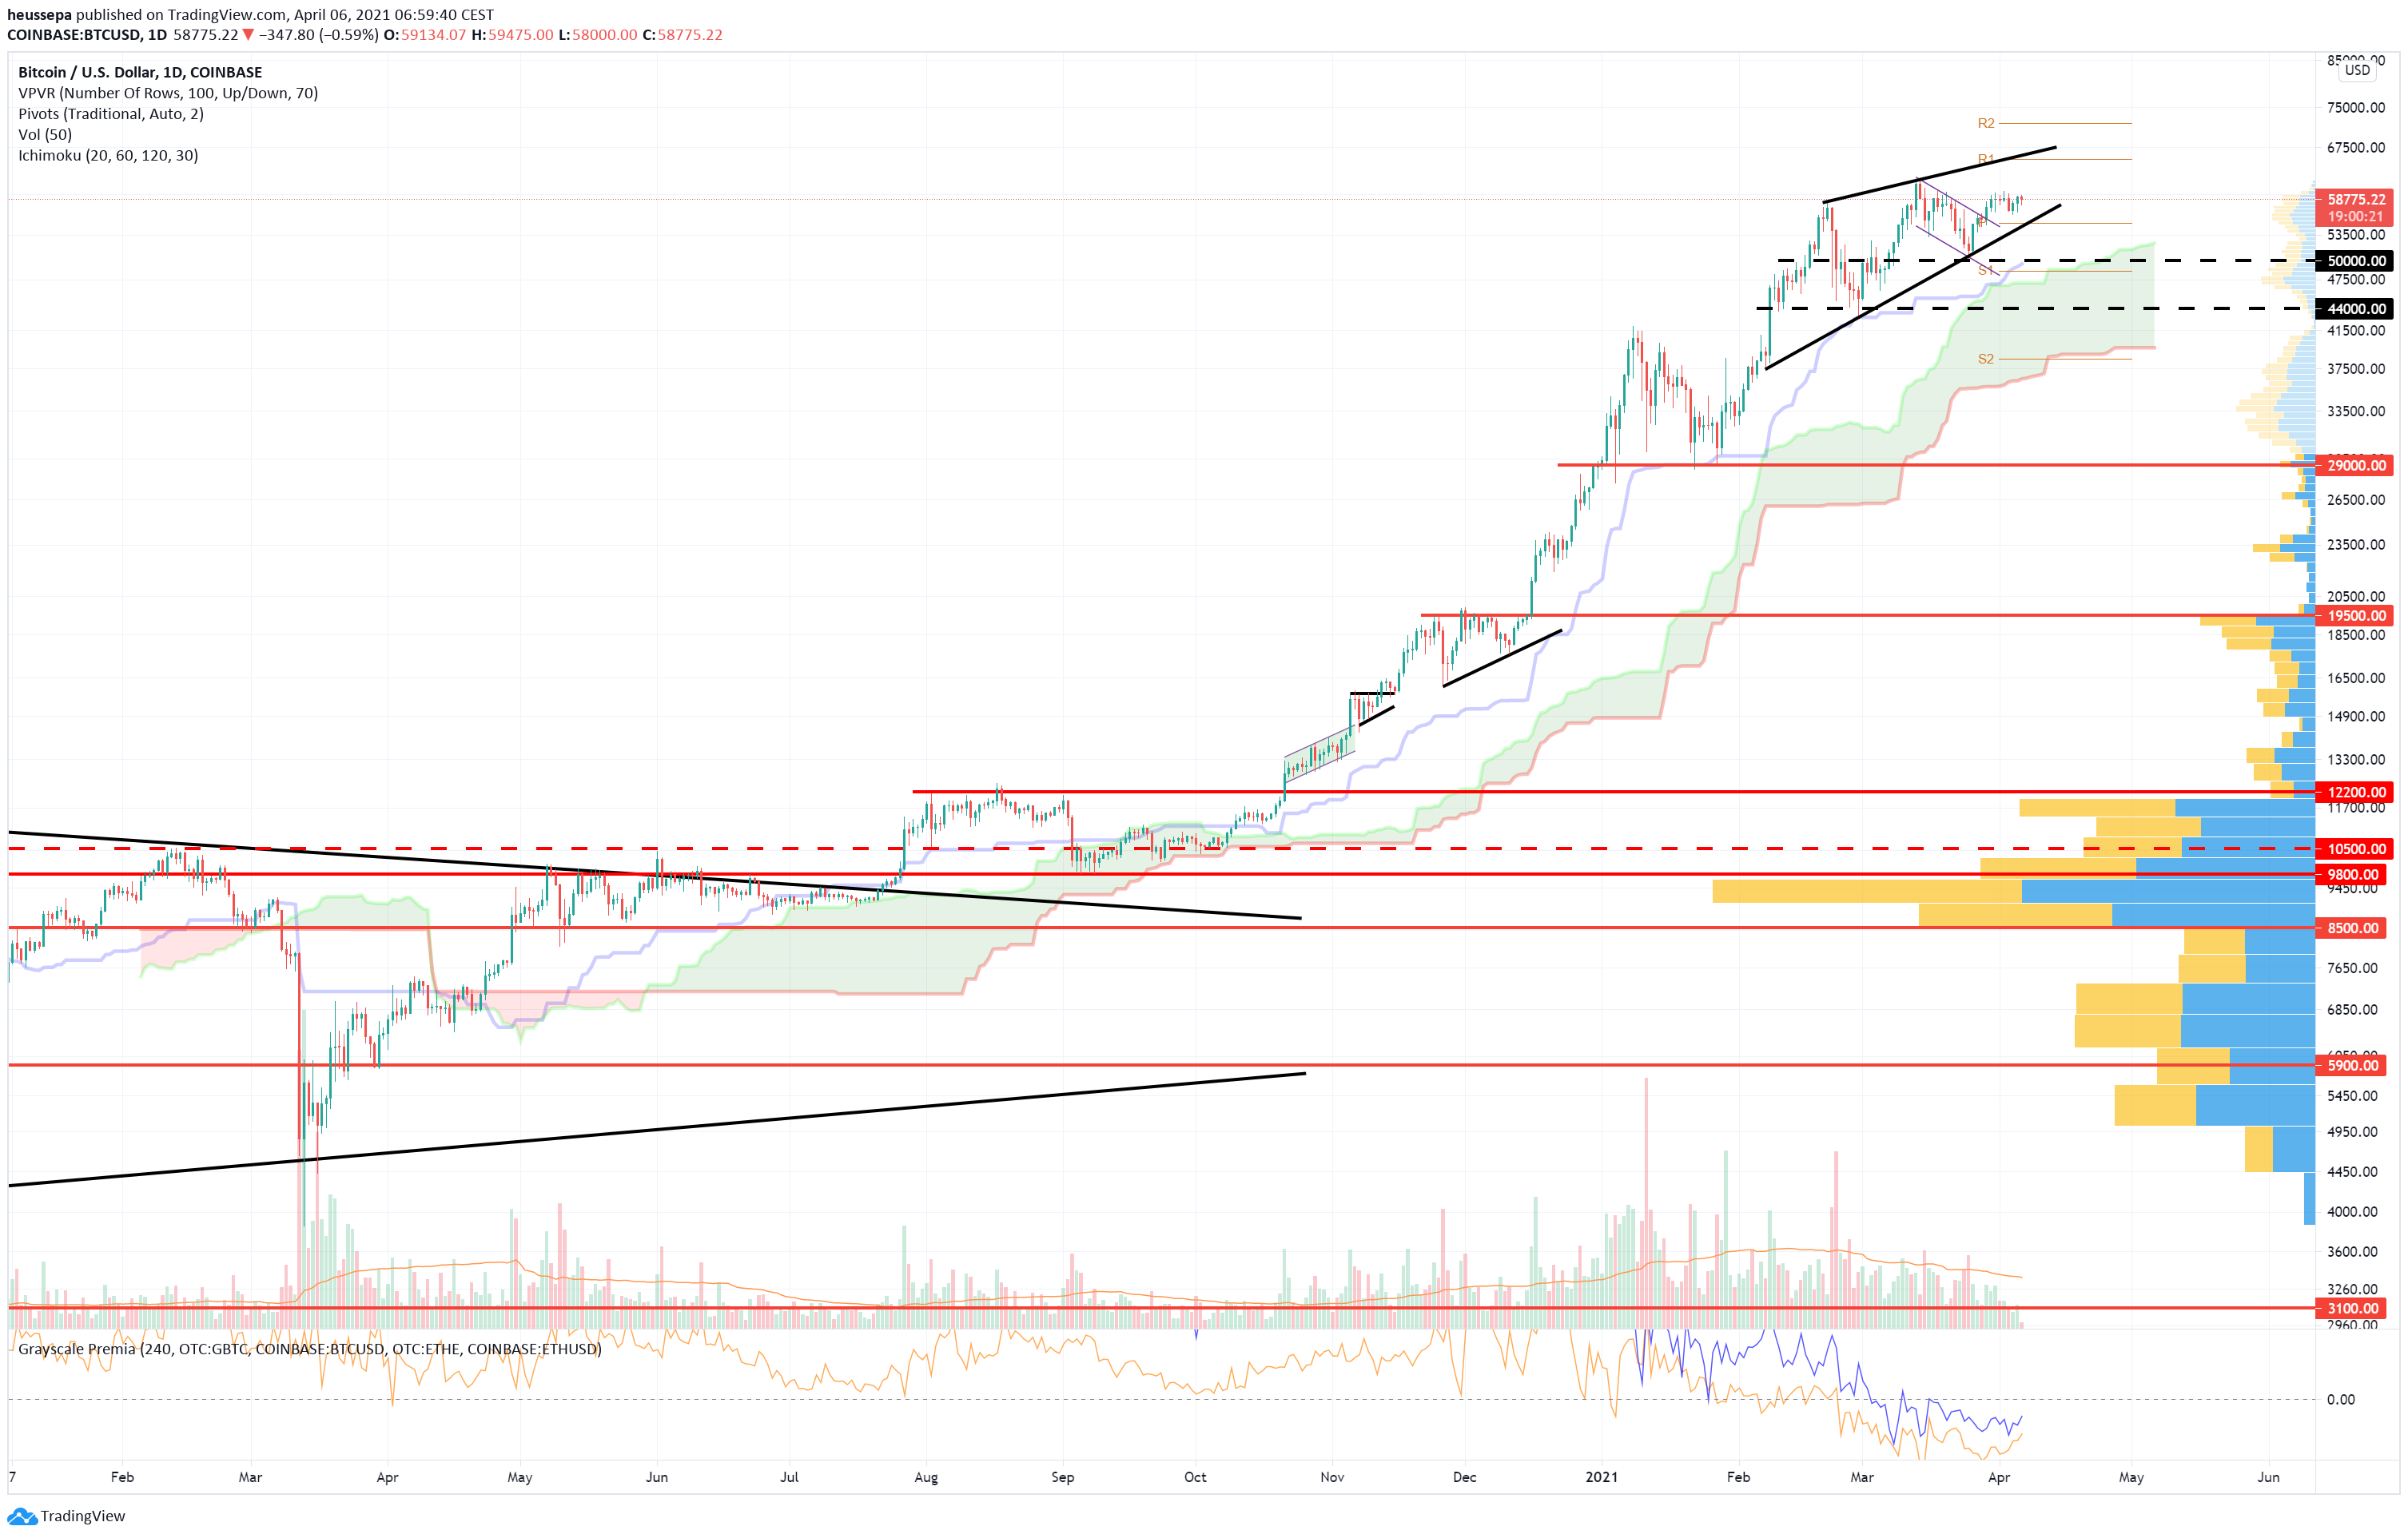
Yes, we are in a bull market, and so far nothing points in the direction of a swift change.
But a potential pattern (called a rising wedge) might be in the process of being built. To be more certain of this, I would need to see three touch points on both legs of the wedge. Additionally, I would need to see decreasing volume on the way up, and a large increase in volume when we break the lower leg of the wedge.
A rising wedge is not a trend reversal pattern. So, my target to the downside is somewhere in the range of $44-50k.
I am also monitoring the derivatives market. Especially the funding rates on perpetual and the term future basis. We have seen a constant widening of the term basis year to date (with BTC price moving from $20k to almost $62k). This is also nicely displayed by the annualised rolling 3mth basis at skew.com:
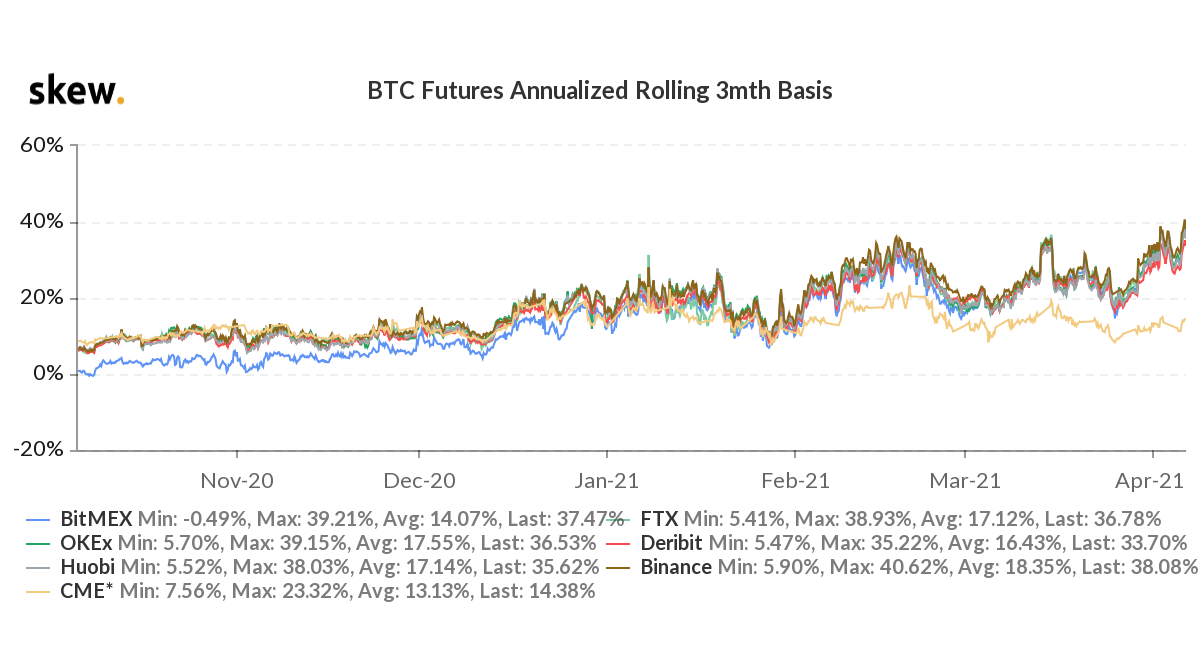
By the way, there are several good articles and podcasts around that try to explain the nature of that basis and what the drivers are: DM me if you need more info.
Returning now to the basis in terms of my technical chart analysis, I would like to point out that the market is stretched and to me it feels like the market needs a breather or the chance to reset before we print a new ATH.
Now, let's zoom into the 4h chart:
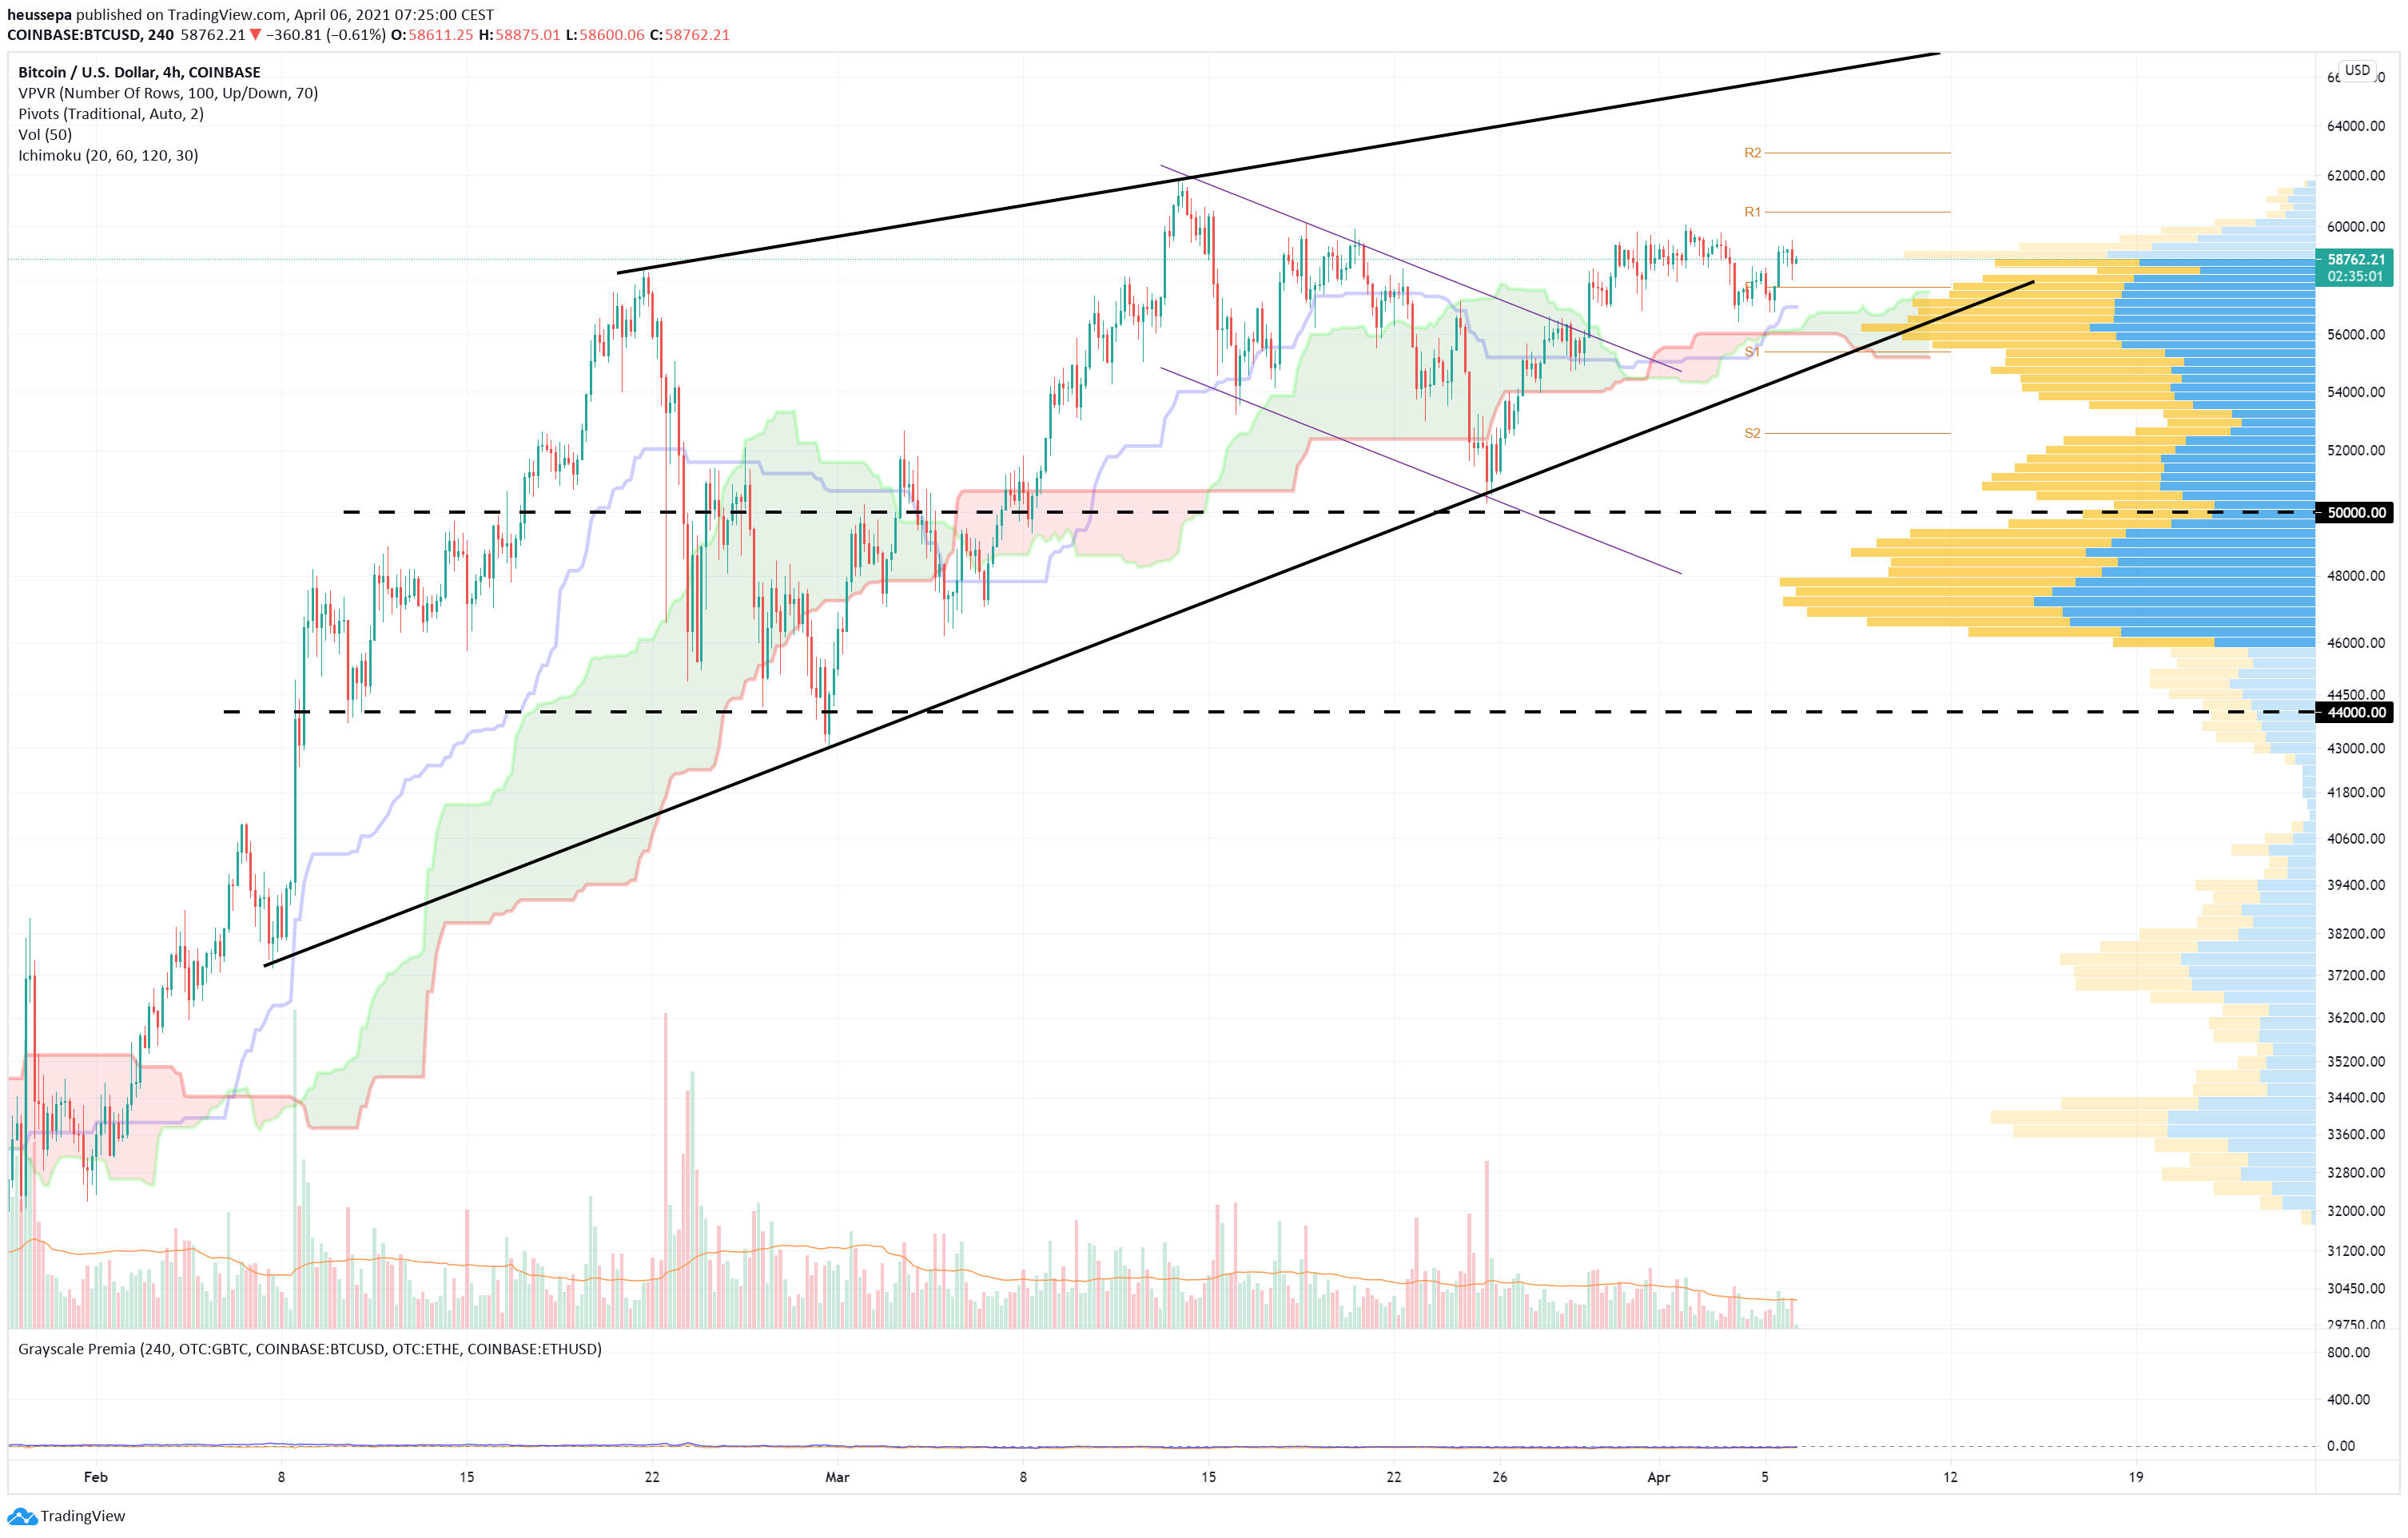
Here we are already seeing some choppiness with the Ichimoku cloud flipping back and forth (bullish/bearish).
What is clearly visible ever since we hit the high of $62k is the strong selling interest in the spot market at the $60k level. Every time we trade up to the $58-59k level, those large sell orders show up on pretty much every exchange.
In terms of the short term, this is the level I watch on the upside in combination with those large sell orders (if they actually get eaten up by the buyers, or if I see them shy away).
Copyright © 2021 | Crypto Broker AG | All rights reserved.
All intellectual property, proprietary and other rights and interests in this publication and the subject matter hereof are owned by Crypto Broker AG including, without limitation, all registered design, copyright, trademark and service mark rights.
Disclaimer
This publication provided by Crypto Broker AG, a corporate entity registered under Swiss law, is published for information purposes only. This publication shall not constitute any investment advice respectively does not constitute an offer, solicitation or recommendation to acquire or dispose of any investment or to engage in any other transaction. This publication is not intended for solicitation purposes but only for use as general information. All descriptions, examples and calculations contained in this publication are for illustrative purposes only. While reasonable care has been taken in the preparation of this publication to provide details that are accurate and not misleading at the time of publication, Crypto Broker AG (a) does not make any representations or warranties regarding the information contained herein, whether express or implied, including without limitation any implied warranty of merchantability or fitness for a particular purpose or any warranty with respect to the accuracy, correctness, quality, completeness or timeliness of such information, and (b) shall not be responsible or liable for any third party’s use of any information contained herein under any circumstances, including, without limitation, in connection with actual trading or otherwise or for any errors or omissions contained in this publication.
Risk disclosure
Investments in virtual currencies are high-risk investments with the risk of total loss of the investment and you should not invest in virtual currencies unless you understand and can bear the risks involved with such investments. No information provided in this publication shall constitute investment advice. Crypto Broker AG excludes its liability for any losses arising from the use of, or reliance on, information provided in this publication.

