
A summarizing review of what has been happening at the crypto markets of the past week. A look at trending sectors, liquidity, volatility, spreads and more. The weekly report in cooperation with market data provider Kaiko.
The last 7 days in cryptocurrency markets:
- Price Movements: Bitcoin broke $50k for first time since May, with altcoins leading the crypto-wide rally.
- Volume Dynamics: NFT's and fan tokens are the latest crypto sectors to see surging volumes.
- Order Book Liquidity: The bid-ask spreads for Ethereum and Bitcoin markets are converging.
- Macro Trends: Bitcoin's correlation with U.S. bonds turned negative for the first time since April.
- Derivatives: Funding rates are in healthy, positive territory.
Price Movements
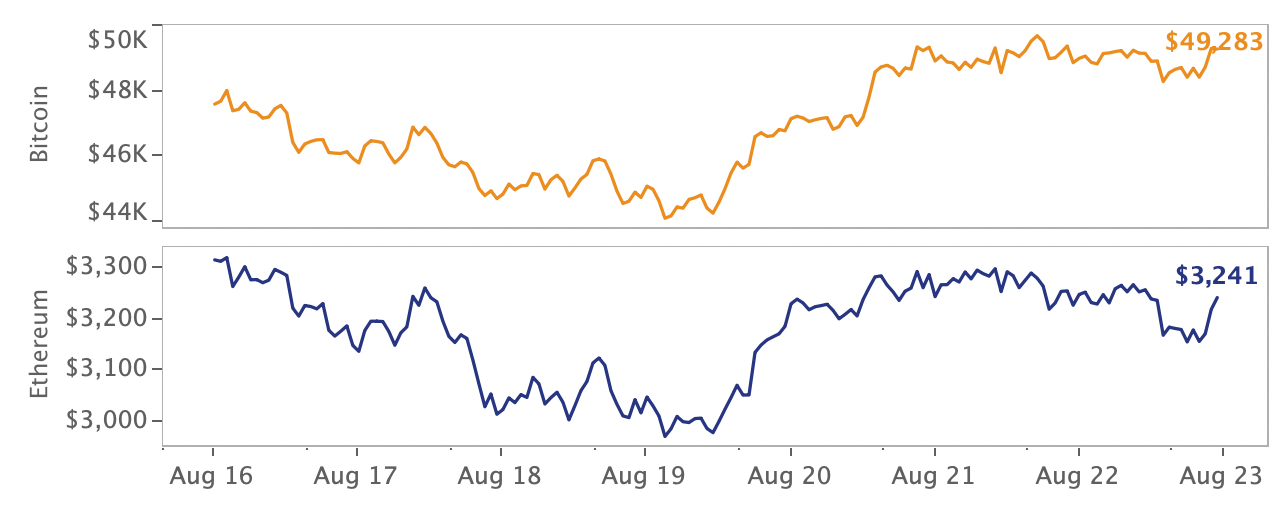
Bitcoin breaks $50k. For the first time since early May, Bitcoin crossed the vaunted $50k price level in a sign that markets have thoroughly come back to life. Over the past 30 days Bitcoin and Ethereum have surged a remarkable 44% and 50% respectively, following months of dismal returns and lackluster volumes. Institutional interest picked up last week as both Wells Fargo and JPMorgan registered Bitcoin funds with the SEC and Coinbase announced they would allocate 10% of future profits to crypto, the first public company to do so.
This week, global financial markets are focused on the Fed’s annual Jackson Hole Symposium taking place this Thursday - Saturday. The meeting of top Fed officials, central bankers, and policy experts promises to give insights into a potential tapering of bond purchases which could sharply impact financial markets still benefiting from pandemic-era monetary policy.
August Returns for Top Crypto Assets

Altcoins take the lead. Bitcoin’s comeback may be strong, but altcoins have undeniably led the recent market rally. Out of the top crypto assets, Bitcoin’s August returns are lowest at just +18%. Cardano (ADA) and Ripple’s XRP are the biggest winners this month with gains of +91% and +62%, respectively. Cardano—a public blockchain network that will soon implement smart contract technology—recently became the third largest cryptocurrency by market cap, breaking new all time highs and surpassing Binance’s native token (BNB). Uniswap, the largest DeFi asset, is up 27% this month, despite a warning from the SEC that decentralized finance is not immune to regulation.
Volume Dynamics
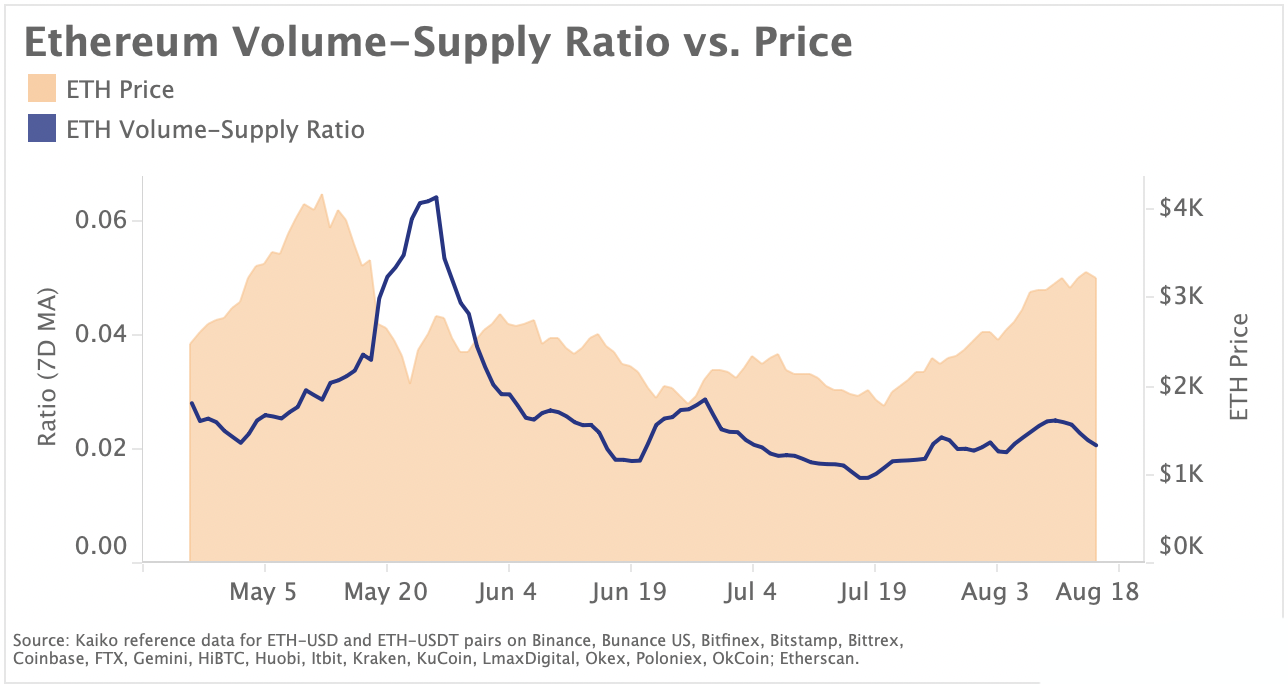
Ethereum’s off-chain velocity has stagnated since May. ETH total supply is increasing faster than trade volume on centralized exchanges. We chart the ratio between Ethereum trade volume in native ETH units (on CEXs) and the total ETH supply. The ratio can be used as a measure of off-chain velocity, which looks at how often Ethereum changes hands on centralized exchanges. When the ratio falls, this means that Ethereum supply is growing faster than trade volume, and vice versa. Lackluster volumes and increasing supply suggest that supply outstrips demand.
Since May’s record high volumes, the ratio has fallen significantly, but rebounded slightly in August, right as Ethereum underwent a series of upgrades known as the London Hard Fork which generated renewed interest for the network’s native crypto asset. One of the upgrades, EIP 1559, introduced a fee burning mechanism that takes a portion of ETH supply out of circulation and makes transaction fees more predictable. It is expected to boost the appeal of the second largest cryptocurrency by market cap for traditional investors by introducing a bitcoin-like deflationary narrative. Ethereum supply will not grow as quickly due to this deflationary feature, thus we can predict the ratio of volume/supply will increase in the future if ETH demand remains strong.
AXS Price vs. Trade Volumes
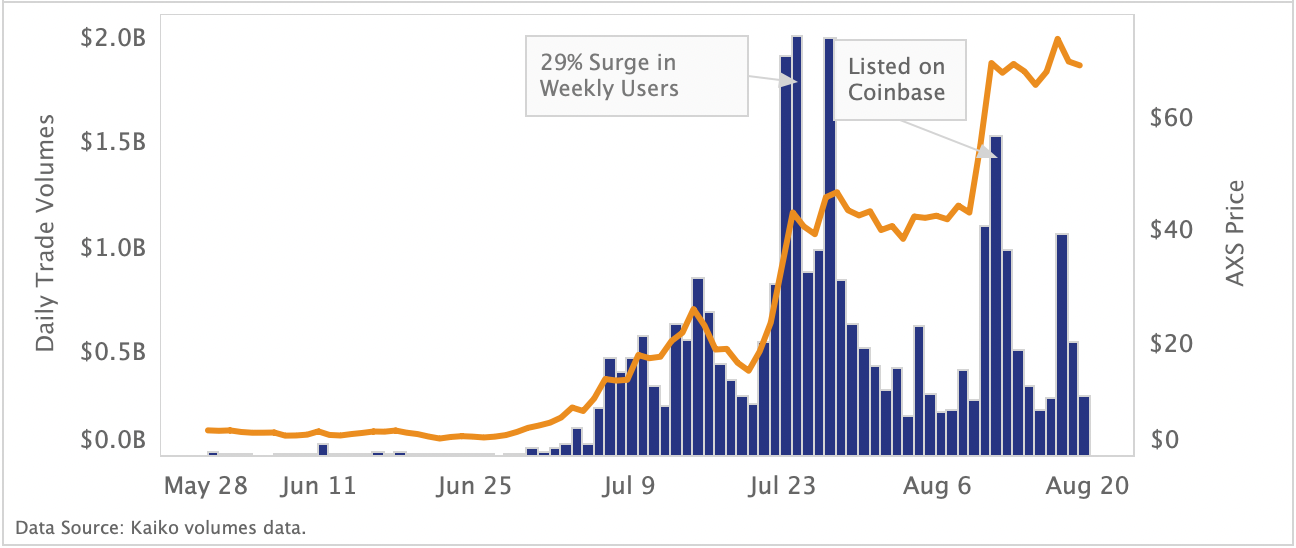
Exponential growth in NFT gaming. Games that incorporate non-fungible tokens (NFTs) have soared in popularity over the past few months, transforming the multi-billion-dollar gaming industry and contributing to Ethereum’s recent price rally. The ability to convert in-game tokens to fiat currency that can be used for daily transactions has contributed to surging interest in play-to-earn NFT games, especially in developing countries. Axie Infinity, an Ethereum-based blockchain NFT game, reported active daily users exceeding 1 Million in early August. The game’s in-game token, AXS, was recently listed on Coinbase and has more than quadrupled in value since June.
Above, we chart the daily volumes and price of AXS on Binance and Huobi, the two largest markets for the token. Before June, daily volumes were next to zero, and since then have peaked at $2 billion/day. We observe significant variance in daily volumes likely due to the token’s wild volatility, which soared from $5 to $69 over the course of five weeks.
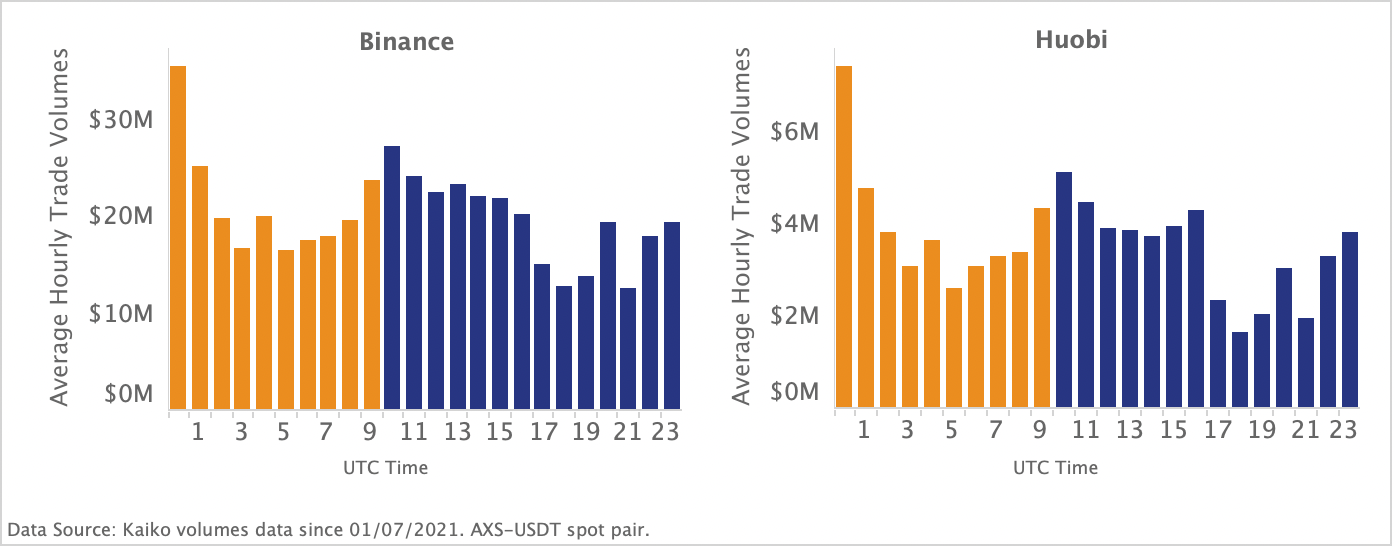
Around 40% of Axie Infinity users are domiciled in the Philippines. Below, we chart the hourly average trade volume for AXS on Binance and Huobi. We observe that surges in volume occur during Asian opening hours, spiking at 8:00 AM, 12:00 PM and between 16:00 – 19:00 PM Philippine time (UTC +8).
Average Hourly AXS Volumes
Filipino workers were hit hard by the pandemic with 18% YTD contraction of remittances and elevated unemployment levels of 8.7% (compared to 5.3% in Q1 2020). Axie Infinity has gained a huge following in the Philippines, where workers resort to gaming to supplement revenues.
NFT-games are just one booming segment of the NFT economy. Marketplaces which focus on the sale of NFT art have heavily benefited from the recent surge in interest. Trade volumes for CryptoPunks, Pudgy Penguins, and Bored Ape Yacht Club at OpenSea—one of the largest NFT marketplaces— recently exceeded $1.2 billion which reflects a month-on-month increase of over 930%.
Fan tokens enable monetization of fan engagement
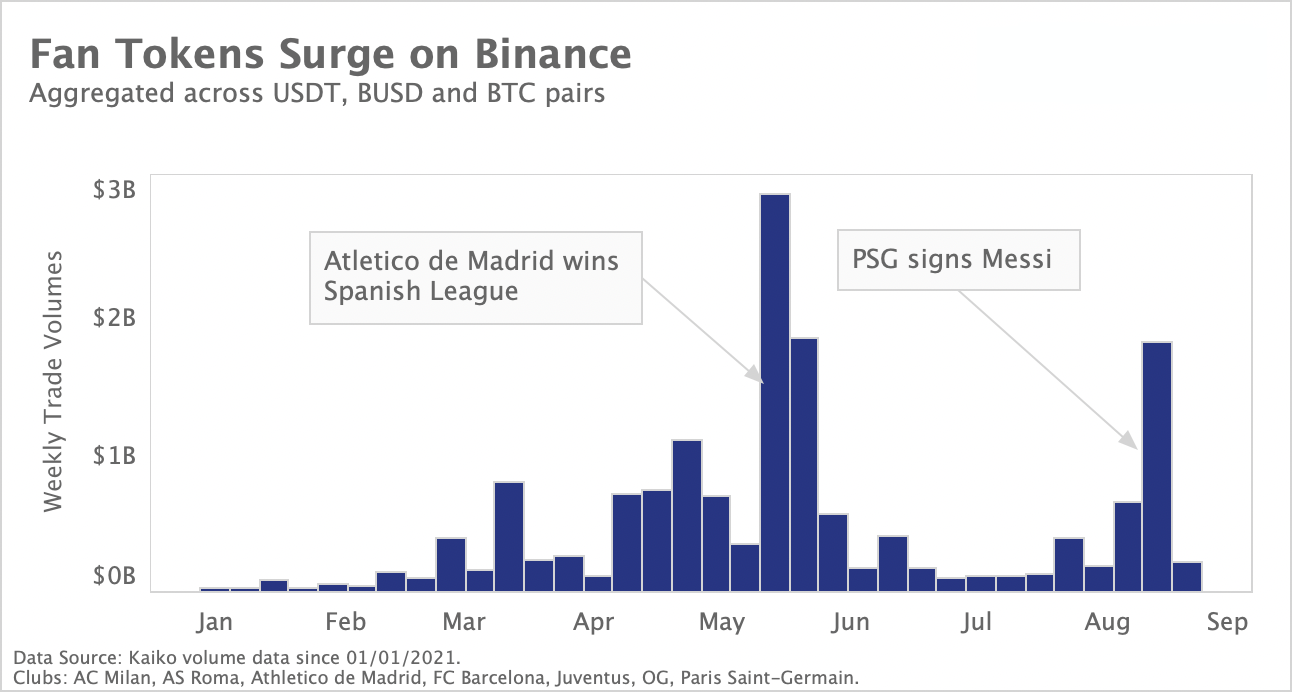
Fan tokens are fungible digital assets that enable fans of sports teams to influence decisions such as the choice of music to be played in a stadium. Fan tokens are currently traded on exchanges such as Binance, Upbit Korea, Paribu and Mercado. We chart weekly trade volumes of fan tokens traded on Binance and observe that last week, PSG tokens experienced all-time highs close to $1.2 billion after the team signed Lionel Messi. However, aggregate weekly volumes remain well below their peak of $2.9 billion reached in May as Atletico de Madrid clinched the Spanish league. Overall volumes remain low compared with more standard crypto assets, but fan tokens have the potential to gain popularity in the coming months as more football teams and sports get into the business.
Order Book Liquidity
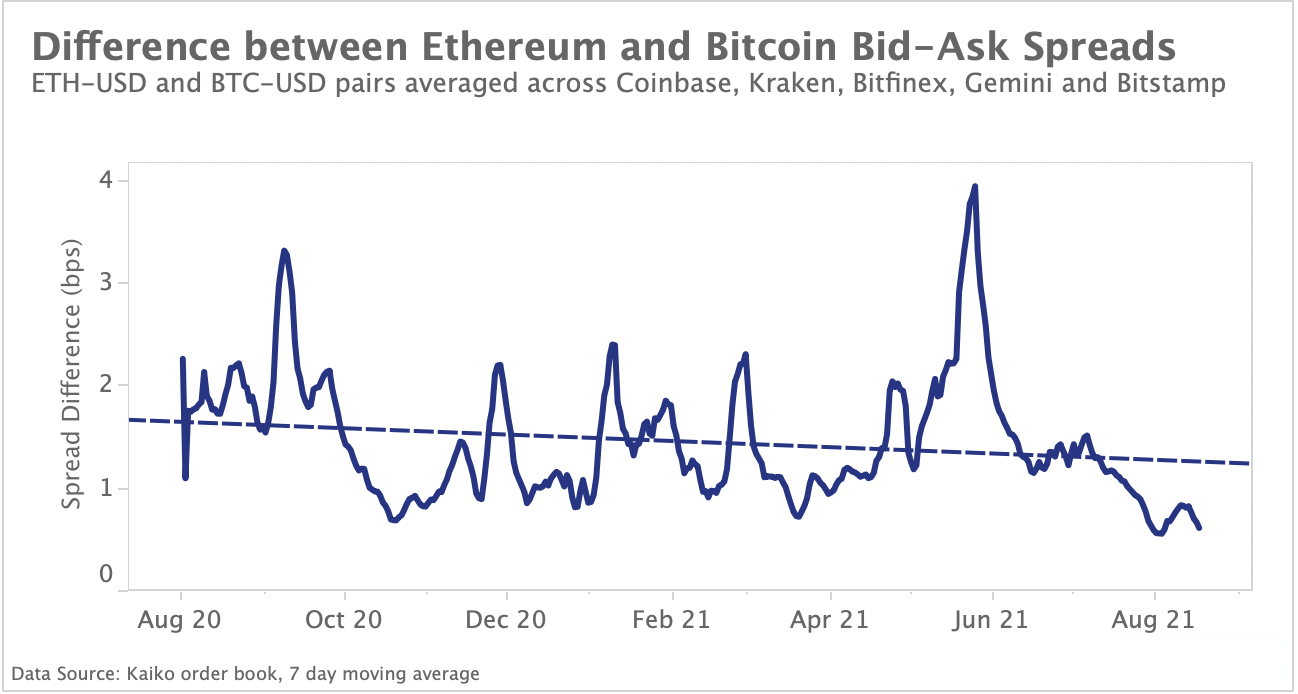
Ethereum and Bitcoin spreads converge. Ethereum market liquidity, as measured by the bid-ask spread, has improved significantly over the last twelve months. Typically, tighter bid-ask spreads indicate higher liquidity for a trading pair while wider spreads mean that liquidity is weaker. Above, we chart the spread of spreads averaged across top fiat exchanges by subtracting the average BTC-USD spread from the average ETH-USD spread. We can observe that the difference in spreads has dropped from a yearly high of 3.9bps in March to just .6bps in early August, a sign that liquidity for the two assets is converging.
When analyzing the difference in spreads at the exchange-level (charted below), we can observe that the spread between BTC-USD and ETH-USD on Coinbase varies the least, while on Kraken, the difference between the two assets exceeds 3 bps.

This suggests that market makers are supplying sufficient liquidity to both assets on Coinbase, while on Kraken, liquidity is provided asymmetrically between the two. In its quarterly earnings report Coinbase indicated that Ethereum trading volumes exceeded Bitcoin trading volumes for the first time in Q2, driven by strong growth in the NFT, DeFi and ETH staking sectors. The trend reflects rising institutional interest in the second largest cryptocurrency by market cap.


