
Good Morning!
It is time for another TA-Tuesday with additional bleeding on the altcoin front…
I feel the bleed in my own portfolio. Bitcoin is performing nicely, but I am not getting anywhere with my altcoins. Thankfully most of my coins are either staking somewhere or in liquidity pools producing some yield. It has been a while since I looked at the ALT, MID, and SHIT indices on FTX vs Bitcoin. The picture is not pretty, to say the least.
ALT Index vs. Bitcoin (daily)
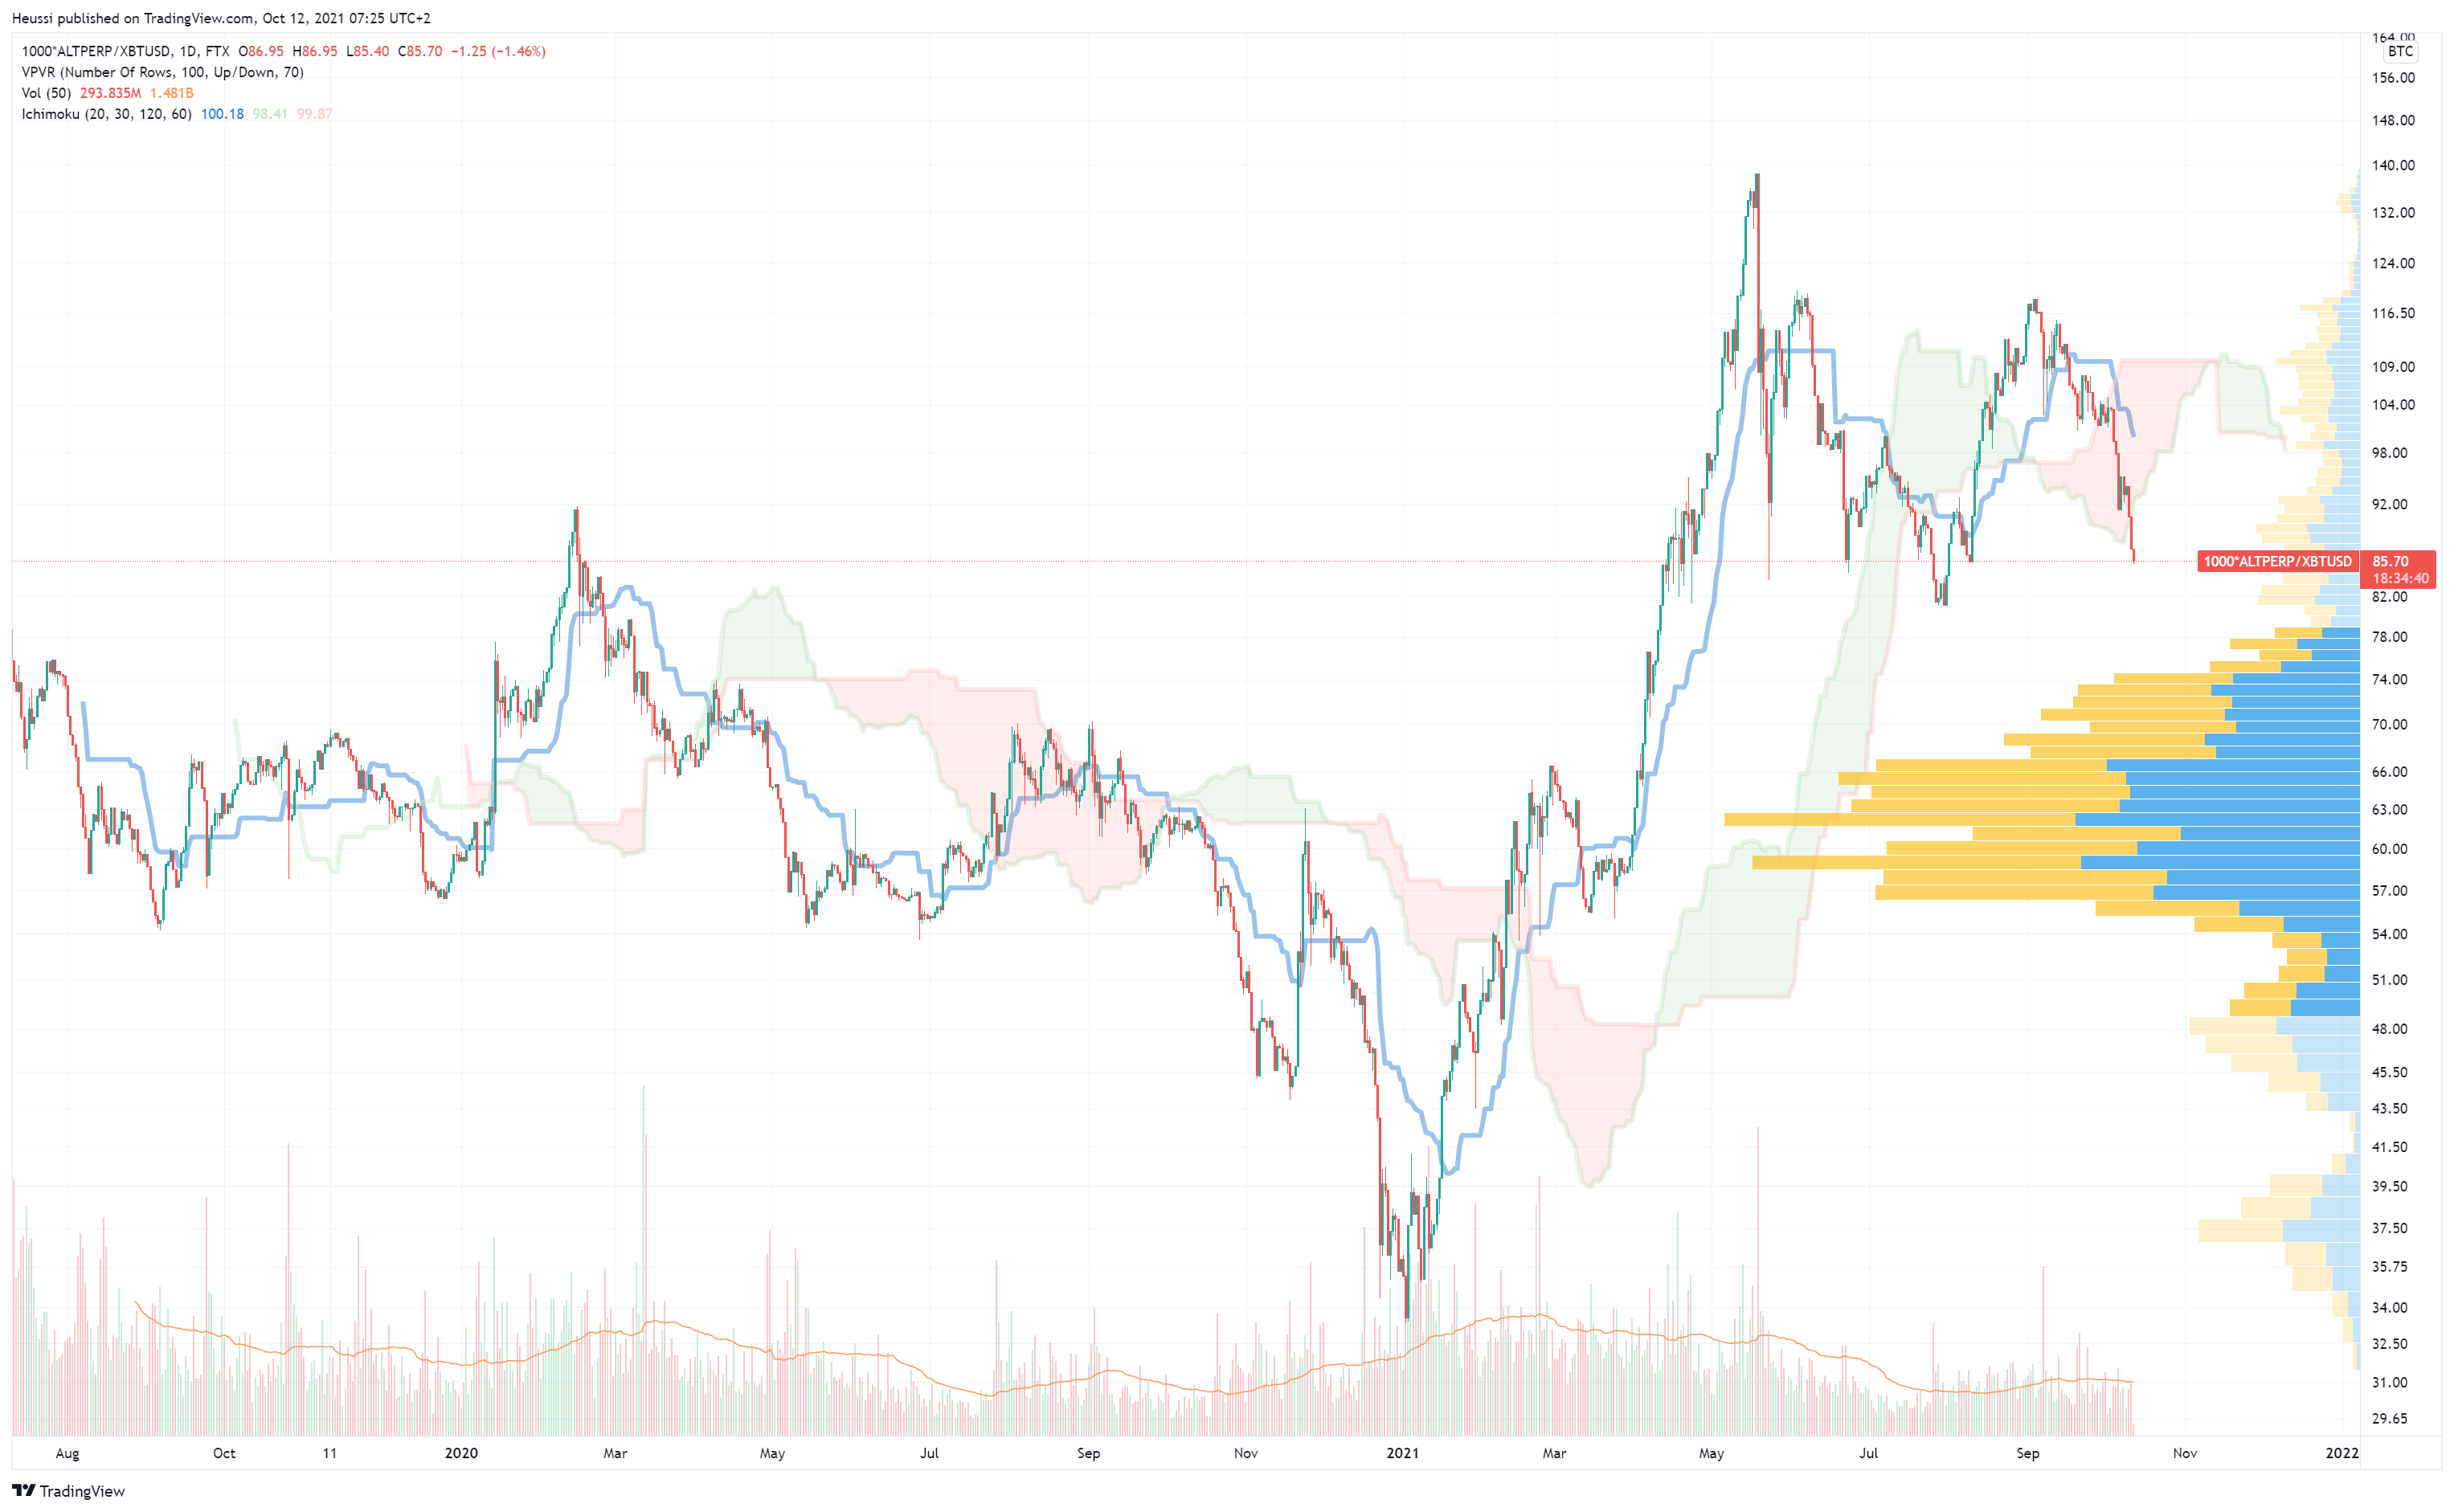
We are back to the lows we saw in May when the first selling wave in China was triggered. From a liquidity pool point of view, there is not much that supports the current price levels. Another 20% lower seems feasible, which is somewhere in the middle of a large liquidity pool (at around 66).
MID Index vs. Bitcoin (daily)
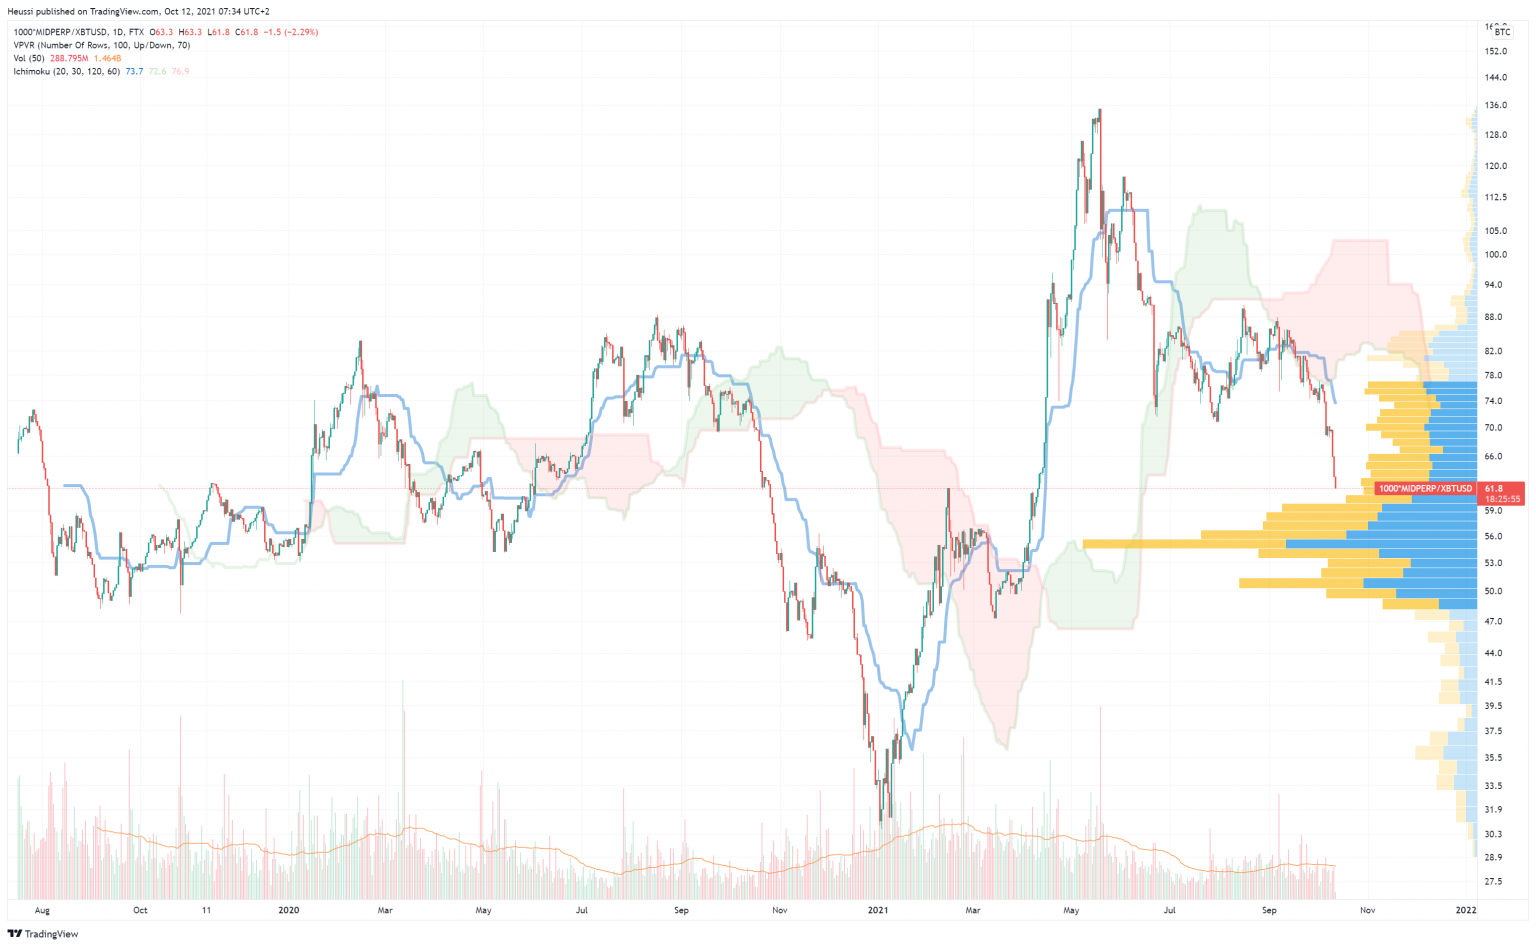
This one looks even worse. We are below the lows of both China sell-offs. We have roughly another 10% to the downside before we hit a large liquidity pool (at around 55).
SHIT Index vs. Bitcoin (daily)
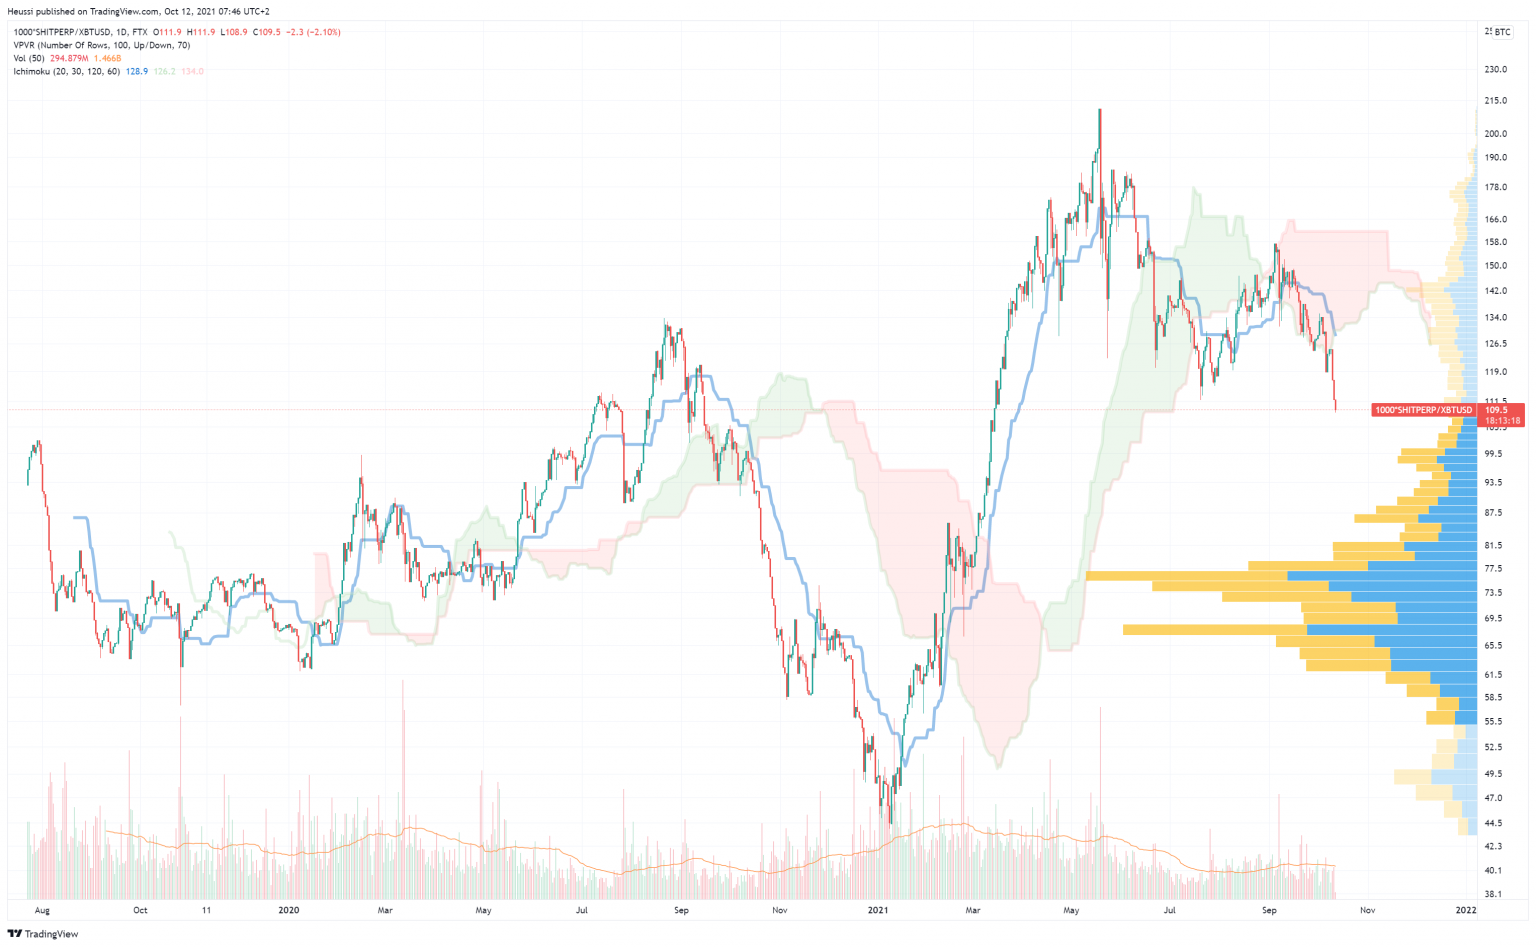
Funnily enough, the SHIT looks better compared to the MID (which is unusual when altcoins are bleeding versus bitcoin). Nevertheless, we are also trading below both China lows since May. What worries me a bit is the gap to the next lower liquidity pool, which comes in at around 77 (an additional 30% lower). I am not sure if the smaller coins need to catch up or if there is some kind of structure change happening.
Uniswap vs. Bitcoin (daily)
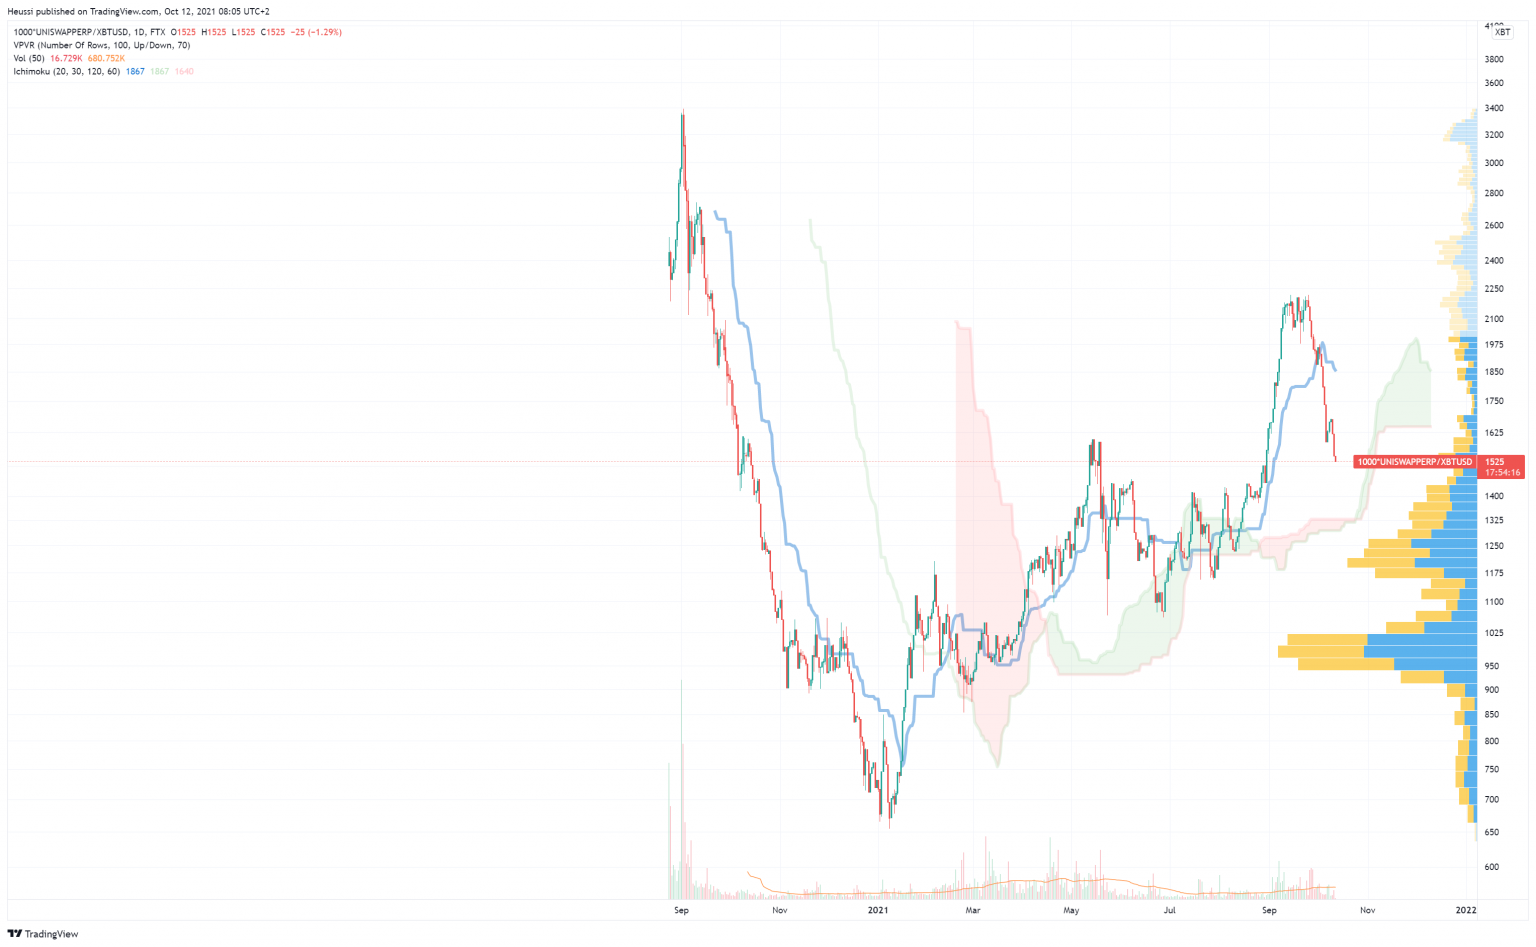
When bitcoin suffered from the selling pressure (due mainly to the regulatory changes in China), the unregulated and decentralised tokens outperformed. They did return some gains but are still far better performing versus ALT, MID, and SHIT.
Here are two points I would like to highlight:
- As mentioned in yesterday’s Market Commentary, I still believe that bitcoin will continue to outperform (be that on the way up or down).
- Is the Uniswap token outperformance the materialisation of the gap widening I was referring to in my regulatory notes?
I am more than happy to discuss both points with you.
Happy Trading!
All intellectual property, proprietary and other rights and interests in this publication and the subject matter hereof are owned by Crypto Broker AG including, without limitation, all registered design, copyright, trademark and service mark rights.
Disclaimer
This publication provided by Crypto Broker AG, a corporate entity registered under Swiss law, is published for information purposes only. This publication shall not constitute any investment advice respectively does not constitute an offer, solicitation or recommendation to acquire or dispose of any investment or to engage in any other transaction. This publication is not intended for solicitation purposes but only for use as general information. All descriptions, examples and calculations contained in this publication are for illustrative purposes only. While reasonable care has been taken in the preparation of this publication to provide details that are accurate and not misleading at the time of publication, Crypto Broker AG (a) does not make any representations or warranties regarding the information contained herein, whether express or implied, including without limitation any implied warranty of merchantability or fitness for a particular purpose or any warranty with respect to the accuracy, correctness, quality, completeness or timeliness of such information, and (b) shall not be responsible or liable for any third party’s use of any information contained herein under any circumstances, including, without limitation, in connection with actual trading or otherwise or for any errors or omissions contained in this publication.
Risk disclosure
Investments in virtual currencies are high-risk investments with the risk of total loss of the investment and you should not invest in virtual currencies unless you understand and can bear the risks involved with such investments. No information provided in this publication shall constitute investment advice. Crypto Broker AG excludes its liability for any losses arising from the use of, or reliance on, information provided in this publication.

