
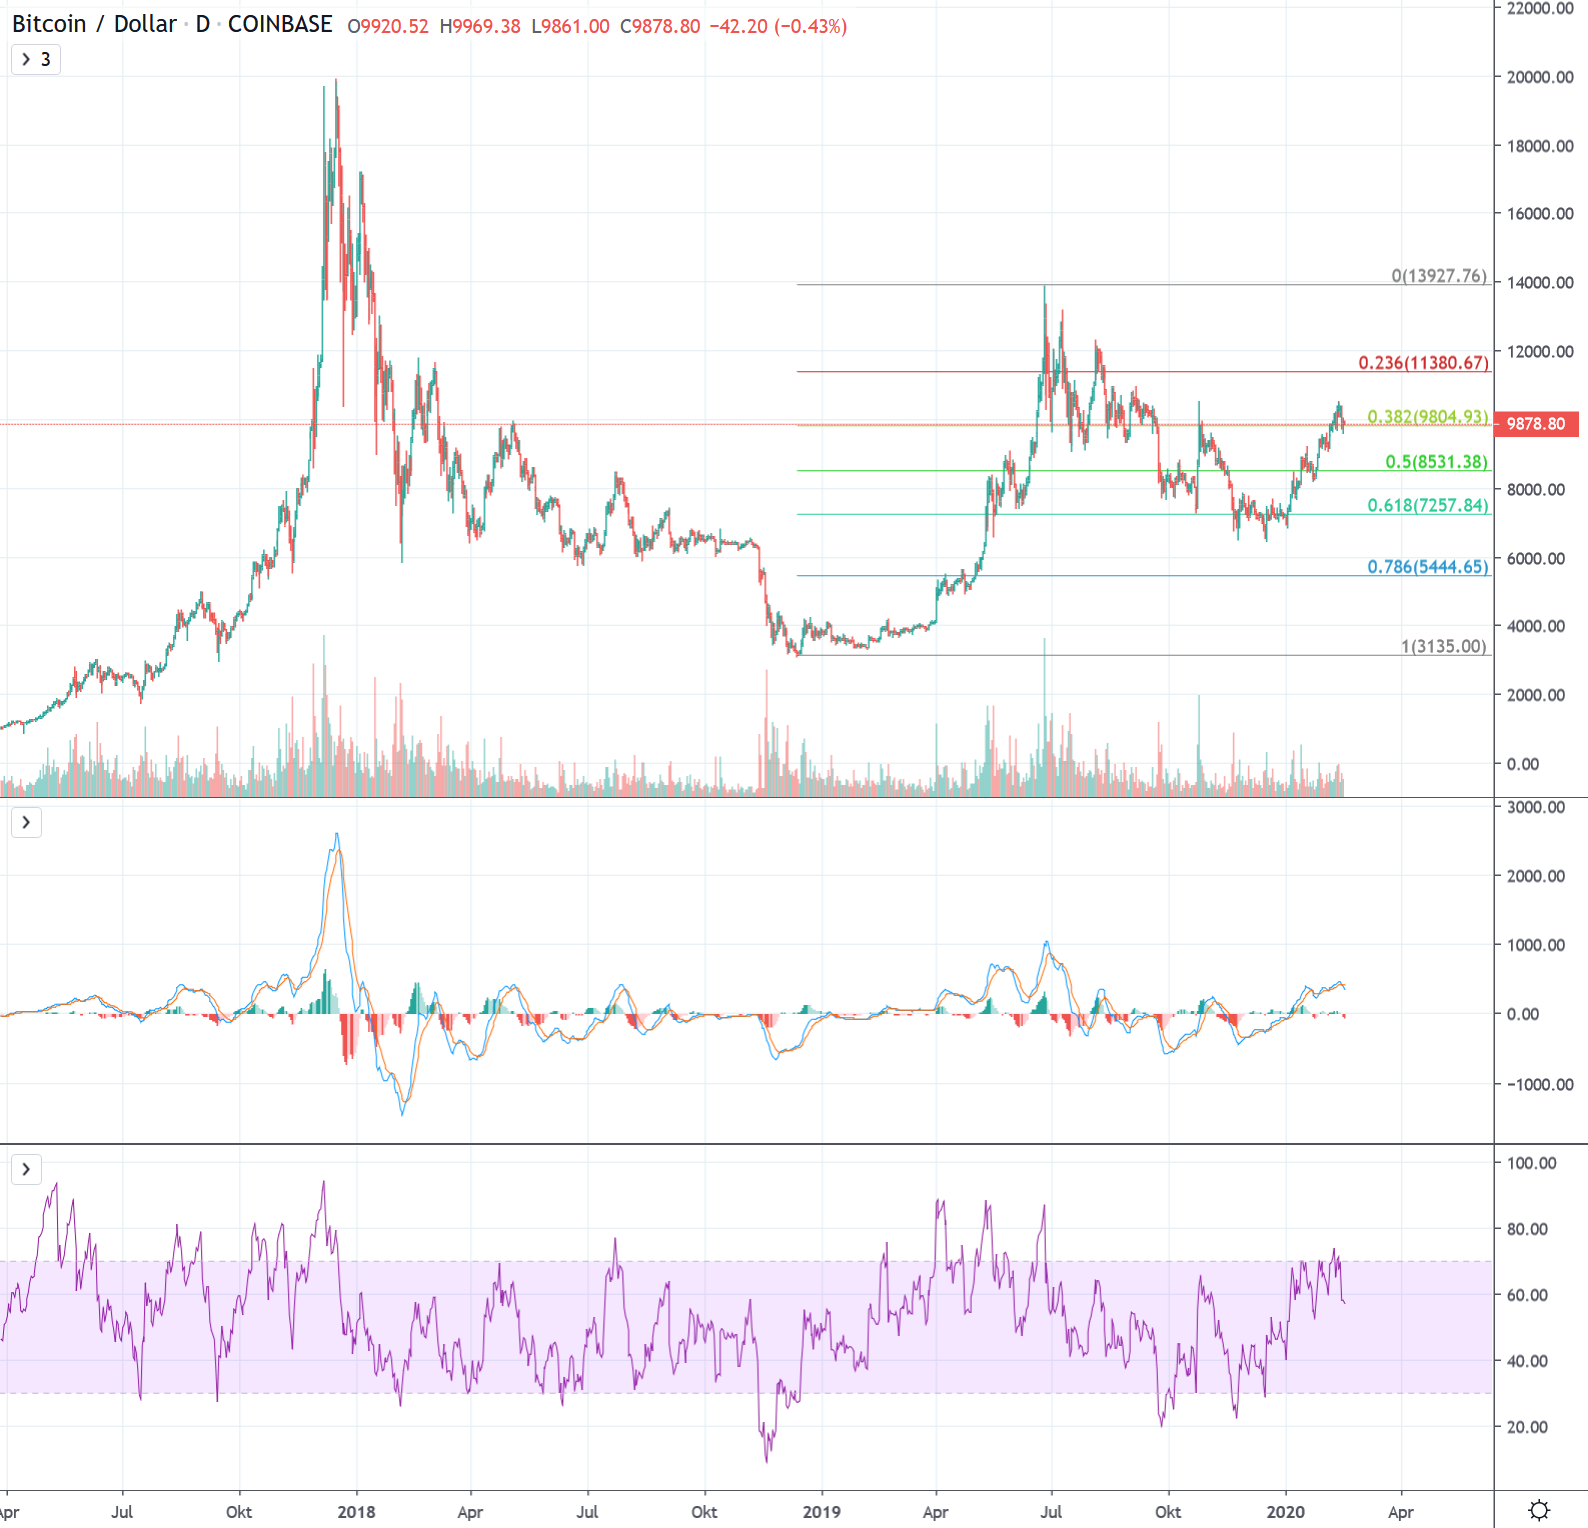
Bitcoin/USD daily basis
Bitcoin/USD – First taste of the strong resistance zone
This week, the price of bitcoin managed to break through the psychological hurdle of USD 10,000; with the breakthrough occurring in the late hours of last Sunday. This momentum was put to the test on Monday and Tuesday, which saw a daily low around 9’800 USD. However, Tuesday’s closing price of USD 10,250 was higher than in the previous days, which formed the basis for further price increases. In the second half of the week, daily highs amounting to USD 10,500 were reached, moving the price of bitcoin into a ‘technically’ relevant zone. However, this ascent was met with strong resistance, with the upward price movement experiencing a series of rejections. Consequently, the price declined and resided at USD 9,600 on Sunday,
Between USD 10,500 and 11,000 price range, the wheat becomes separated from the chaff
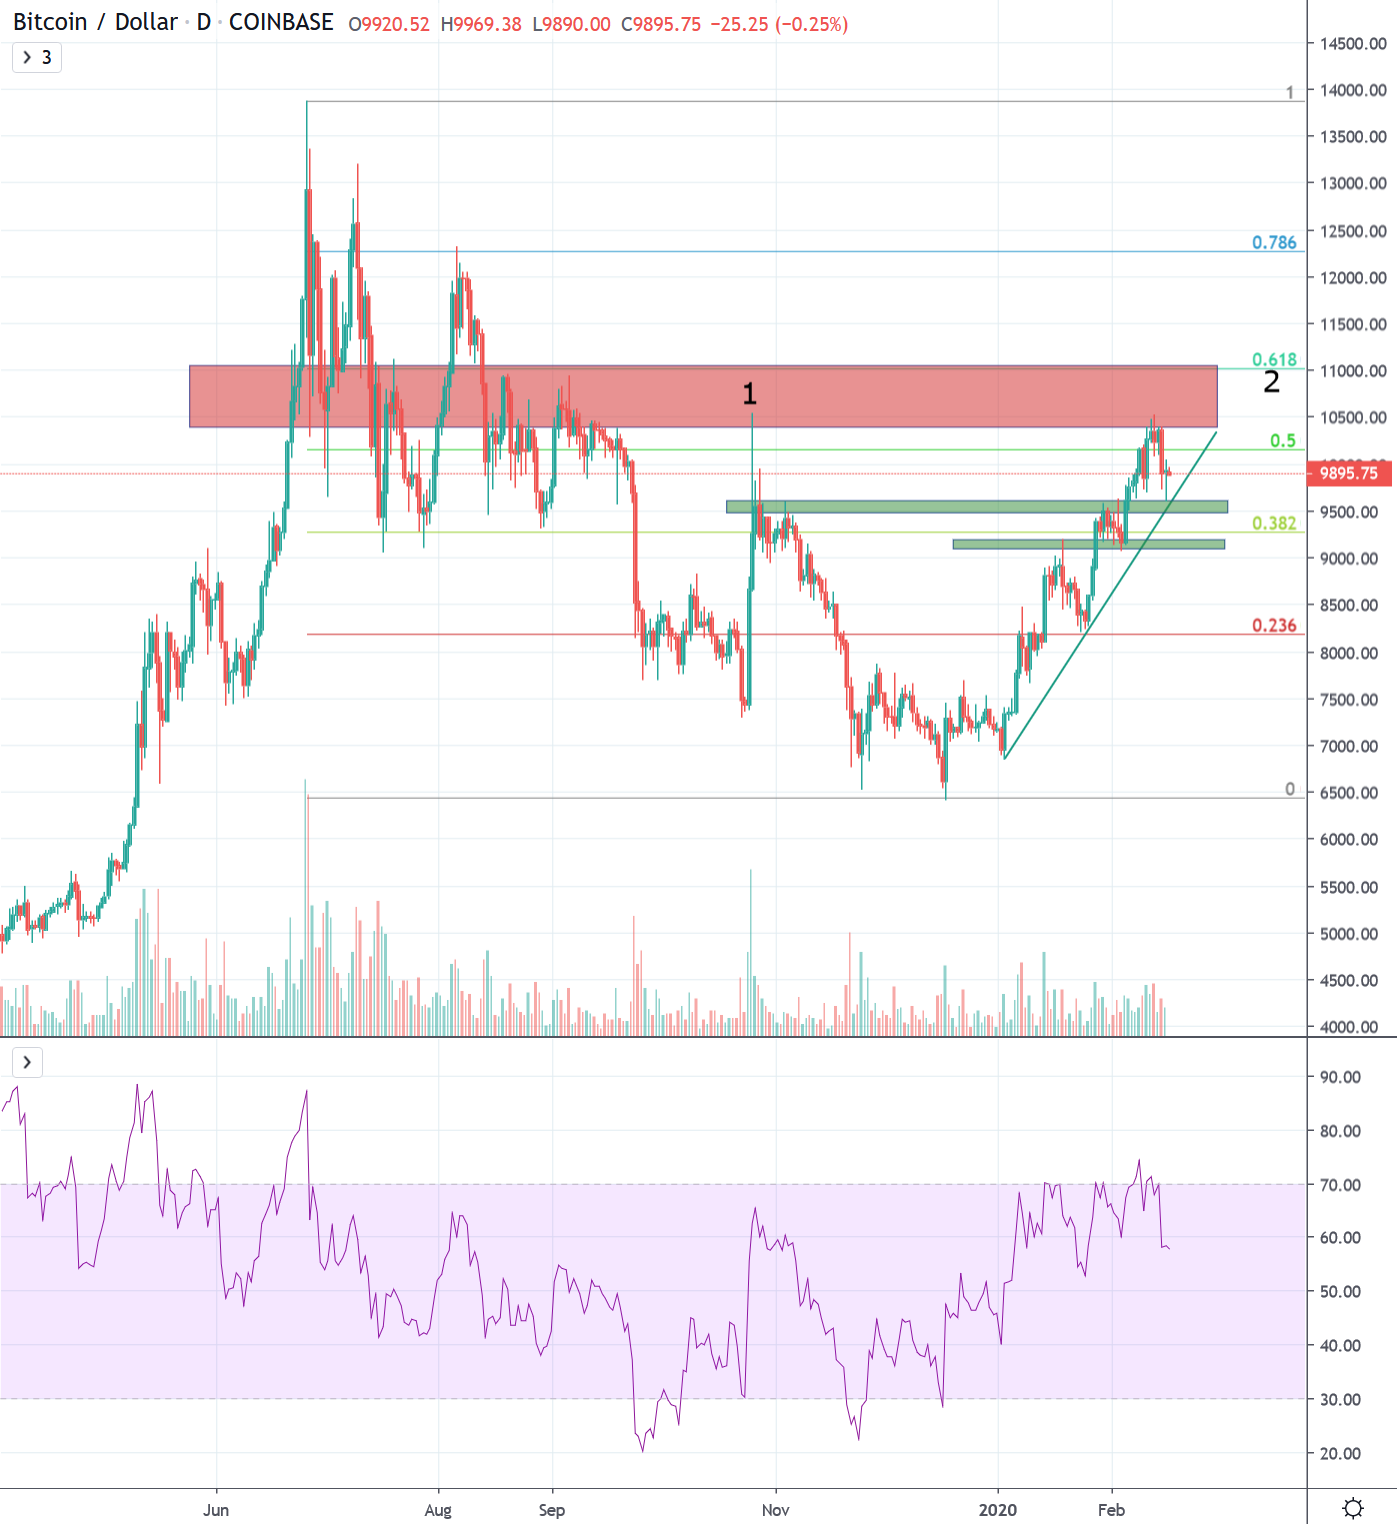 At present, we are entering a zone which is strongly influenced by earlier price movements (red). Between June and September 2019, the zone above USD 10,000 served as a support on several occasions before collapsing at the end of September. This zone also served as resistance during the massive two-day rally at the end of October (1). Now, a sterner test then the one posed in October is set to follow — with an initial rejection taking place this reporting week. The rejection resulted in a temporary low at the first support zone at 9’500 – 9’600 USD. This rejection was was formed by the market resistance towards the upward price movement that commenced 2 weeks ago (green). The next support is located between 8’900 and 9’100, formed by previous resistance to the upward-movement in mid-January and the pattern of higher lows since January.
Accordingly, numerous resistances are present from 10’500 USD to 11’000 USD (red). All of which have been confirmed by the highs recently reached. If one takes a Fibonacci calculation from the high reached in June to the low point of the downward movement in December 2019, the golden 0.618 Fibonacci point is at just under 11,000 USD (2). A surge through this level and a subsequent consolidation above the new highs of USD 10,500 nark represents a fundamental step that would need to be made in order for a new bullish cycle to emerge. Such a breakthrough would be instrumental to reach the old highs of around USD 20,000.
Macro: Signs of a trend reversal are intensifying
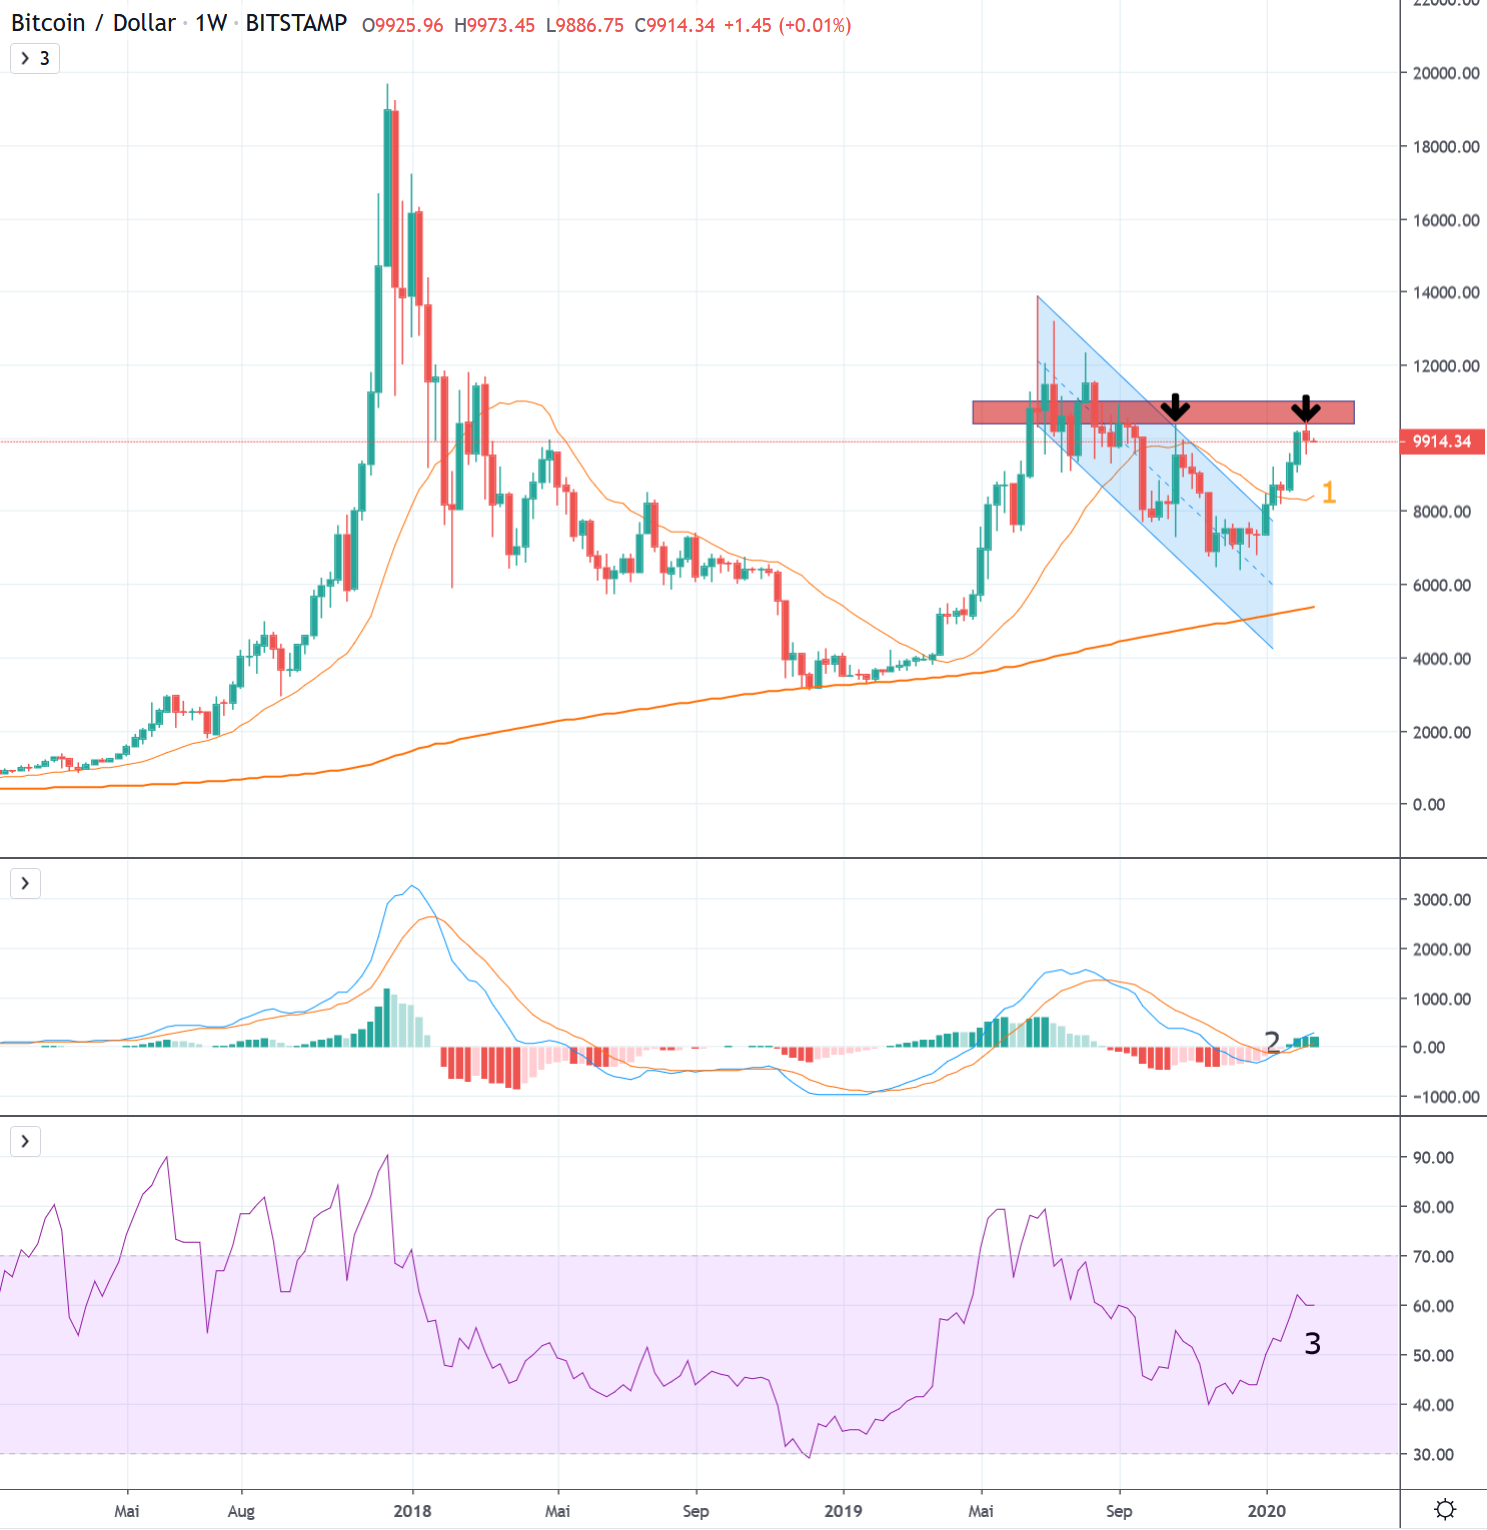
The series of lower highs and lows that has been prevalent since June 2019 has been interrupted. For the time being, a higher high above the trend-defining candle of October 2019 is missing (arrows). Last week’s attempt failed. A future weekly close above the 10,500 zone would remedy this shortcoming and help to improve the overall picture.
In the meantime, several hurdles have been overcome which speak in favour of the sustainability of the latest uptrend: 1. we are establishing ourselves above the 21-week average line (1). 2. the weekly MACD indicator has recently crossed and changed to positive (2). The weekly RSI also has room to move to overbought zones around 70 (3). The following resistance zones (red) formed by already tested and failed breakout attempts in 2018, as well as the long period between July and September 2019 which serves as support, are strong.
Here, the credibility of the most recent upward-movement will have to prove itself in the coming weeks. A confirmation of a trend reversal since June 2019 is still pending. A first failure of the resistance zones above USD 10,500 has occurred. As long as the trend of higher lows and highs can continue, the failure is not detrimental to the recent structure. Currently, USD 9,500 from the previous week’s high and USD 9,000 from the low of the current candle serve as support.
A breach of the resistance zones between USD 10,500 and USD 11,000 in the coming weeks would validate a sustained break in the prevailing downtrend and could lay the foundation for another bull-phase lasting several months.
Disclaimer
All information in this publication is for general information purposes only. The information provided in this publication does not constitute investment advice and is not intended as such. This publication does not constitute an offer, recommendation or solicitation for an investment in any financial instrument including crypto-currencies and the like and is not intended as an offer, recommendation or solicitation. The contents contained in the publication represent the personal opinion of the respective authors and are not suitable or intended as a basis for a decision.
Risk note
Investments and investments, especially in crypto-currencies, are always associated with risk. The total loss of the invested capital cannot be excluded. Crypto-currencies are very volatile and can therefore be exposed to extreme exchange rate fluctuations within a short period of time.


