
A summarizing review of what has been happening at the crypto markets of the past week. A look at trending sectors, liquidity, volatility, spreads and more. The weekly report in cooperation with market data provider Kaiko.
The last 7 days in the cryptomarkets:
- Price Movements: As Bitcoin (BTC) suffered steep losses, Ethereum (ETH) and several altcoins reached new all time highs, a divergence from typical market behavior.
- Trading Volume: As Ethereum reached a new all-time high its trading volume actually surpassed that of Bitcoin for a brief moment. In general, trading sizes have increased over the past months - a sign of institutional presence.
- Order Book Liquidity: The shortage of bids and asks on Bitcoin order books is correlated with an increase in long-term holders, identified using on-chain data.
- Volatility and Correlations: Ethereum is consistently more volatile than Bitcoin, but intraday volatility for both assets is on the rise.
Average trade size increased sharply as the bull run commenced
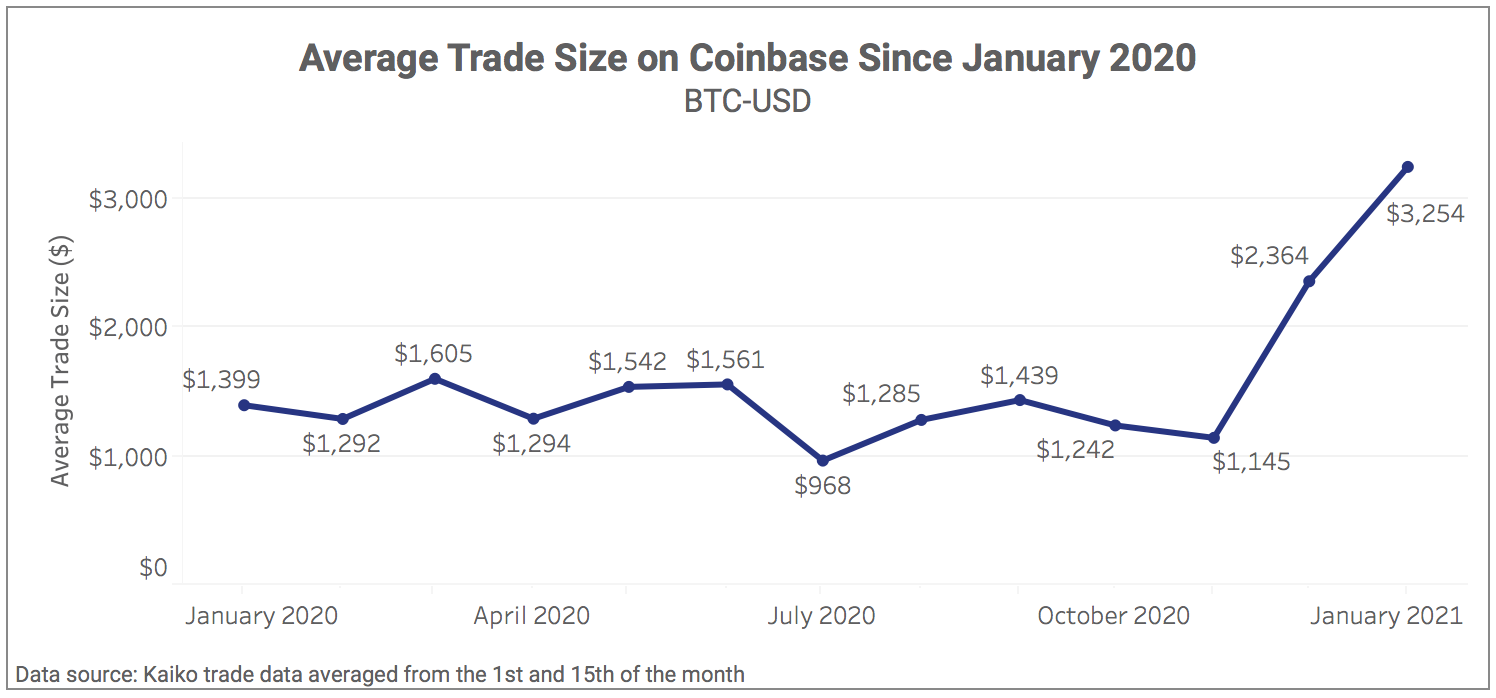
Last week, we found that the average trade size during the January 11th price crash was double that of the March crash. When taking a closer look at trade sizes throughout 2020-21, we can observe a sharp increase occurred in December, which was right when the Bitcoin bull run picked up momentum. Hundreds of thousands of trades are executed every day on Coinbase, so an increase in the average trade size suggests that there was a significant shift in the behavior or profile of traders around this time.
Institutional traders will typically break up a large order into many smaller ones and execute them over the course of several days or weeks to prevent market movements and avoid price slippage. The increase in trade size is likely a result of these types of traders breaking apart large trades, rather than a shift in behavior of retail/mid-level traders.
What is causing Bitcoin's liquidity shortage?
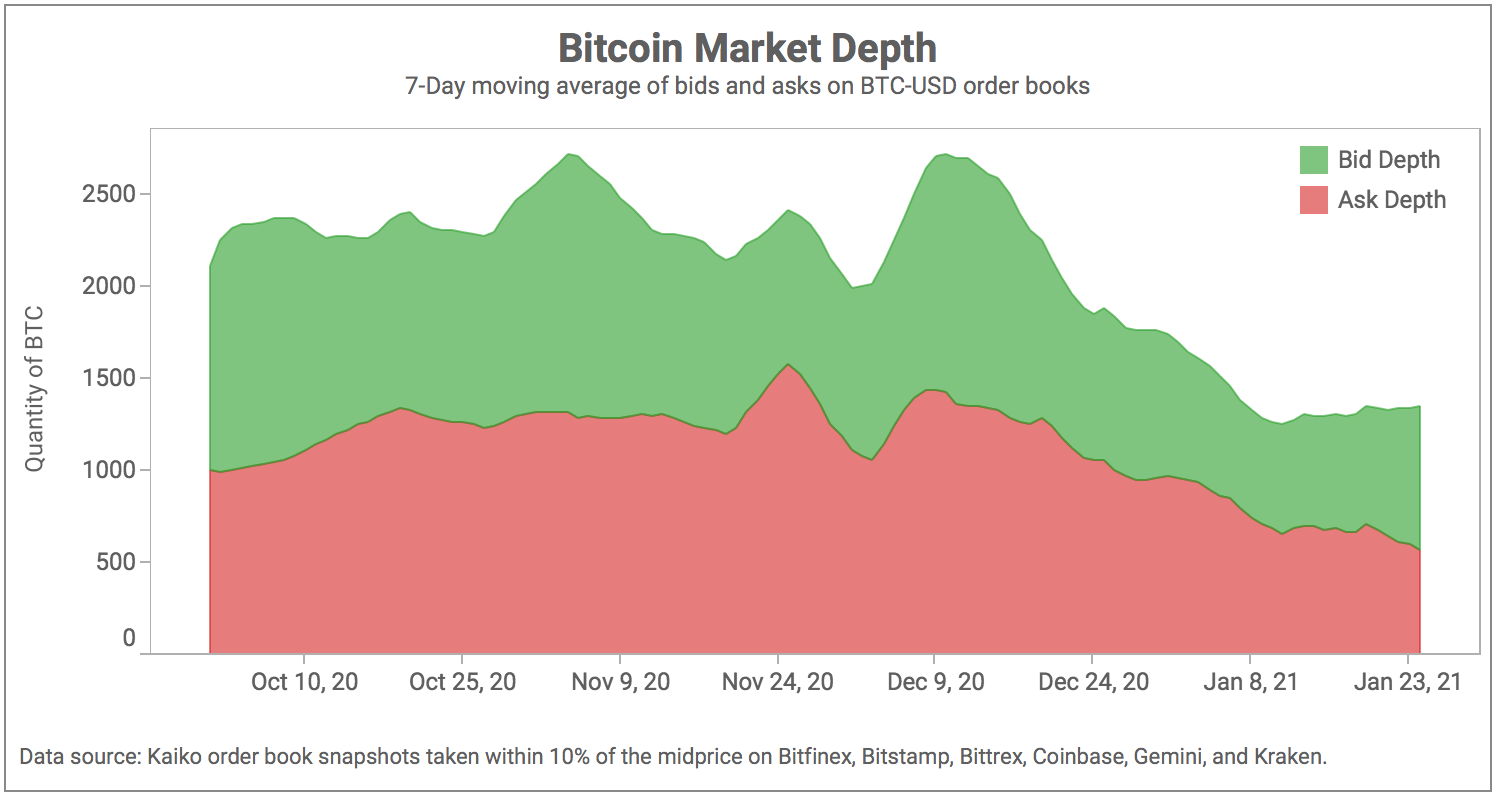
We keep coming back to this chart of average daily Bitcoin market depth because the trend has rarely been this strong. Order book liquidity frequently fluctuates based on market movements, but there are few historical instances of such a consistent long term downtrend.
Last week, eToro became the first exchange to warn their customers that Bitcoin buyers on weekends could face limitations due to a liquidity shortage. The exchange cited a higher risk of volatility linked to the lack of liquidity and urged traders to understand the trading risks.
One possible factor contributing to the drop in liquidity is the increasing presence of long-term holders. When institutions buy large amounts of Bitcoin, they typically hold it, and don't actively trade it. The best example of this is Grayscale’s Bitcoin Trust, which purchased nearly 260k BTC in the second half of 2020. These Bitcoins are not being actively traded or moved - they are held in custody. Glassnode recently reported an increase in the number of Bitcoin in "accumulation addresses", addresses identified as belonging to entities who hold. Chainalysis data also shows an increase in the number of "illiquid" BTC held.
The data suggests that Bitcoin is overwhelmingly being used as a store of value right now, and the more institutions that take an interest in the crypto-asset, the bigger this shortage could become.
Ethereum trading volume was briefly greater than Bitcoin volume
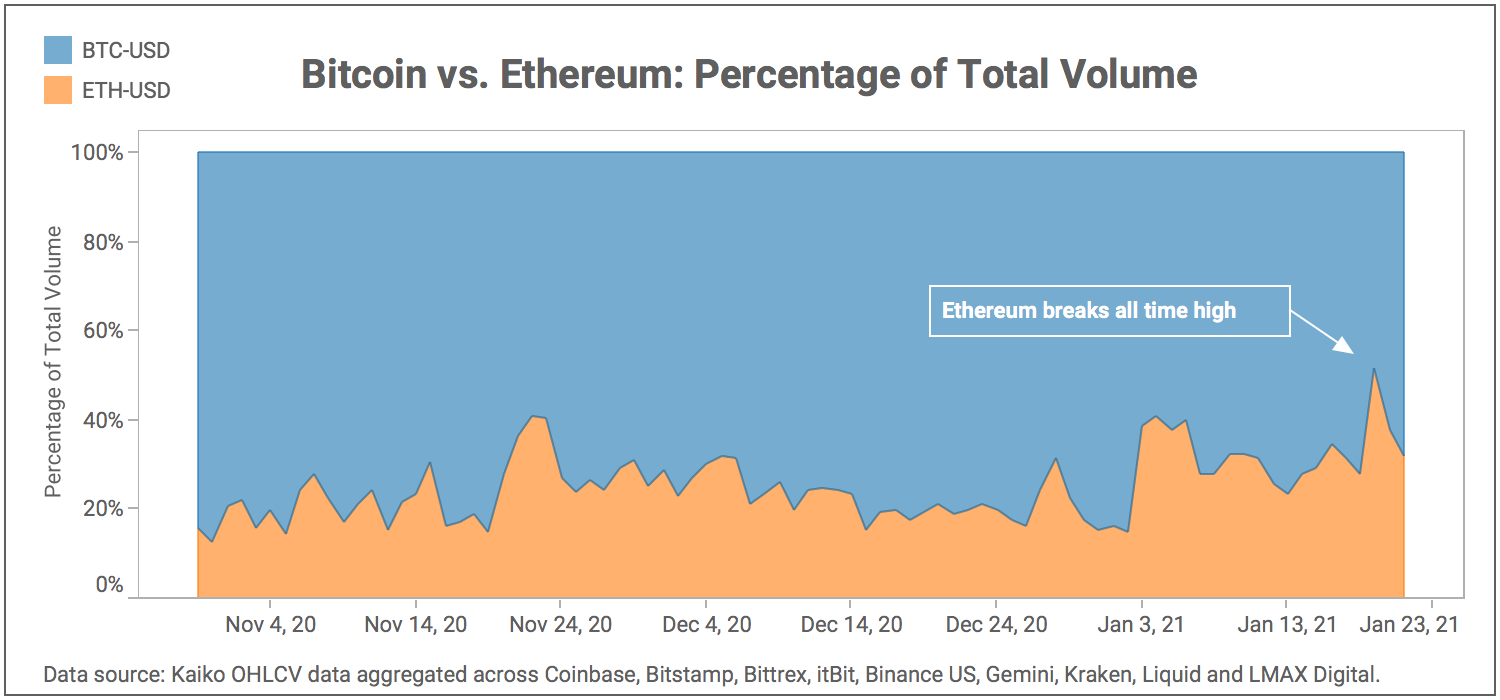
On January 19th, ETH reached a new All Time High above $1400, a historic milestone that saw traders temporarily rotate funds into the second largest crypto-asset by market cap. BTC-USD typically commands approximately 70% of total volume compared with ETH-USD. ETH-USD volume has only crossed the 50% threshold a handful of times since 2017, and one of those days was January 19th, which saw volumes amount to 51.49% of the total.
Bitcoin's volume dominance fluctuates depending on the price movements of altcoins, and traders chasing returns will often temporarily rotate funds out of Bitcoin. However, after a price movement ends, we can observe a return to the norm.
Ethereum volatility is consistently higher than Bitcoin's
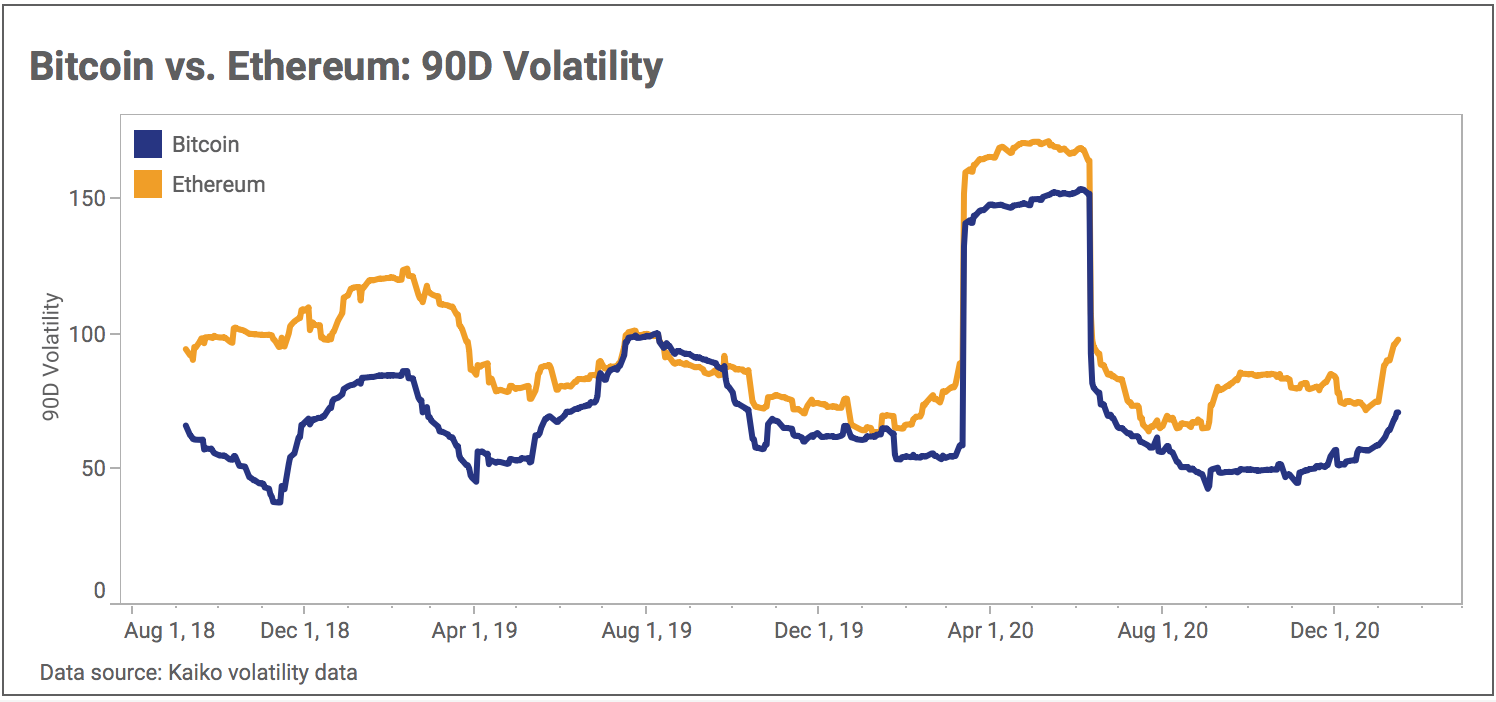
Although BTC is famous for its price swings, ETH is actually the more volatile of the two. Since 2018, Ethereum's 90 day volatility curve has almost always hovered well-above Bitcoin's. Volatility for both assets has climbed since December, but is still well below the peak reached during the March market crash. Daily price volatility does not take into account intraday price swings, which is one reason why the measures appear lower than expected.


