
Inhalt
- 1 Rotation Analysis
- 2 Altcoin Futures Basis Analysis
- 3 Top Ten Comparison
- 4 Volatility and Correlation Comparison
- 5 ETHBTC 4h Technical Chart Analysis
- 6 Market Cap Overview
- Glossary
1. Rotation Analysis
An impressive bull run
We saw an impressive bull run within 48 hours. At the beginning of the week, BTC was steadily trading higher towards the 7,500 resistance until it then accelerated towards an important resistance between 9,200 and 9,300. BTC moved up 2,000 points, and is currently clearly dominating the field.
No major news were reported that could be responsible for this run. Things are more or less in a neutral state with the potential for positive news.
There is a worldwide race to develop a vaccine against Covid-19. Claims have already been made that it will be ready soon: at the end of 2020, at the latest.
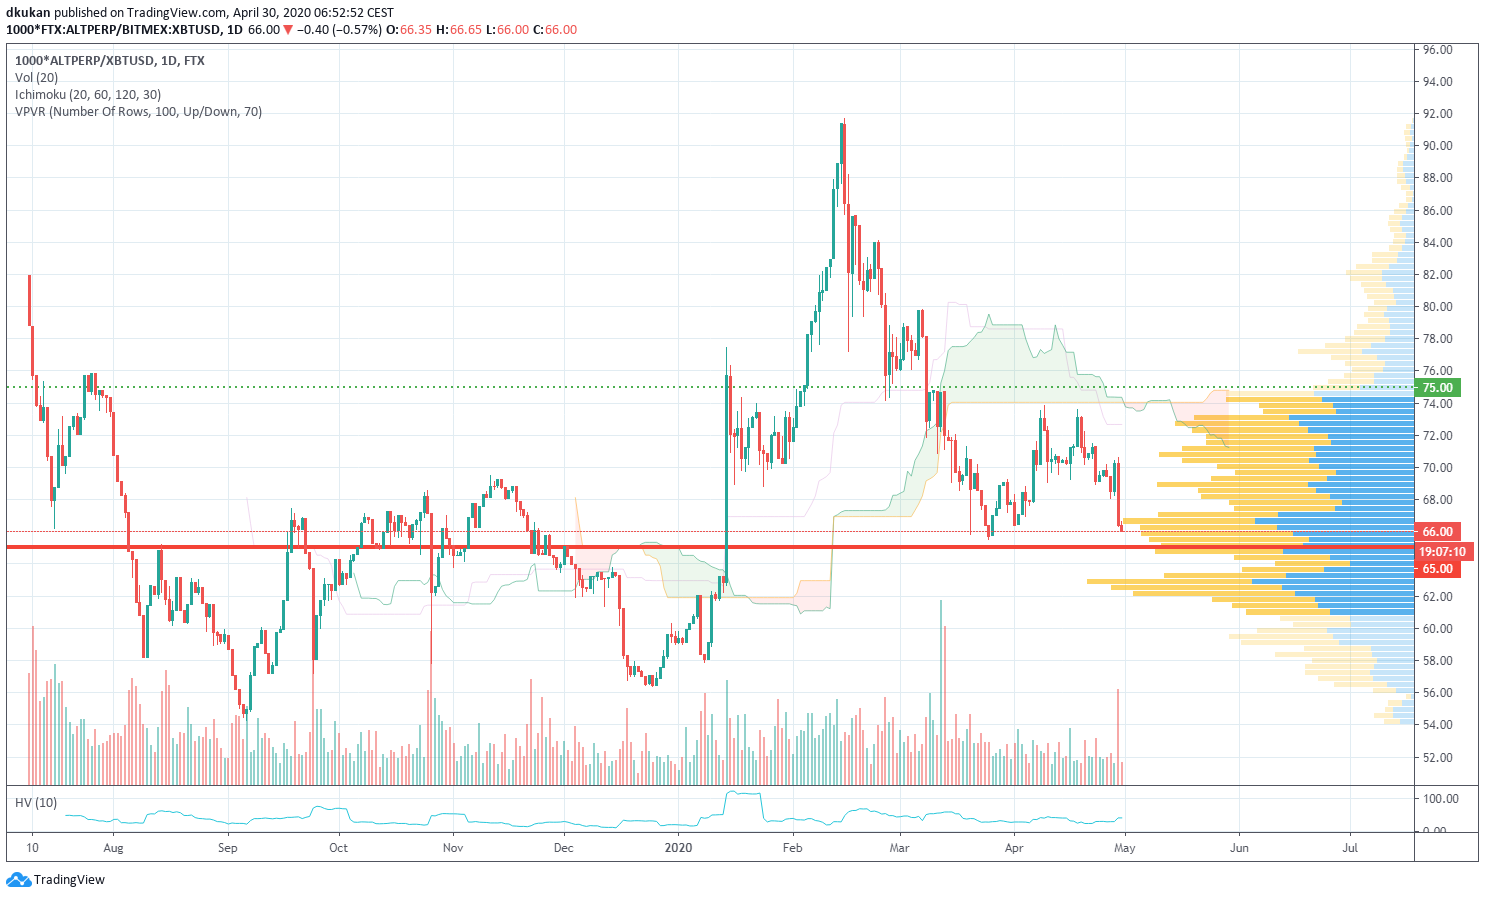
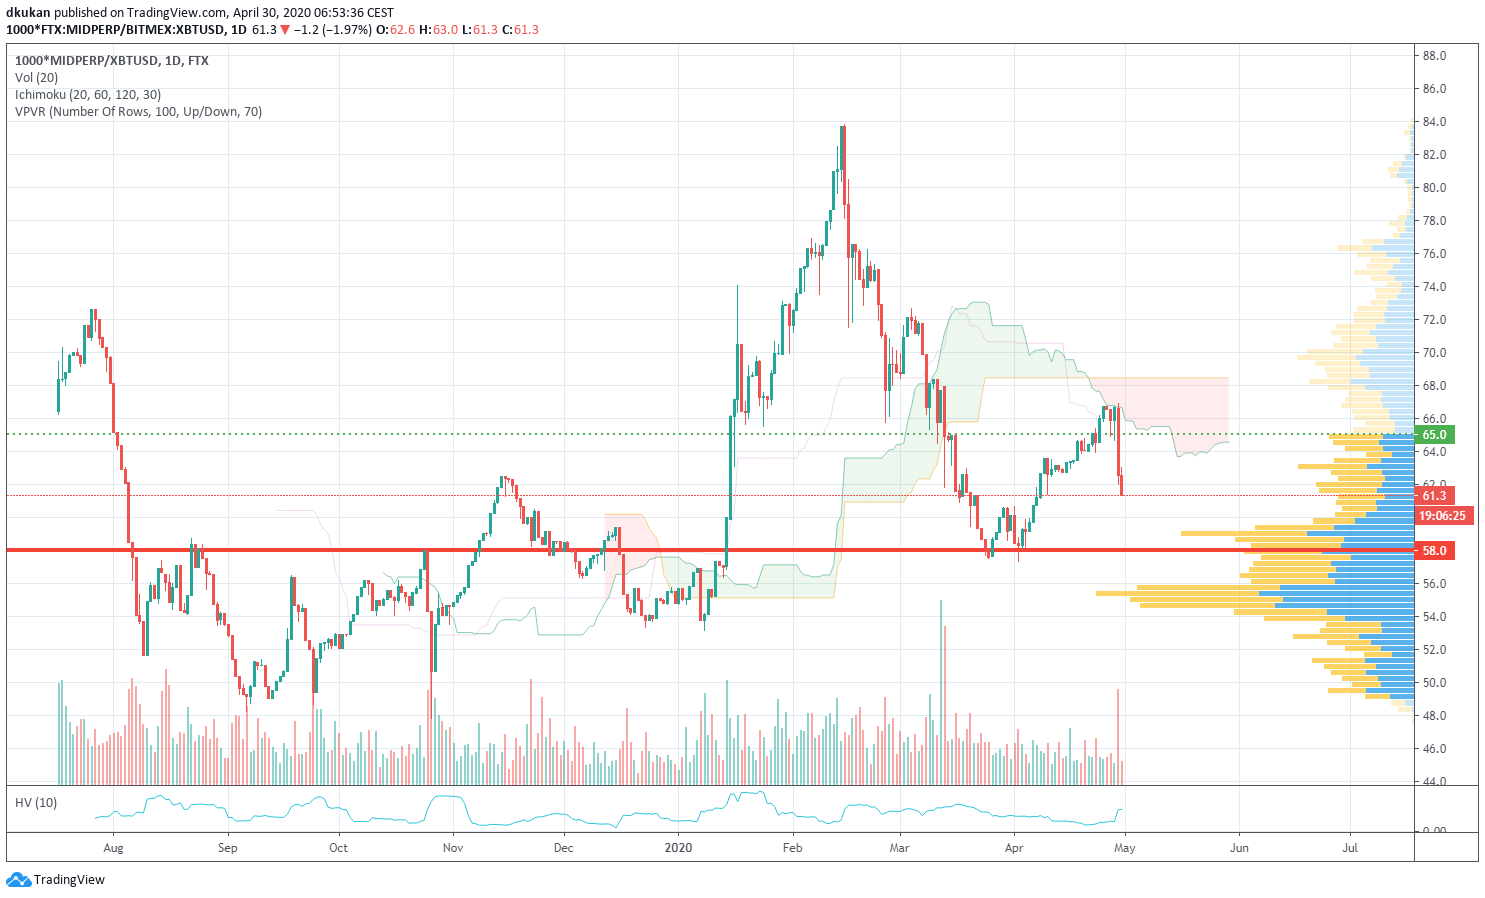
In the charts below, you can see the technical analysis for the Alt/Mid/Shit Indices. Attached you will also find our short-term view on support and resistance levels for all three indices:
Alt: Support 65.00 / Resistance 75.00 / Alt (4h)
Mid: Support 58.00 / Resistance 65.00 / Mid (4h)
Shit: Support 69.50 / Resistance 78.00 / Shit (4h)
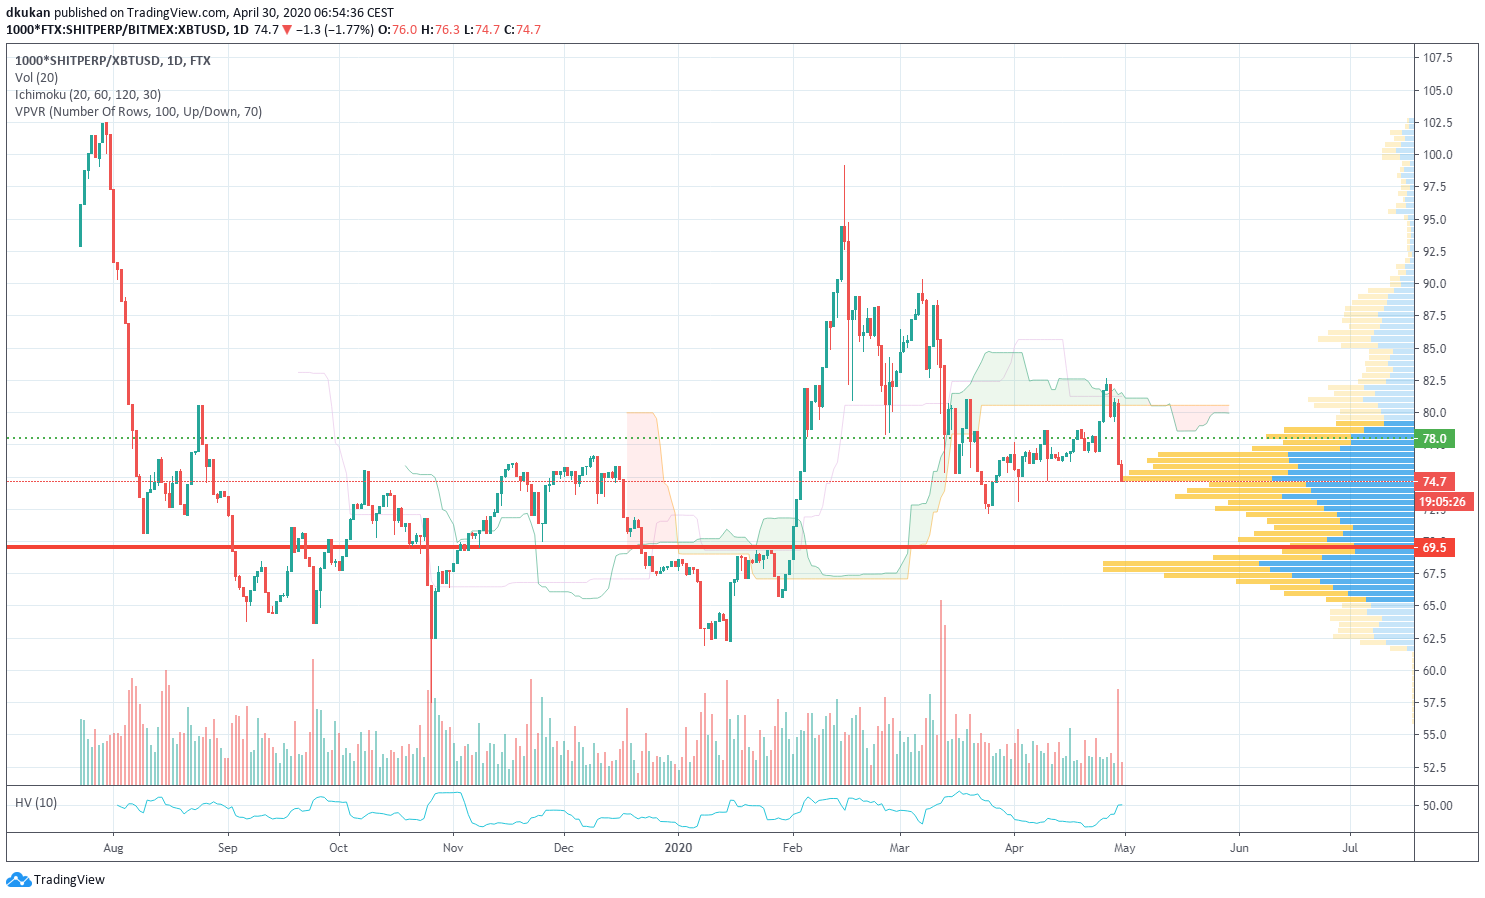
All three indices underperformed BTC and are still trading within the support and resistance bandwidth.
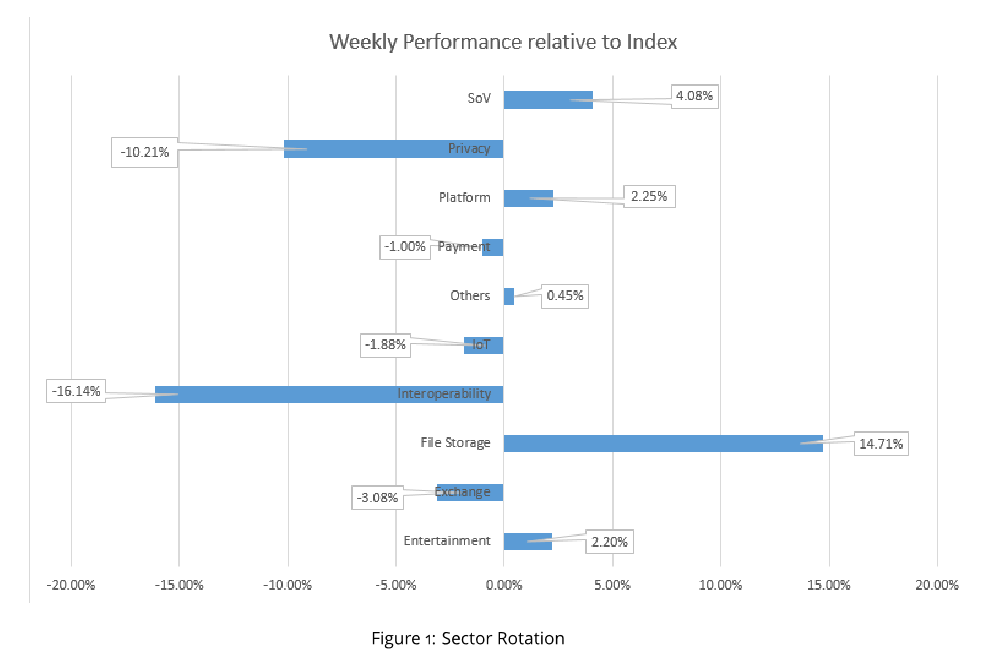
The outperforming sectors are File Storage, Store of Value, and Platform. The losing sectors are Interoperability and Privacy. All other sectors performed alongside the index.
The best performing coins were DGB with a plus of 72%, SC with 56%, and ADA with 43%. The worst performing coins were ATOM with minus 15% and NPXS with minus 10%.
The rest of the coin universe we cover performed between 15% and 30%.
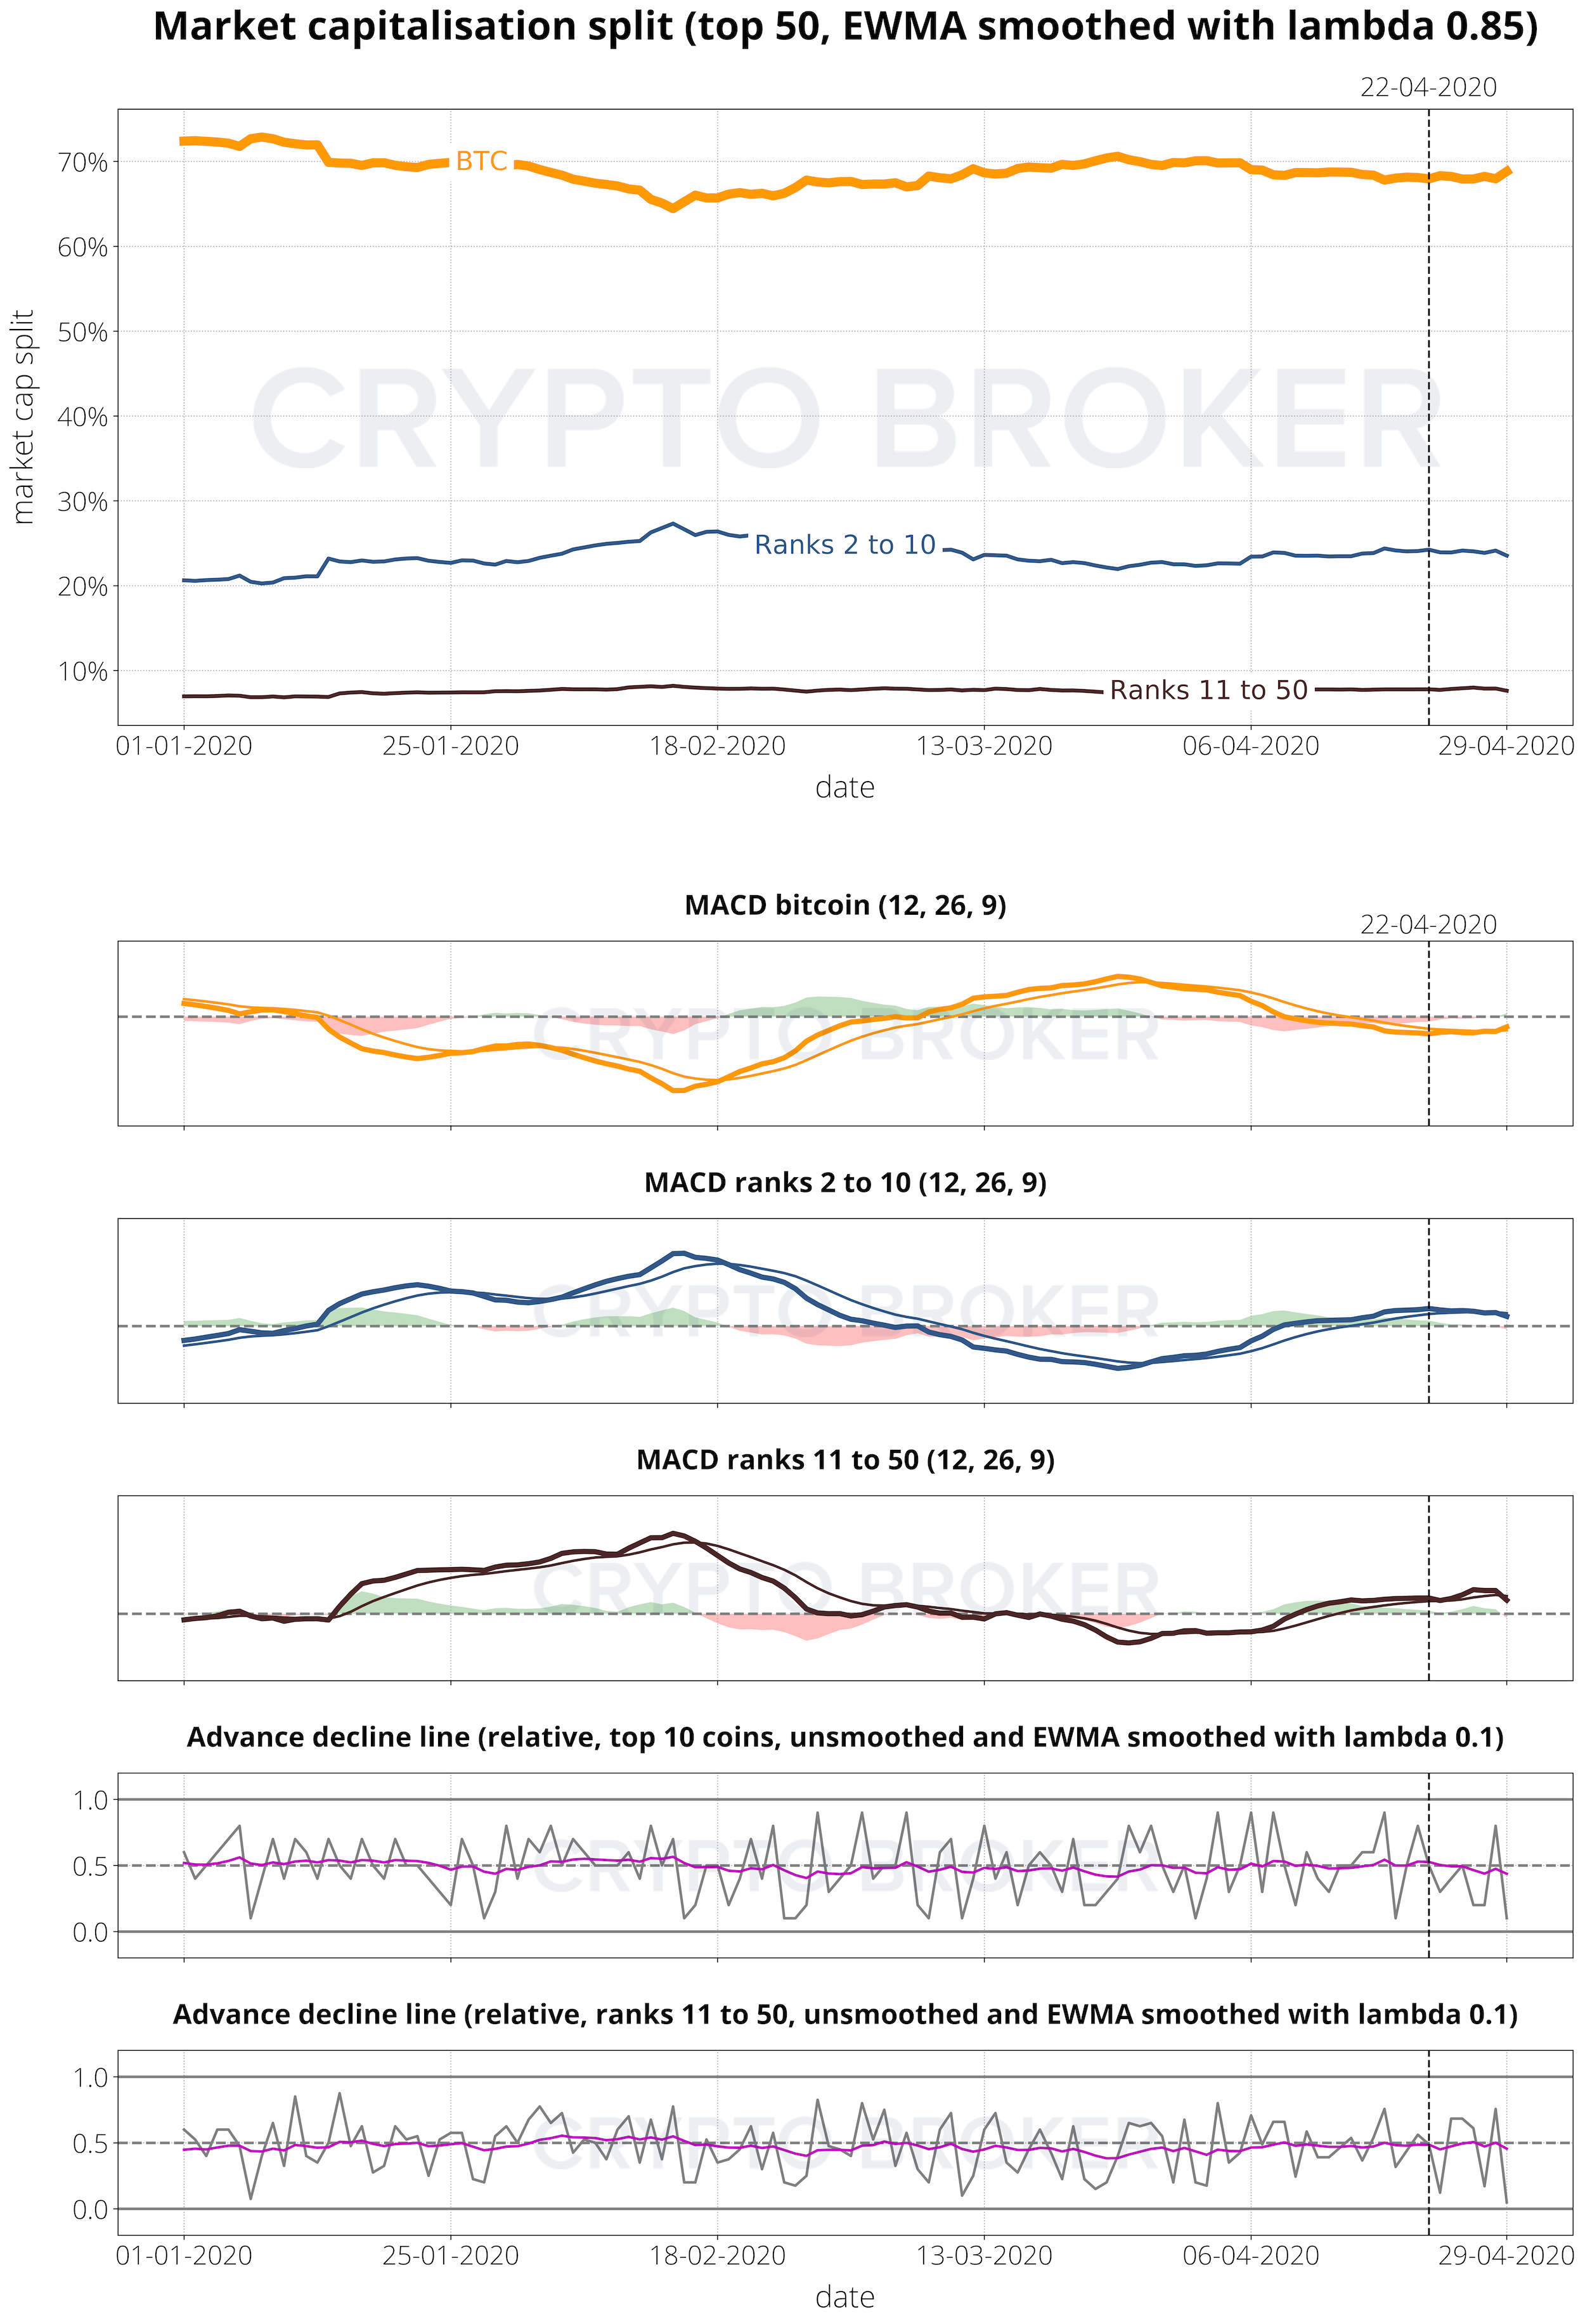
MACDs for BTC are still in the neutral zone. Coins between 2 and 50 remain neutral, but moved slightly into the overbought zone. Overall, the MACDs still indicate a neutral scenario.
BTC halving is in less than two weeks.
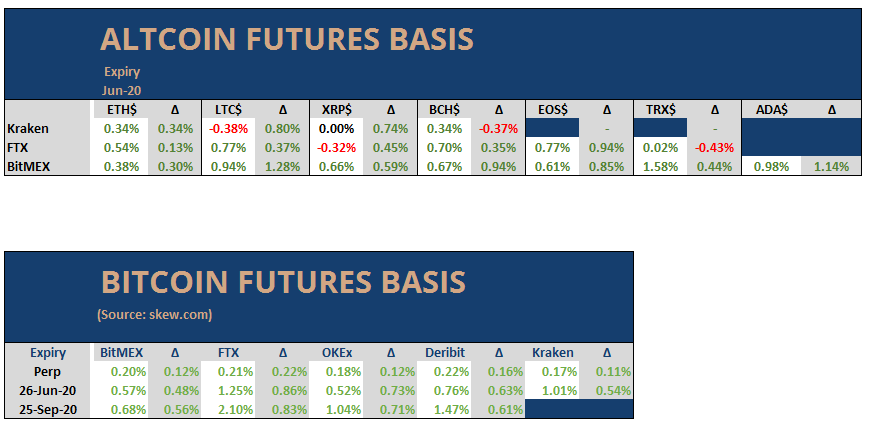
2 Altcoin Futures Basis Analysis
Futures basis trading changed within 24 hours. In general, all futures are trading in contango right now. The BTC June futures basis is trading with a 1% premium, and the September futures basis with a 2% premium, depending on the exchange. Altcoin futures followed the move, and are trading neutral or with a slight premium. The overnight funding rate increased to almost 10bps.
Implied volatility increased mainly in the front end, and is the highest for both volatility term structures in BTC and ETH. BTC at the money volatility for one, three, and six months is trading at around 80%. ETH at the money volatility for one, three, and six months is trading around 100%.
The overall traded volume for BTC and ETH increased massively on all exchanges. Liquidations of positions increased steadily over the past few trading days. Open interest in derivatives is moving higher as well.
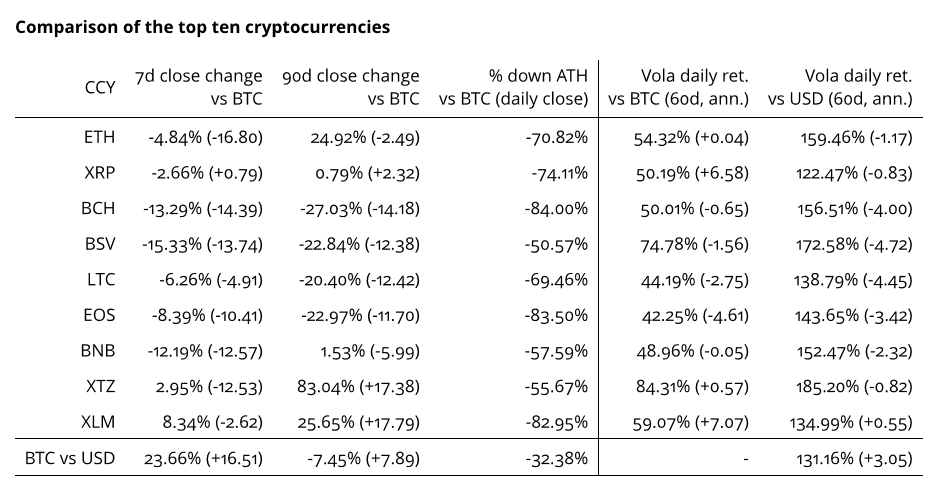
3 Top Ten Comparison
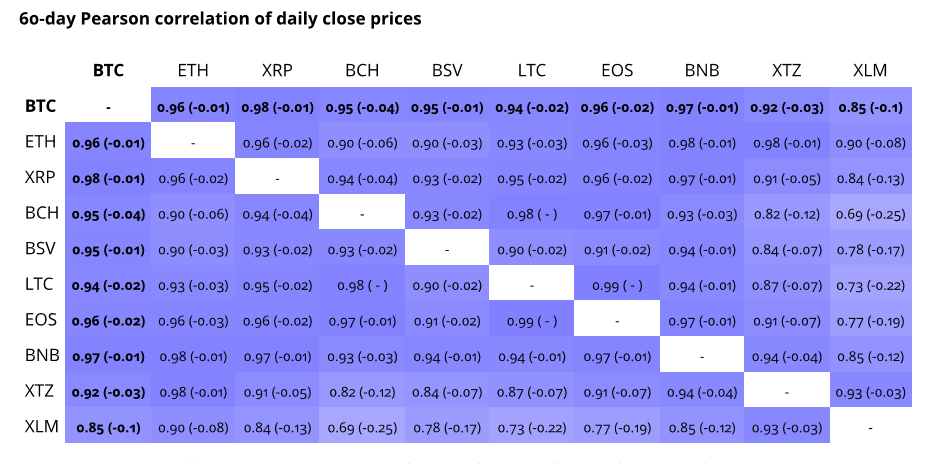
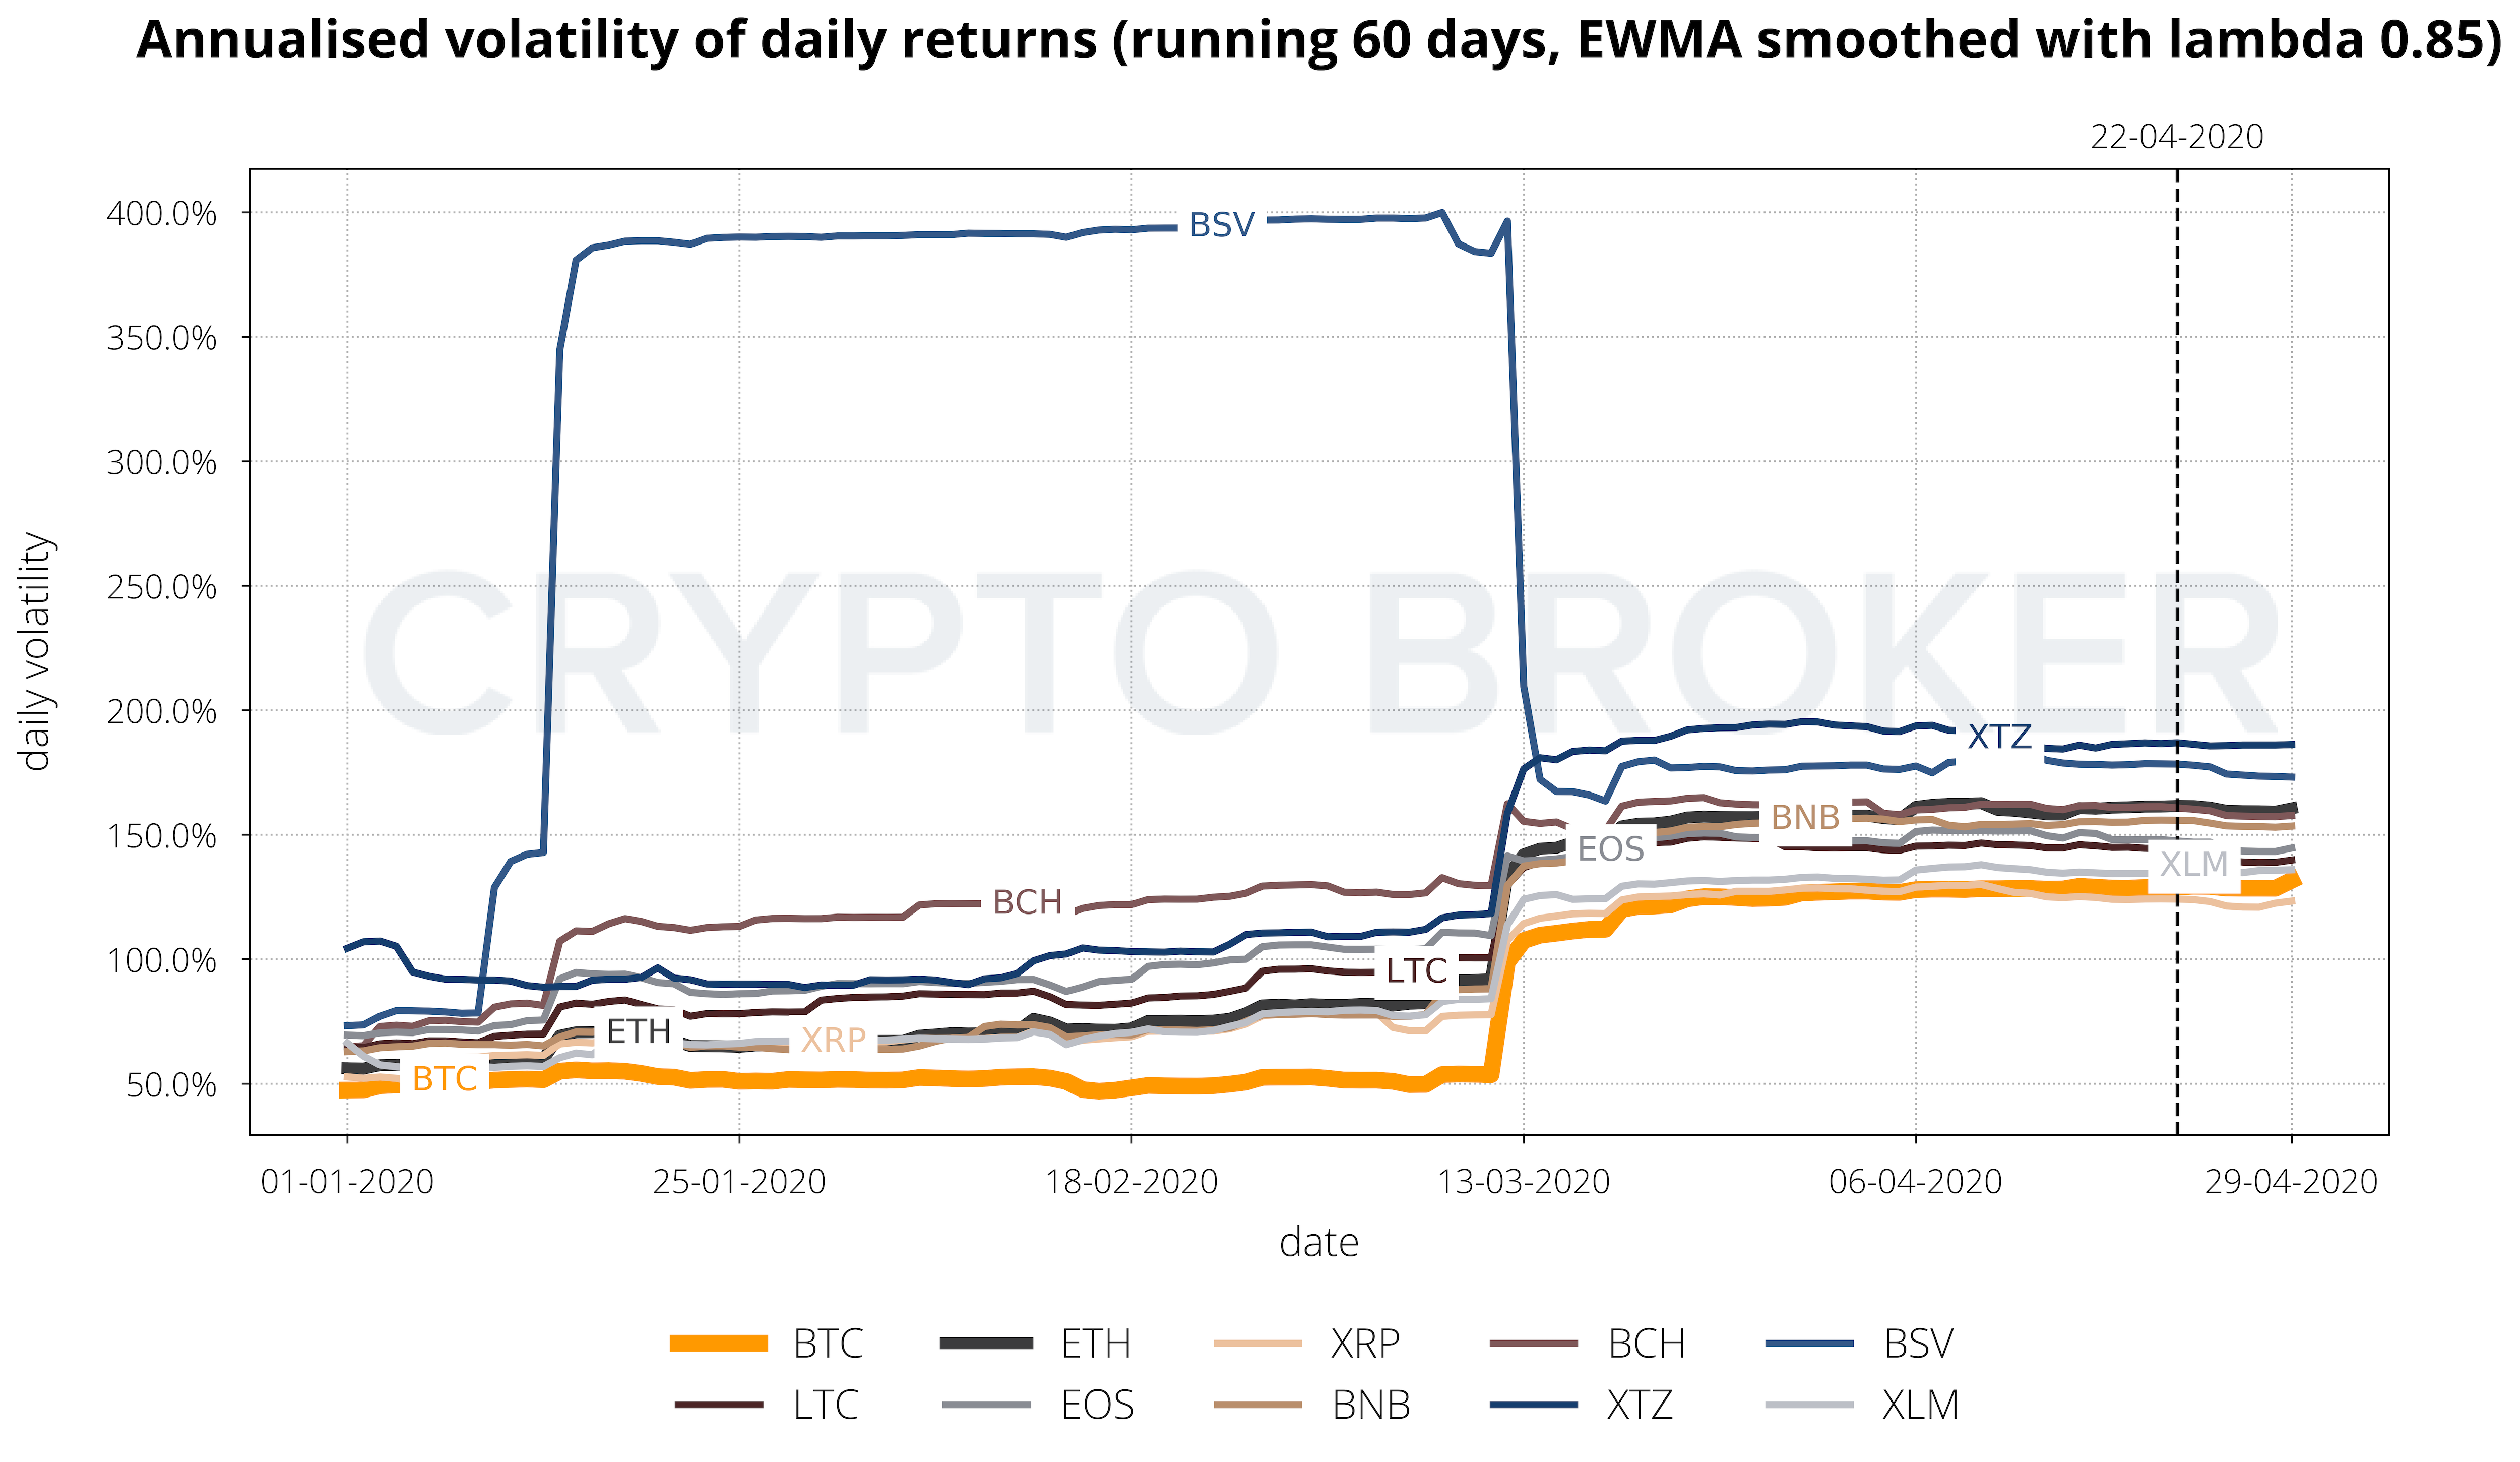
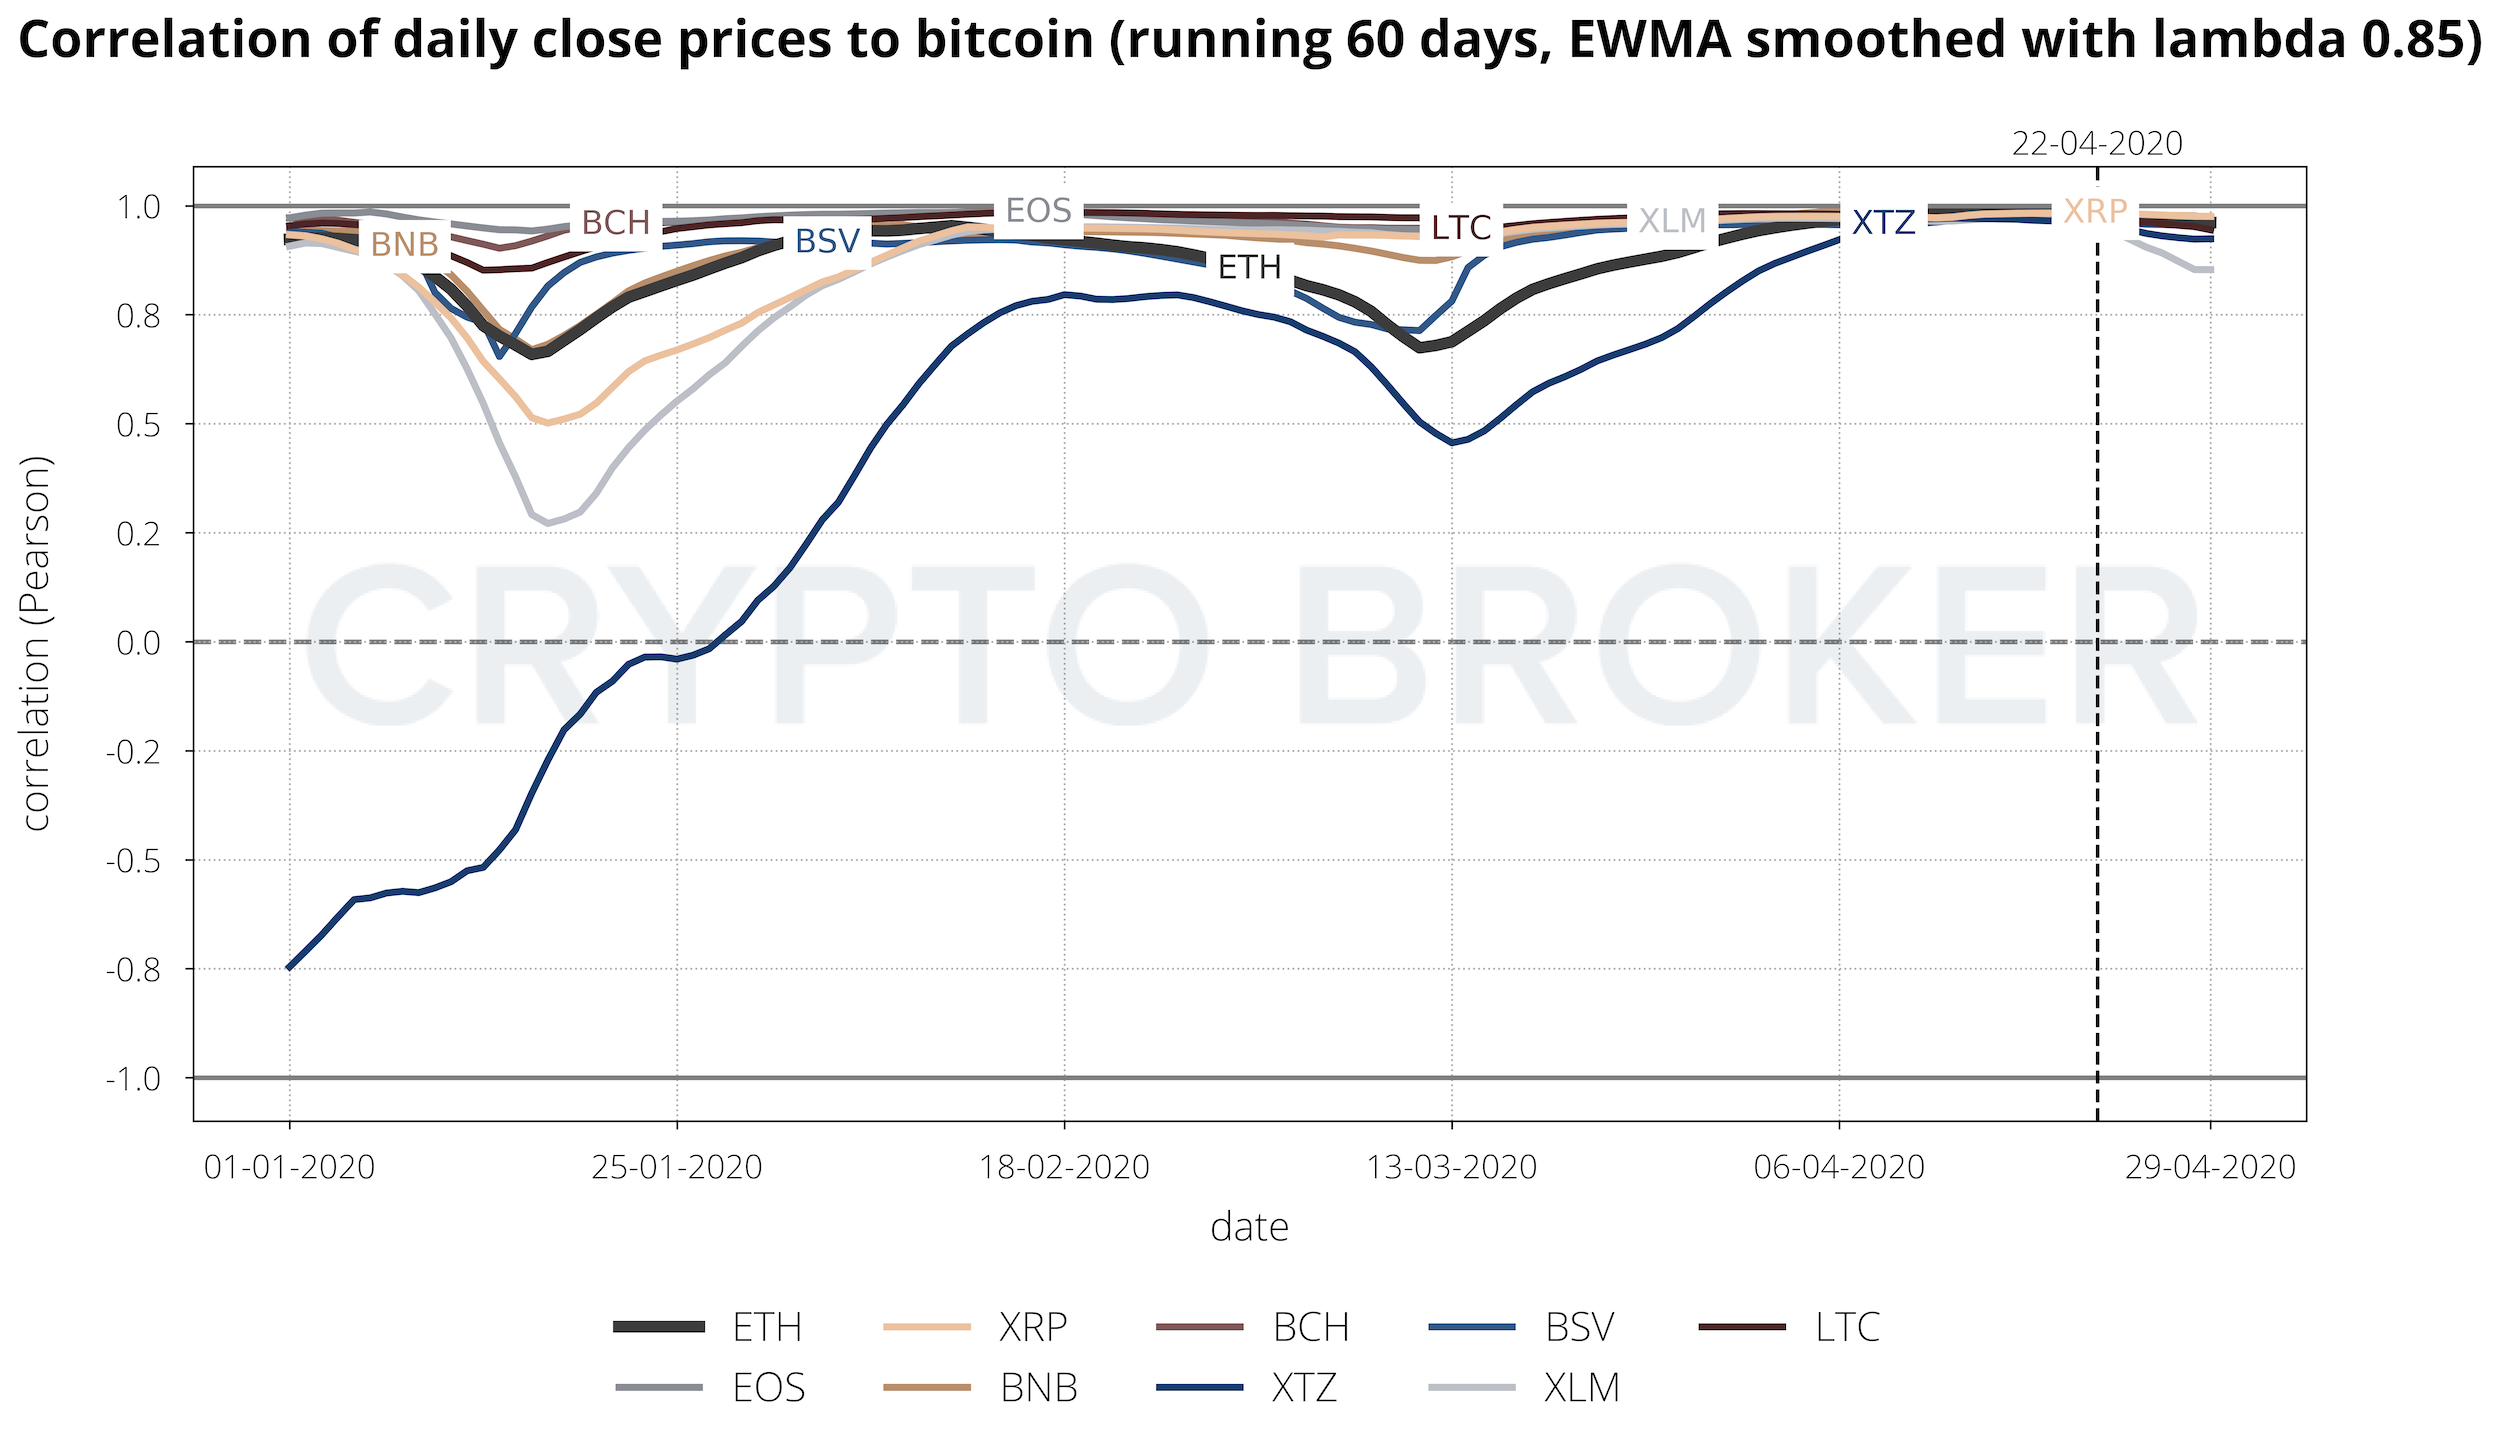
4 Volatility and Correlation Comparison
5 ETHBTC 4h Technical Chart Analysis
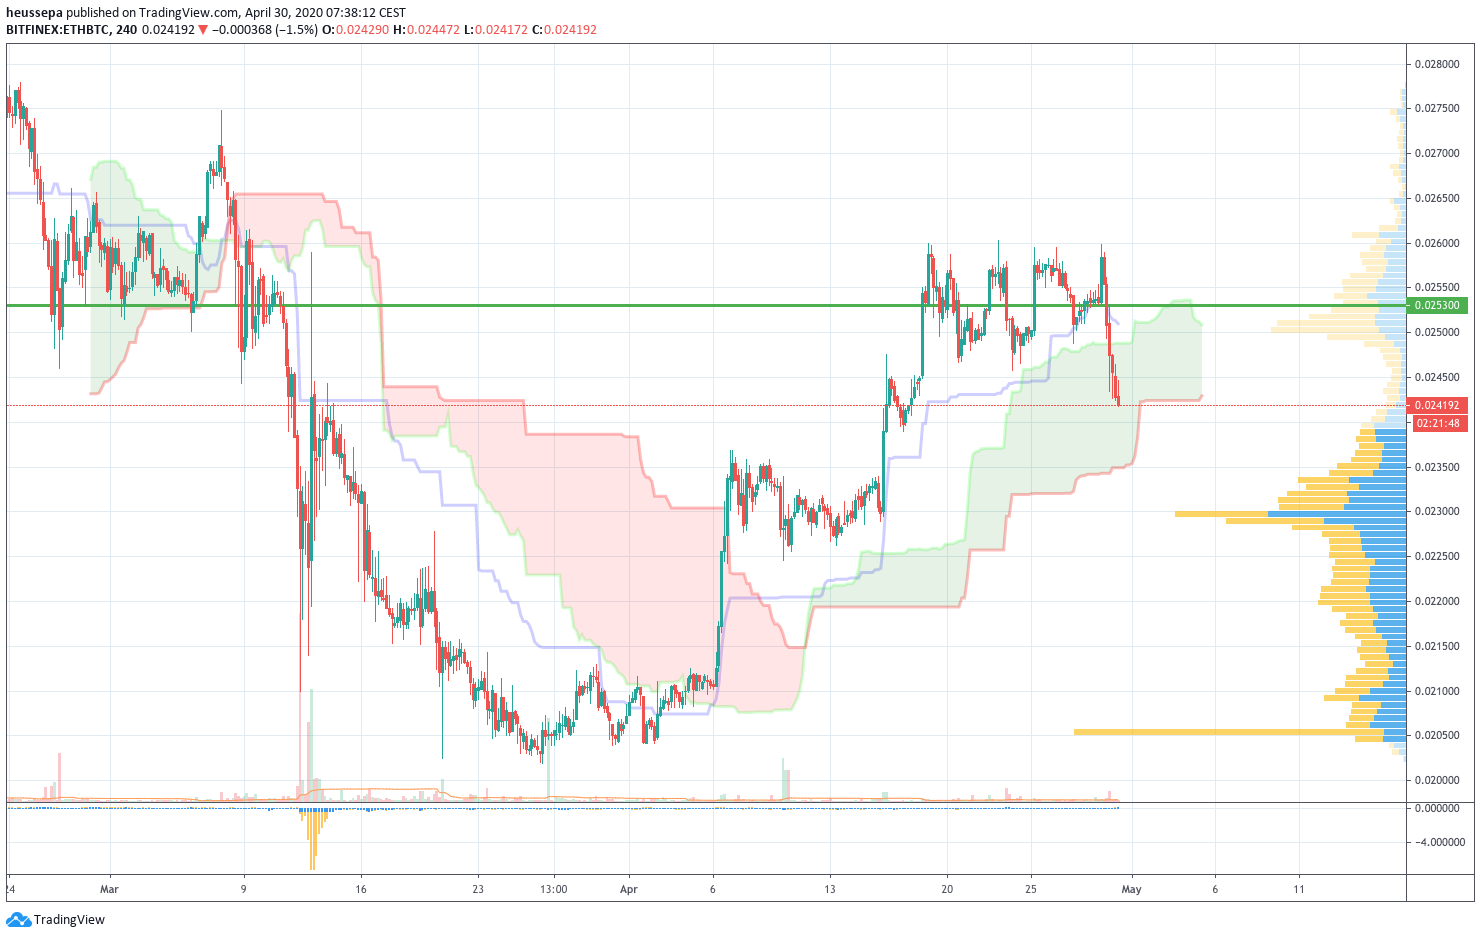
And I'm out of the trade...
The stop was triggered and we seem to have lost the battle against the 0.0260 resistance (for the time being). Over the past 24 hours, bitcoin showed everyone who is king on the block. Pretty much every imporant coin lost against bitcoin. It was no different for ETH.
Two things I will keep a close eye on regarding ETHBTC:
1) Is the price level able to stay within the Ichimoku cloud?
2) What will the margin longs do on Bitfinex (we have talked about the fact that roughly 1 million ETH margin longs have been building up over the past few weeks)?
Currently, we are in the neutral zone. The price is within the Ichimoku cloud, and the margin long positions have barely changed. In our experience, when BTC moves like this, it generates like a vacuum and sucks out all the liquidity from the other cryptocurrencies. If BTC gives us some time to breathe and consolidates for a few days (or weeks), there is a good chance that we will see a follow-through rally in the altcoin space.
View the charts: ETHBTC 4h & ETHBTC daily
6 Market Cap Overview
Glossary
Advance Decline Line - the Advance Decline Line shows the ratio of coins for which the market cap increased relative to the market cap of BTC for each day.
ATH - all time high (maximum lookback period of 730€ days).
Data Source - tables and charts are based on daily close prices provided by Coinmarketcap.
EWMA - exponentially weighted moving average.
MACD - moving average convergence/divergence is a popular technical indicator to identify trends in the underlying instrument. It consists of the MACD and signal line, and the area shown in the background. The MACD line (strong) is the difference of two exponential moving averages, which are defined by the first and second parameter of the indicator. The signal line (weak) is the exponential moving average of the MACD line defined by the third parameter. The area in the background illustrates the difference between the MACD line and the signal line.
Pearson Correlation - quantifies the linear relationship between two variables.
Spearman Correlation - quantifies the monotonic relationship between two variables. As such, the Spearman Correlation is based on the ranked values of each variable and is used to detect non-linear relationships between the two.
About the author
Wenn er nicht an den Crypto Broker Trading Desk gefesselt ist - mit 24/7 Trading verfügbar für unsere Kunden - liefert Patrick Heusser aktuelle Kommentare zu den aufstrebenden Crypto Märkten, sowohl für unsere Kunden als auch für die Finanzpresse. Bevor er zu Crypto Broker stiess war Patrick als Zinshändler bei der UBS tätig und hatte verschiedene Positionen in der IRCC (Interest Rate, Commodity, and Currency) Trading Division in London, New York, Singapur und Zürich inne. Patrick ist Experte für Trading und Risikomanagement und verfügt über Erfahrung in der Führung von Startup Projekten.
Related Articles


