
A summarizing review of what has been happening at the crypto markets of the past week. A look at trending sectors, liquidity, volatility, spreads and more. The weekly report in cooperation with market data provider Kaiko.
The last 7 days in the cryptomarkets:
- Price Movements: Immense selling pressure contributed to ETH's flash crash on Kraken.
- Trading Volume: Last week's sell-off resulted in the second highest daily volumes ever recorded.
- Order Book Liquidity: Rising bid depth for BTC-USD markets suggests traders predict a continuing downtrend.
- Volatility and Correlations: Optimism for the U.S. economy could be a bearish signal for crypto.
Price crash shakes markets

A lot has changed over the past year, but last week's market-wide price crash was a stark reminder that crypto has a long way to go before reaching maturity. For one, markets are still highly-leveraged, which makes the magnitude of price crashes extreme and unpredictable. Last week saw the highest volume of futures liquidations ever, more so than even last March's Black Thursday market spiral. The good news, though, is that there is increasing evidence that overall market liquidity has improved, with spreads and market depth recovering more quickly following extreme volatility than one year ago.
Analyzing the Kraken flash crash
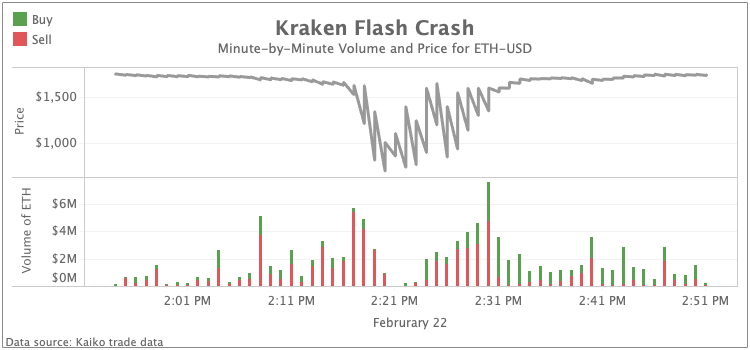
Last week, Ethereum's price on Kraken underwent a sudden 50% crash, falling well below market price. Kraken's CEO says the crash was linked to selling pressure, not a glitch in the system, so we decided to analyze tick-by-tick trade data to explore the cause of this crash. In the one hour proceeding the flash crash, a vast majority of all trades executed were sell orders.
In the chart above, we can observe the minute-by-minute breakdown in volume, and corresponding average price on Kraken. Of the approximately 10'000 trades made in the hour proceeding the crash, 7'600 were sell orders accounting for approximately 75% of the total volume traded. The immense selling pressure depleted order book depth on the bid side, resulting in ETH's downward spiral to $700, well below the market price of $1'600.
By looking at the data, we can confirm that the crash was likely linked to selling pressure, but the bigger question is who was the seller? The flash crash would have resulted in huge amounts of price slippage for whoever was executing these sell orders, resulting in unfavorable fills well below market value that no rational trader would make. Ultimately, the data does not rule out an issue on Kraken's end.
Volumes surge during a price crash
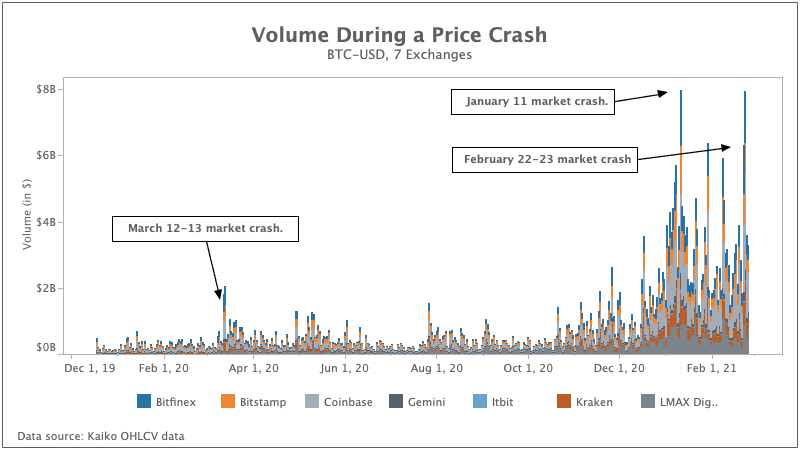
At the time, March's Black Thursday price crash saw the highest daily volume executed over the past year, topping $2 billion across seven of the most liquid BTC-USD pairs. Since the start of the latest bull run, volumes have surged and are now magnitudes greater than the 2020 daily average. The most recent price crash saw volumes upwards of $8 billion, one of the highest daily volumes ever (second only to the January 11 price crash), which demonstrates the immense growth of markets over the past year.
Economic conditions could be bearish for crypto
The biggest story in financial markets over the past week has been the rising yields on U.S. treasury bonds, likely in response to fears over inflation. Rising yields suggest that traders predict tighter fiscal policy may be on the horizon as the economy recovers faster than expected, which is a bearish sign for equities. Over the past year, equities have benefitted heavily from aggressive fiscal and monetary policy, with markets reaching all time highs despite dismal economic growth. Any change to these policies have been interpreted as bearish, despite the good news that the economy seems on track for a V-shaped recovery.
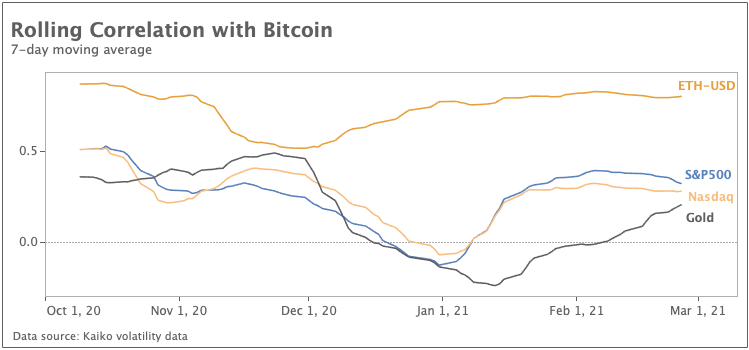
Both crypto, equities, and gold suffered heavily last week as traders de-risked across markets. Bitcoin's correlation with equities has plateaued over the past month, but its correlation with gold has risen steadily into positive territory.


