
Content
- 1 Rotation Analysis
- 2 Altcoin Futures Basis Analysis
- 3 Top Ten Comparison
- 4 Volatility and Correlation Comparison
- 5 ETHBTC 4h Technical Chart Analysis
- 6 Market Cap Overview
- Glossary
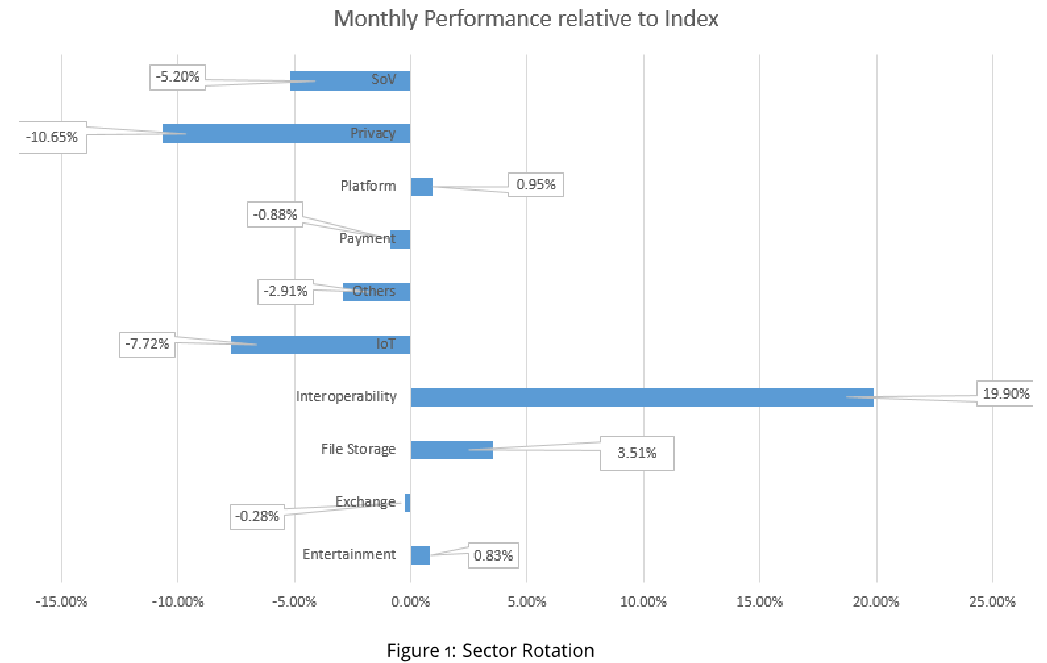
1. Rotation Analysis
New Rotation Report Frequency
We mentioned our report revamp last month. For starters, we will now be issuing our report monthly instead of weekly. We also want to go "back to the roots" of the original idea behind the report. We will start focusing more on crypto/crypto flows again as well as on the sentiment in the market. New to the report will be links and overlapping content and additional information, making our two reports (Rotation Report and Sector Analysis) complement each other.
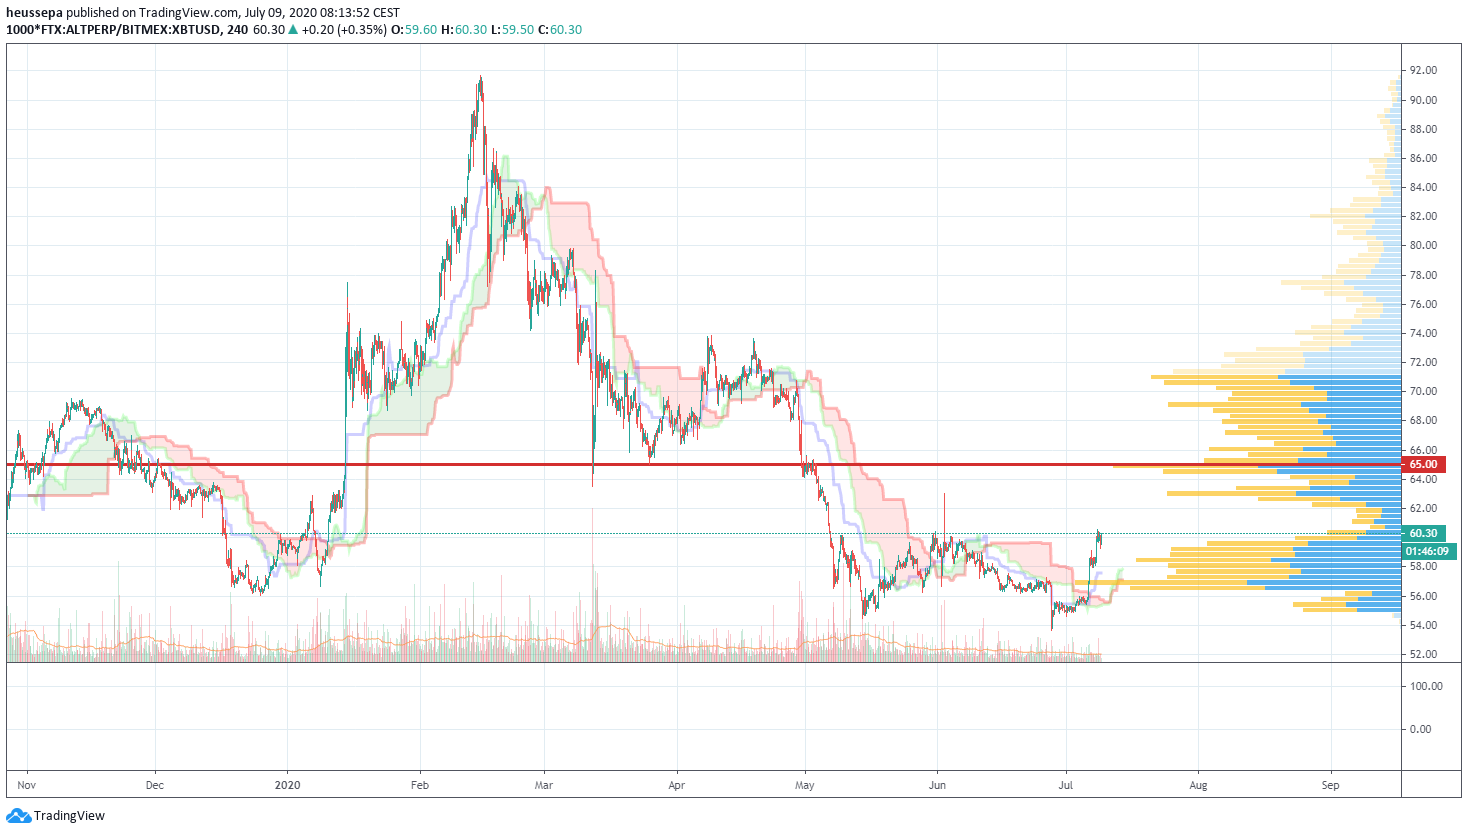
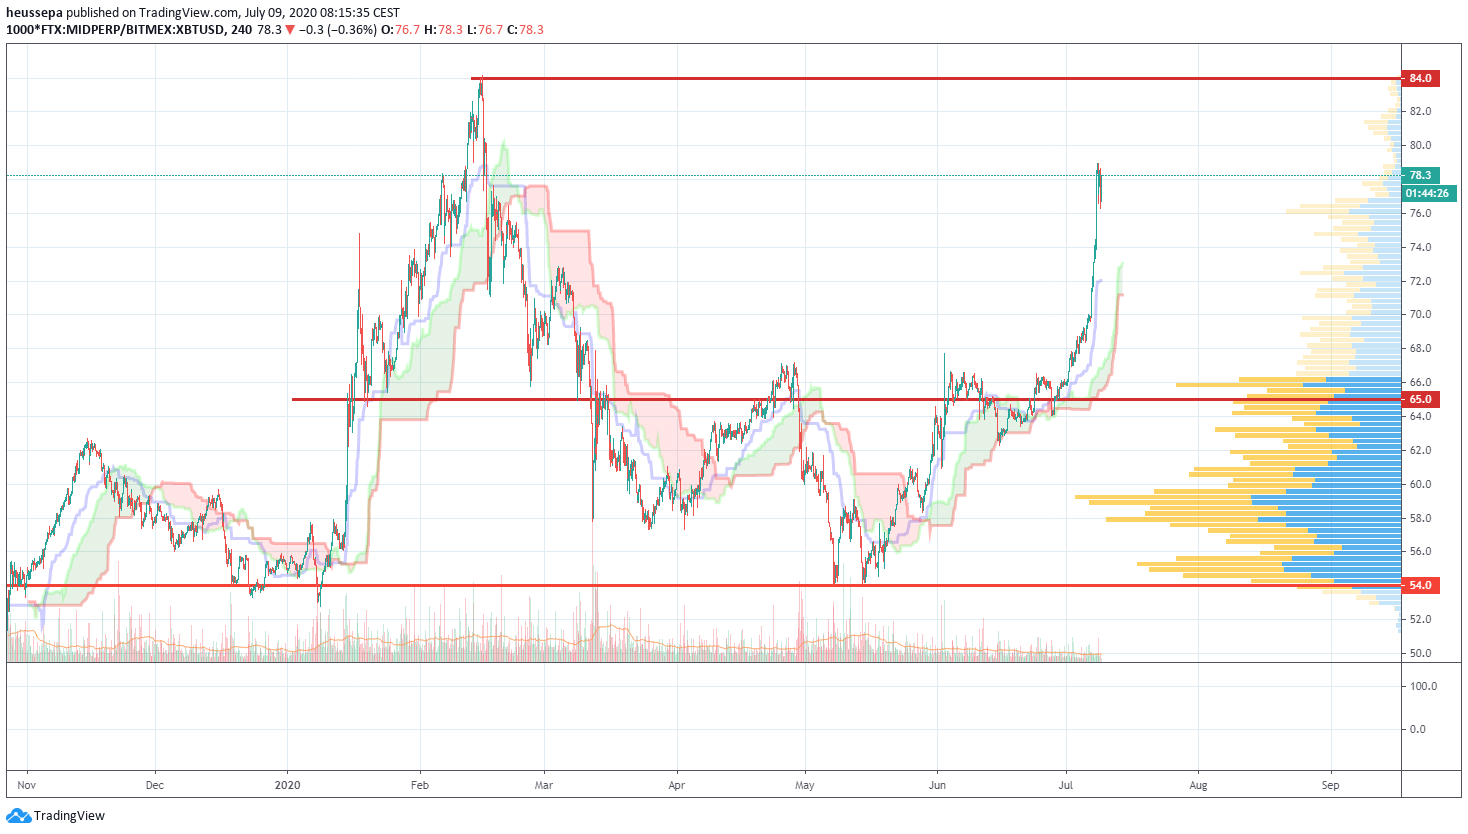
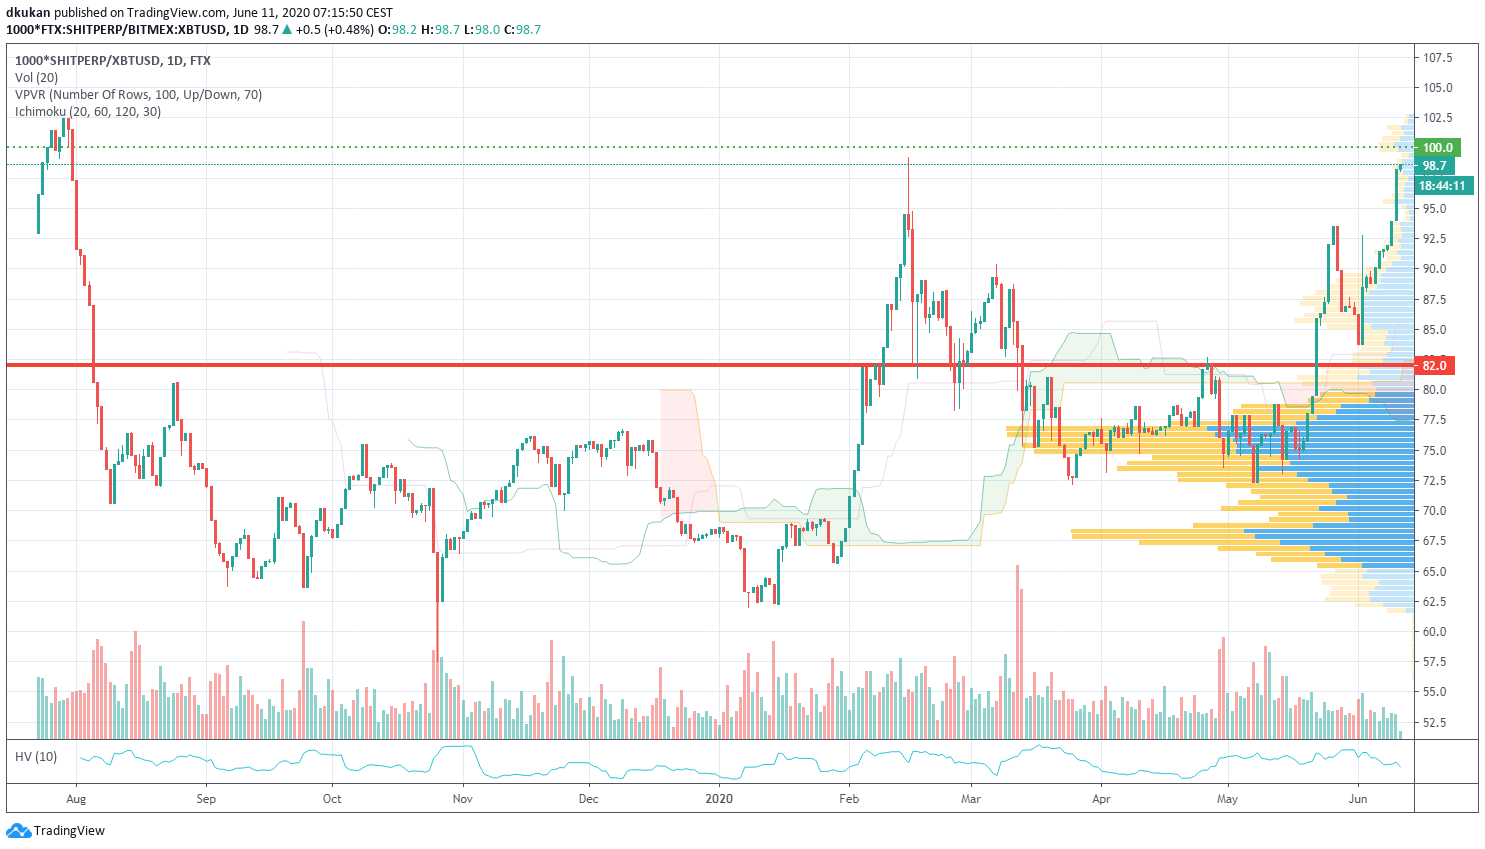
The big cap coins did not perform as well as the smaller cap coins. This can be seen quite clearly on the Alt vs BTC chart (please see below). We have not yet managed to push towards the 65 resistance level. The Mid Index started a parabolic rally after we took out the 65 resistance level. Obviously, quite a few of those "hot" DeFi coins are in this index. The next resistance is 84, and the way these coins are pushing, we might get there before our next report comes out. The Shit Index is marching on and is taking no prisoners. It took some time to push decisively through the 100 resistance level, but since then, we are again seeing another parabolic move.
Attached you will also find our short-term view on support and resistance levels for all three indices:
Alt: Support 57.00 / Resistance 65.00 / Alt (4h)
Mid: Support 58.00 / Resistance 65.00 / Mid (4h)
Shit: Support 82.00 / Resistance 100.00 / Shit (4h)
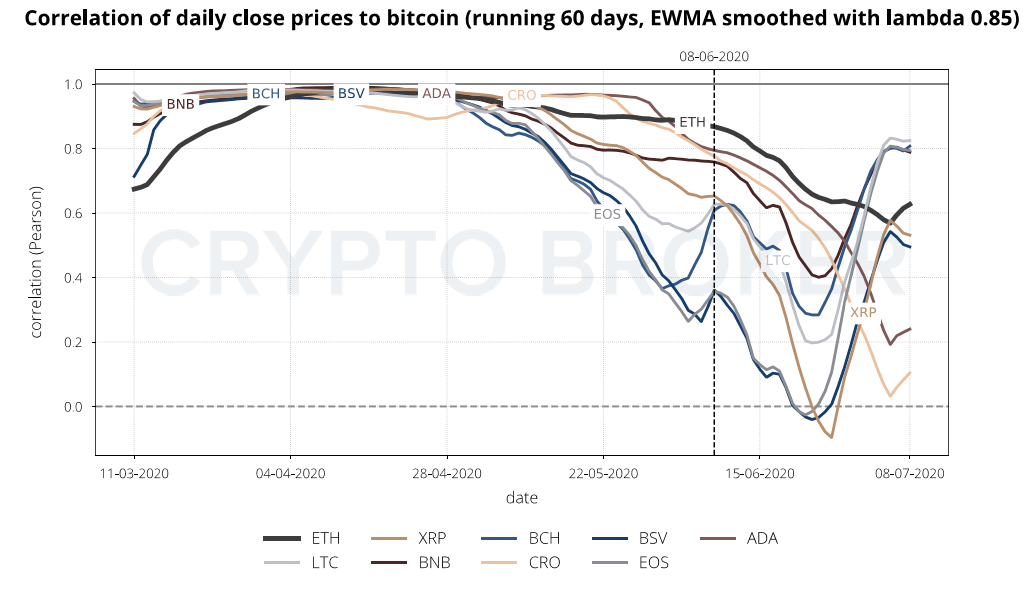
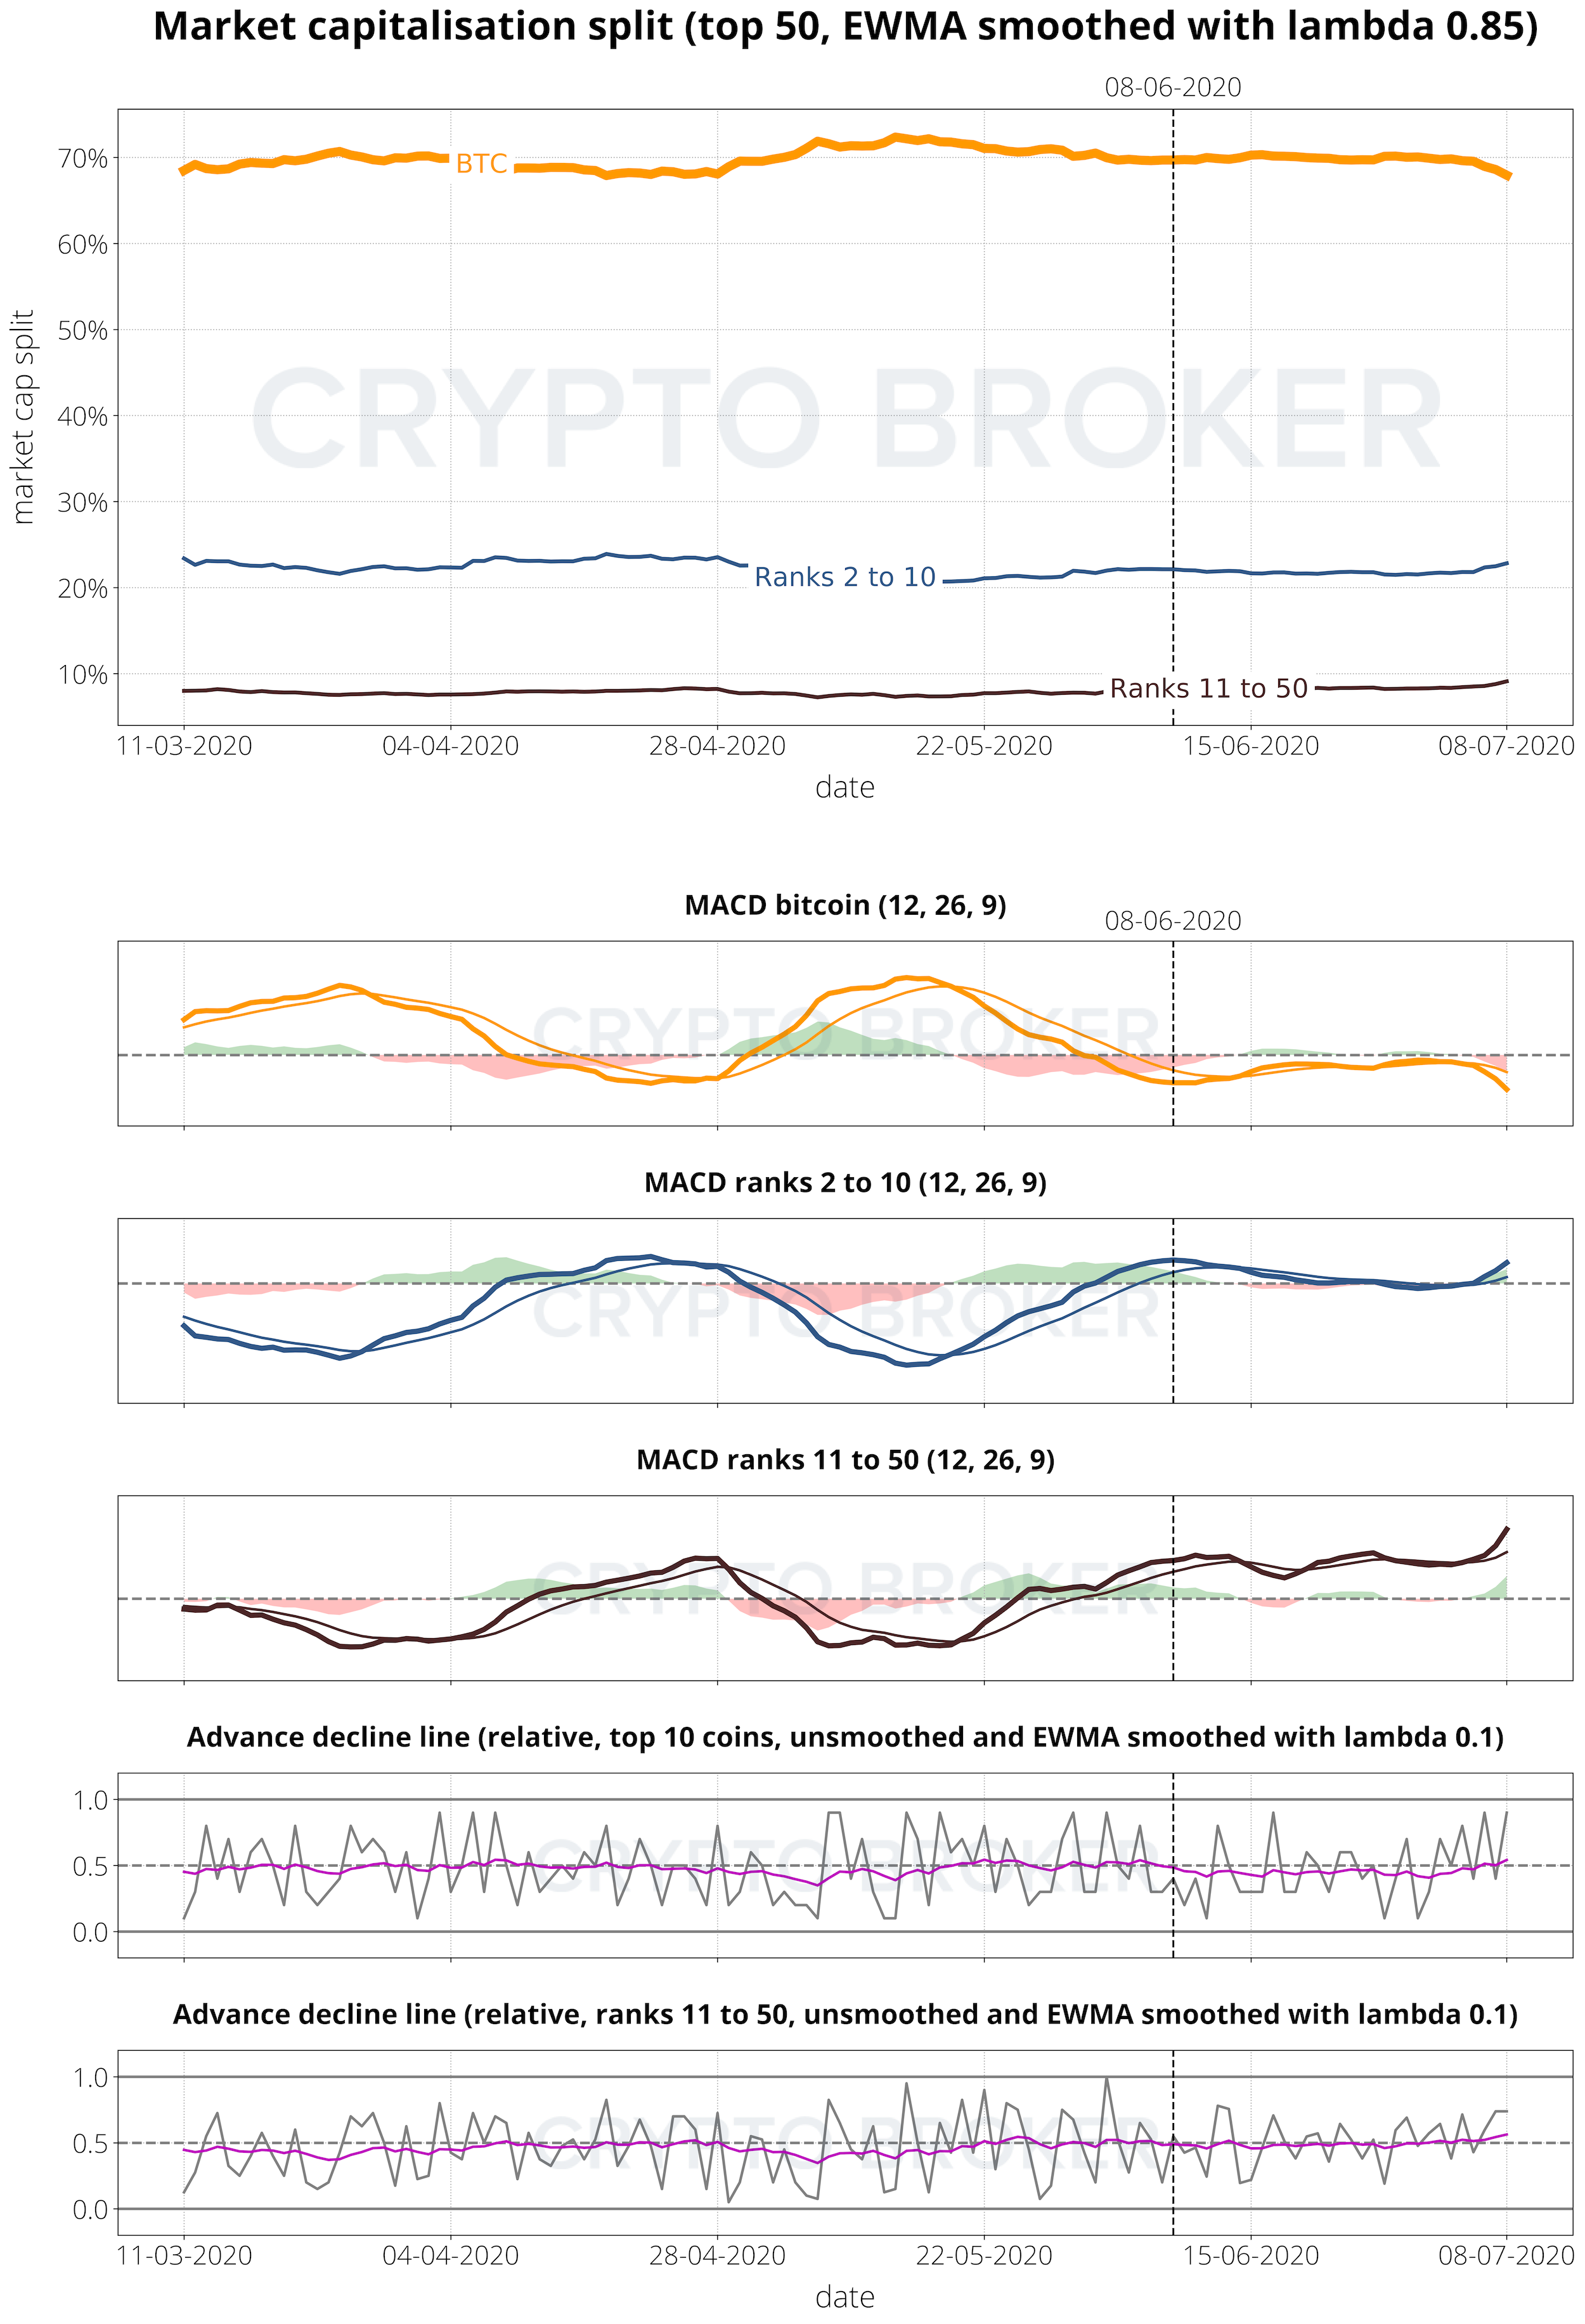
Now, let's take a look at some of the indicators that we have neglected for the past couple of weeks. Especially the correlation table and chart speak for themselves. This is what we want to see. When correlations start to widen there are more trading activities happening, which results in more volume. Correlations actually began moving out in the middle of May, but they really widened in the middle of June. Unfortunately, we are only covering the top 10 coins. I am pretty sure that correlations in the smaller cap coins must have gone crazy versus BTC. Something that we will start looking at are sector correlations versus BTC and USD (versus BTC in the Rotation Report and versus USD in the Sector Analysis). It helps to structure the overabundance of information and movements by looking at them bundled together. In terms of the MACD, we have been seeing BTC lose ground against altcoins since mid-May. The clear outperformers are smaller cap coins. The way the MACD is currently looking, we could see further gains in terms of altcoins versus BTC.
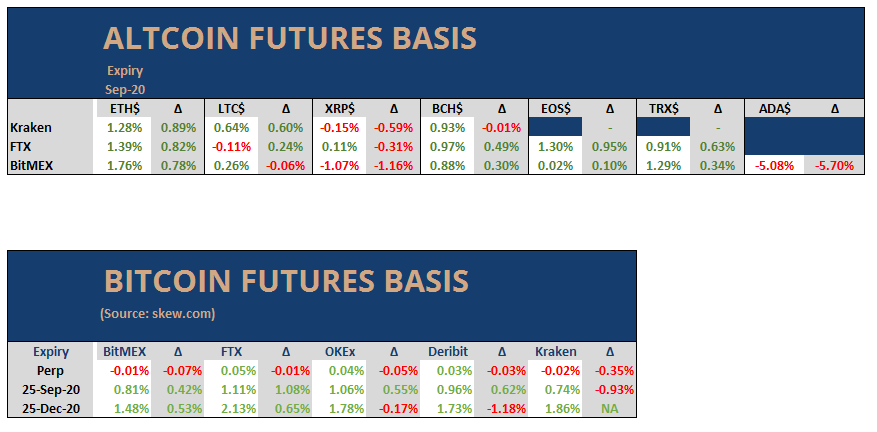
2 Altcoin Futures Basis Analysis
The term structure is stubbornly staying in contango. Despite the fact that we have not moved a great deal higher in price. Compared to last month's report, we have yet again moved about 0.5% on average.
Some altcoin bases, e.g. XRP and ADA have been showing some very strange behaviour of late. Their bases turned in backwardation. Both coins had a good run in the spot market over the past month, especially ADA. I struggle to find a plausible explanation for it. It might be possible that some more sophisticated players who lent out their XRP and ADA wanted to hedge their profits. Those futures markets are rather thin on liquidity, which might be the reason why they are trading in backwardation.
Currently, it is hard to take away any added value from the term futures basis. To me, it seems to be in pretty neutral territory. Let's see if a sudden price move one way or the other will push the basis a bit more towards the boundaries.
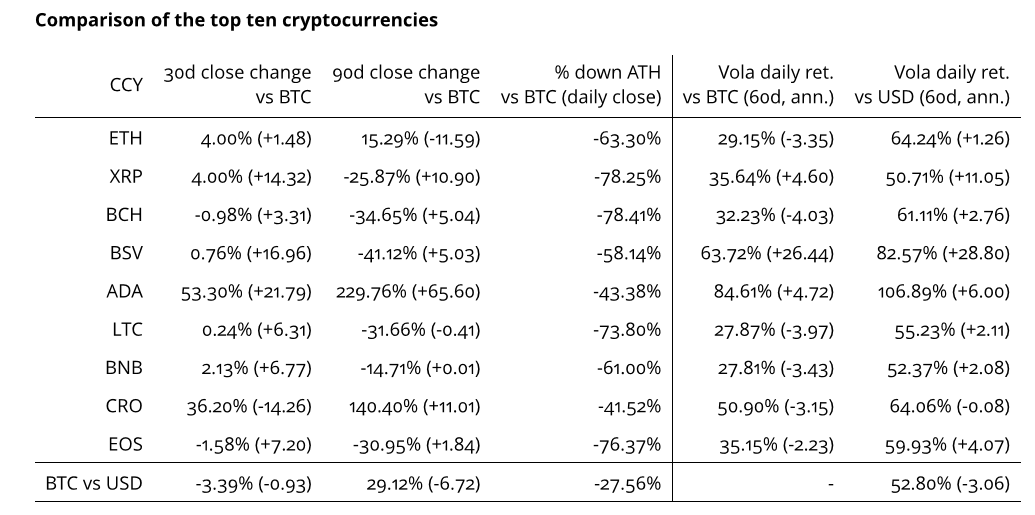
3 Top Ten Comparison
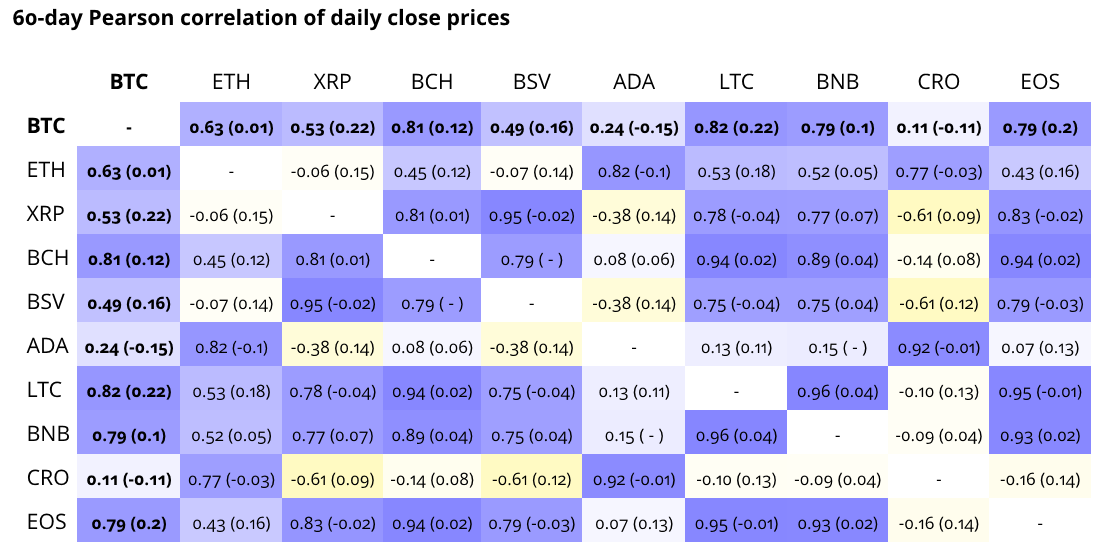
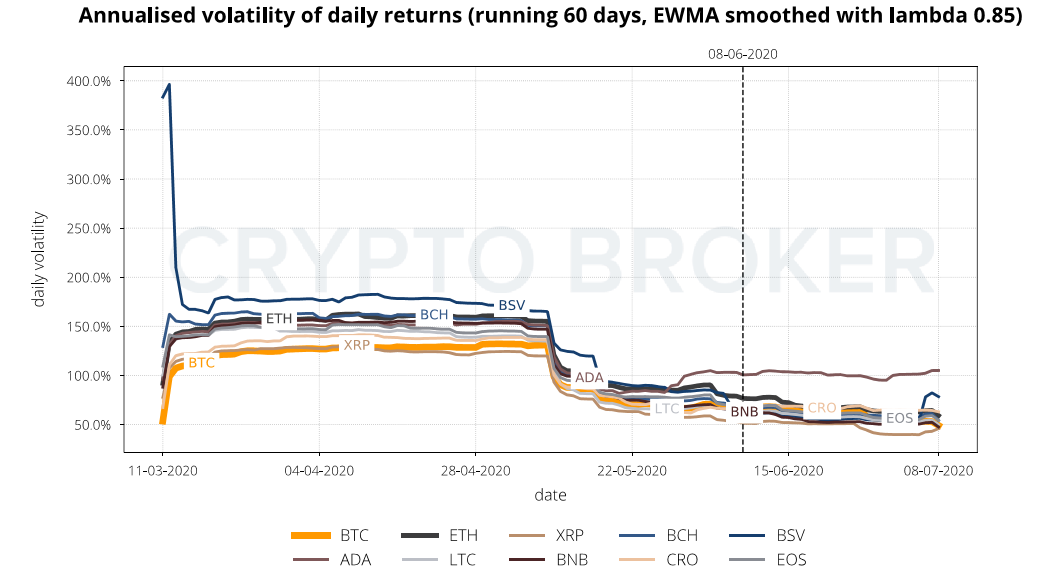
4 Volatility and Correlation Comparison
5 ETHBTC 4h Technical Chart Analysis
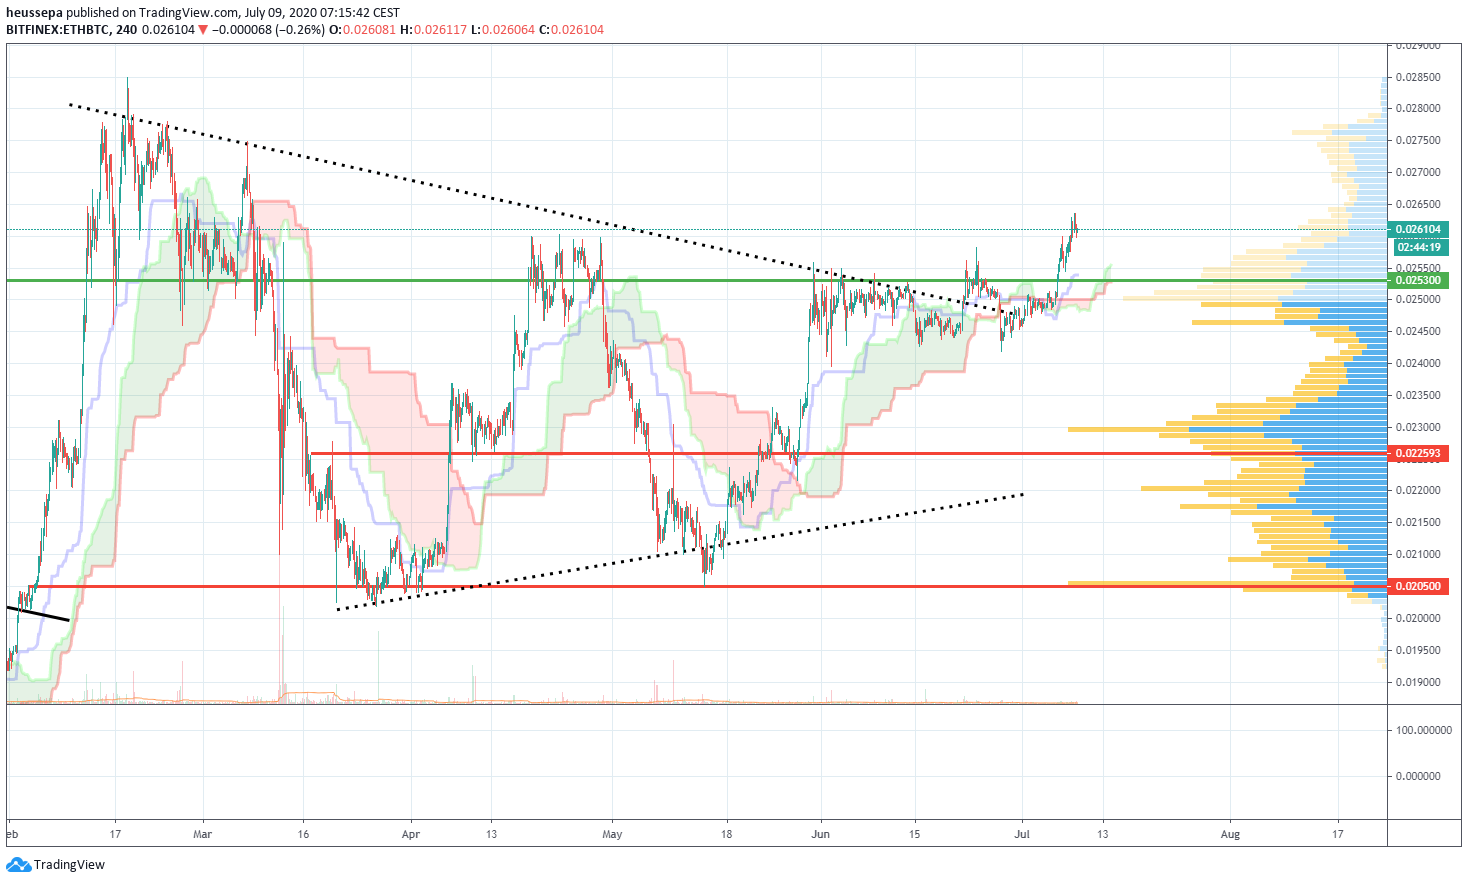
The breakout finally happened!
We had to wait quite a while for this. Additionally, just before the rally started, the market quickly squeezed out the early longs. We are now comfortably back over the Ichimoku cloud, which has turned bullish again and has made it through the resistance of 0.02530. It also reached new highs when we started trading above 0.02600.
I believe that as long we are able to hold above 0.02500, the road will now remain clear to attack the last big high (at around 0.02900).
When you zoom out to the daily chart, it looks like we have been in a 12-month consolidation phase, with two symmetrical triangles covering that period. The next larger liquidity pool will start at around 0.03060: right after the last larger high we talked above at 0.02900. This is the area I will focus on to take some profit on our long position.
View the charts: ETHBTC 4h | ETHBTC daily
6 Market Cap Overview
Glossary
Advance Decline Line - the Advance Decline Line shows the ratio of coins for which the market cap increased relative to the market cap of BTC for each day.
ATH - all time high (maximum lookback period of 730€ days).
Data Source - tables and charts are based on daily close prices provided by Coinmarketcap.
EWMA - exponentially weighted moving average.
MACD - moving average convergence/divergence is a popular technical indicator to identify trends in the underlying instrument. It consists of the MACD and signal line, and the area shown in the background. The MACD line (strong) is the difference of two exponential moving averages, which are defined by the first and second parameter of the indicator. The signal line (weak) is the exponential moving average of the MACD line defined by the third parameter. The area in the background illustrates the difference between the MACD line and the signal line.
Pearson Correlation - quantifies the linear relationship between two variables.
Spearman Correlation - quantifies the monotonic relationship between two variables. As such, the Spearman Correlation is based on the ranked values of each variable and is used to detect non-linear relationships between the two.
About the author
Wenn er nicht an den Crypto Broker Trading Desk gefesselt ist - mit 24/7 Trading verfügbar für unsere Kunden - liefert Patrick Heusser aktuelle Kommentare zu den aufstrebenden Crypto Märkten, sowohl für unsere Kunden als auch für die Finanzpresse. Bevor er zu Crypto Broker stiess war Patrick als Zinshändler bei der UBS tätig und hatte verschiedene Positionen in der IRCC (Interest Rate, Commodity, and Currency) Trading Division in London, New York, Singapur und Zürich inne. Patrick ist Experte für Trading und Risikomanagement und verfügt über Erfahrung in der Führung von Startup Projekten.
Related Articles


