
Inhalt
- 1 Rotation Analysis
- 2 Altcoin Futures Basis Analysis
- 3 Top Ten Comparison
- 4 Volatility and Correlation Comparison
- 5 ETHBTC 4h Technical Chart Analysis
- 6 Market Cap Overview
- Glossary
1. Rotation Analysis
Support by halving
BTC continues to perform, and is currently carrying all the other coins. The important resistance of 9,300 has been reached and the next one is between 10,000 and 10,300.
So far, the market push has come mainly from cash buyers, and the overall market keeps following the spot prices.
Interesting fact: bitcoin halving searches on Google reached an all-time high. Another fact: oil contracts are trading with higher volatility than bitcoin.
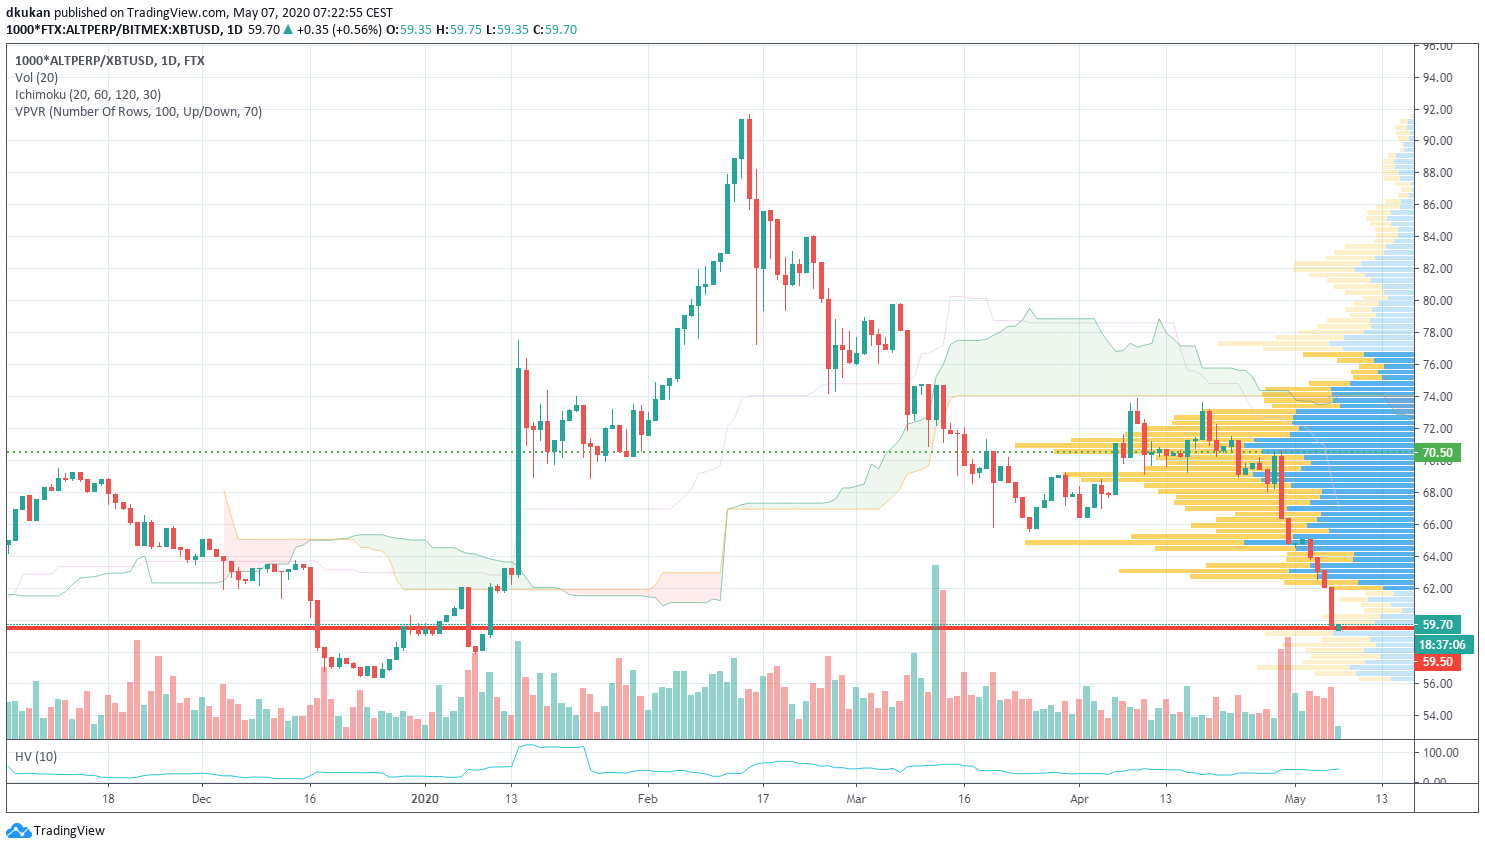
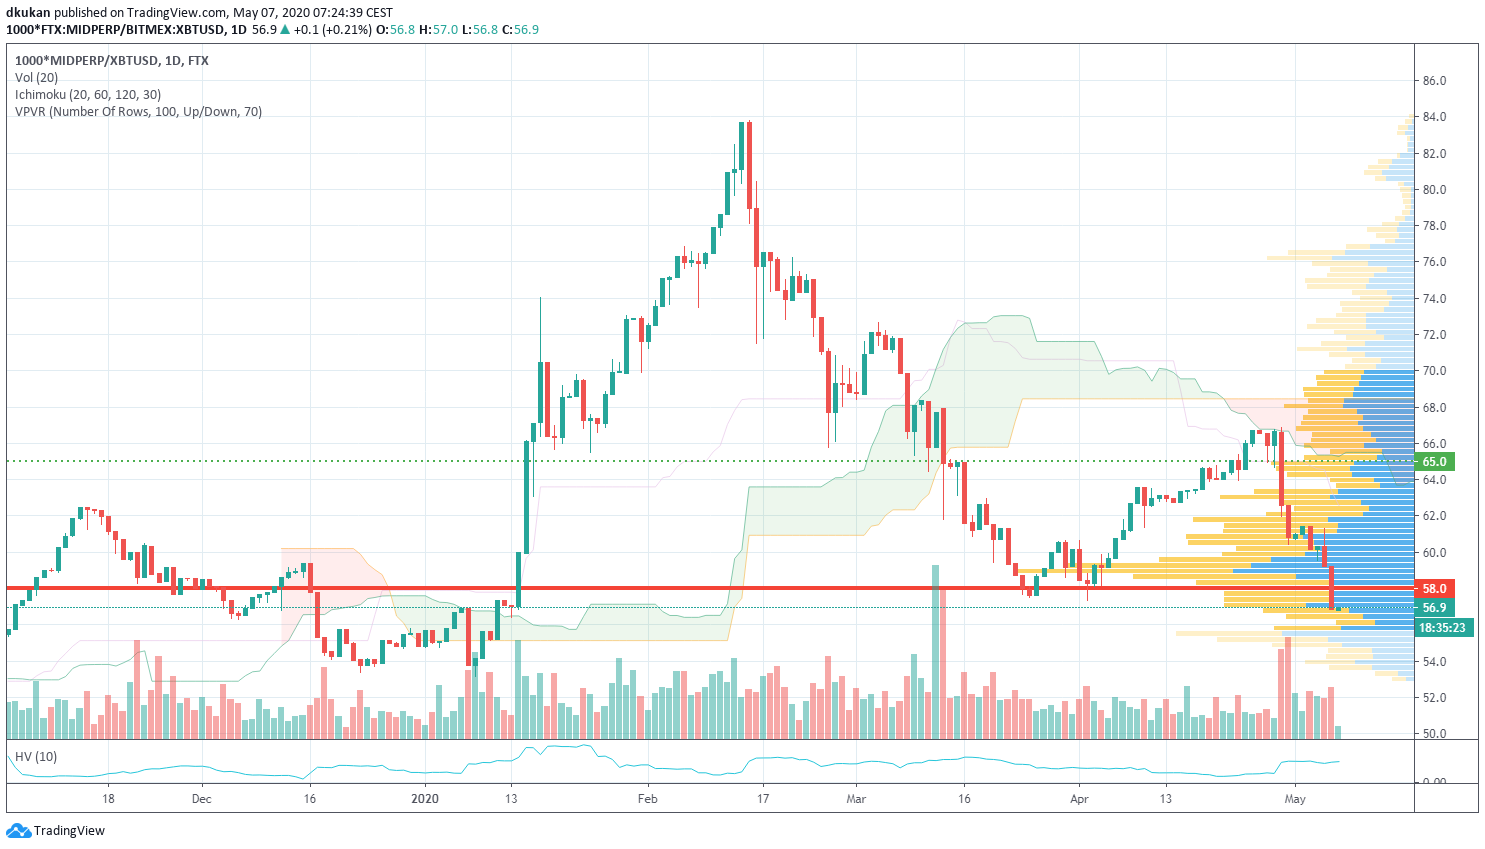
In the charts below, you can see the technical analysis for the Alt/Mid/Shit Indices. Attached you will also find our short-term view on support and resistance levels for all three indices:
Alt: Support 59.50 / Resistance 70.50 / Alt (4h)
Mid: Support 58.00 / Resistance 65.00 / Mid (4h)
Shit: Support 69.50 / Resistance 78.00 / Shit (4h)
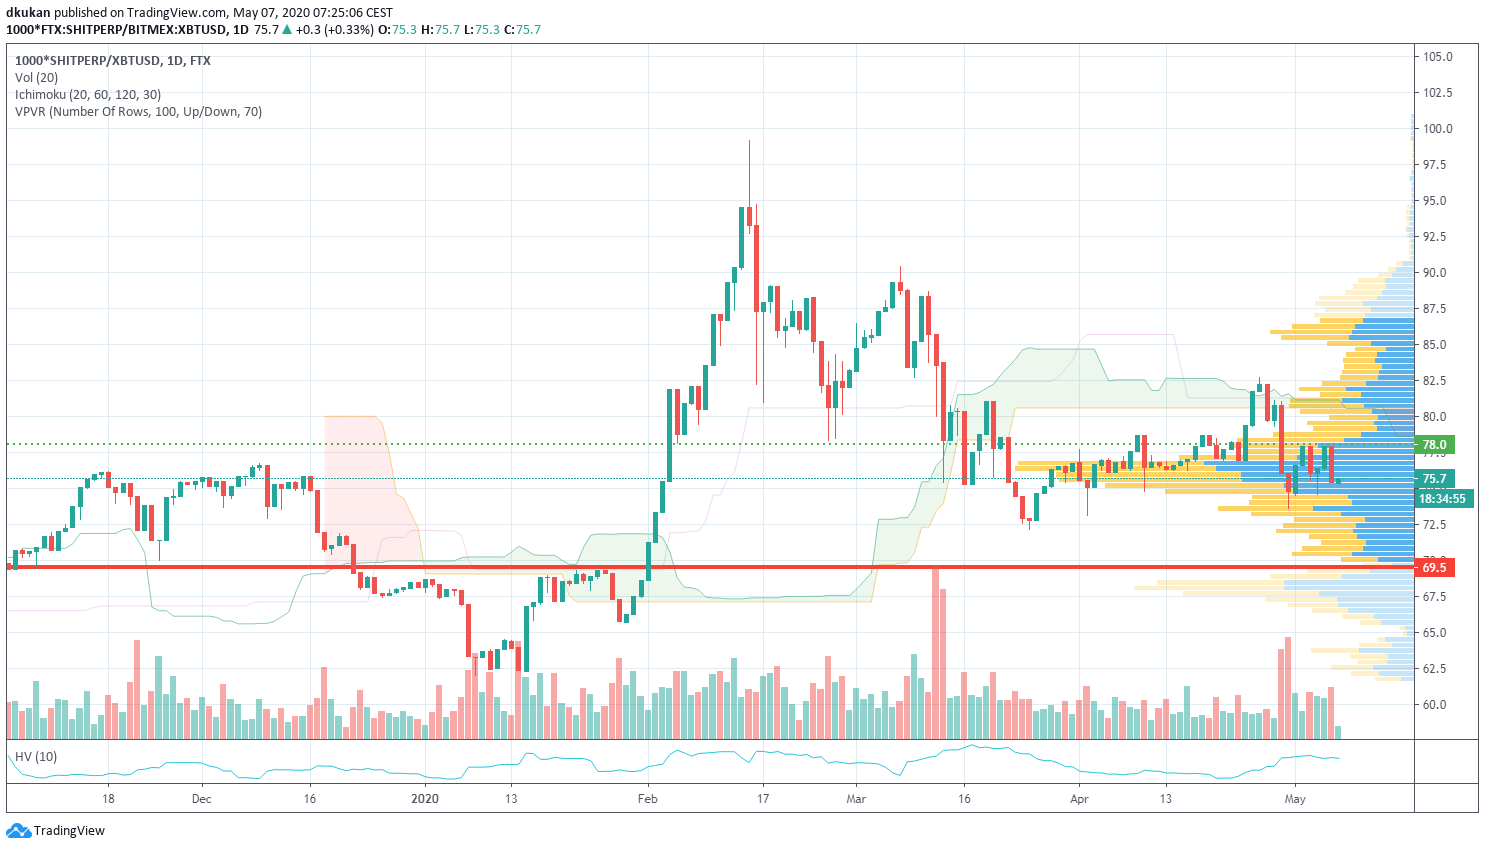
Alt and Mid Index underperformed BTC massively, and both have broken the support line. The support line for Alt has been revised: from 65 to 59.50. The Shit Index is still trading within the bandwidth of support and resistance.
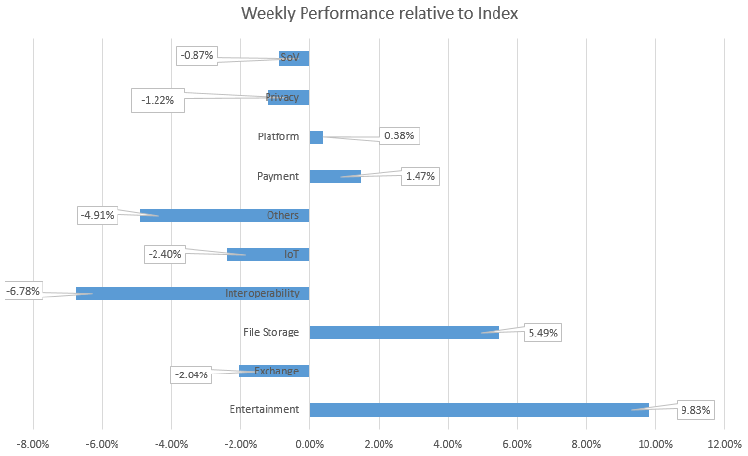
The outperforming sectors are Entertainment, File Storage, Platform, and Payment. The losing sectors are Interoperability and Exchange. In general, BTC has outperformed all other coins towards the big event of its halving.
The best performing coins are constituents of the Shit Index. DGB gained again with a plus of 39%, CHZ with 38%. The worst performing coins are GRIN, with a minus of 37%, and ZEN, OMG, ICX, CKB, and EOS, all with a minus of roughly 12%.
For three weeks now, the market has experienced the complete dominance of BTC, as opposed to Q1 2020 when altcoins were in favour. We do expect a correction and rotation after the halving event.
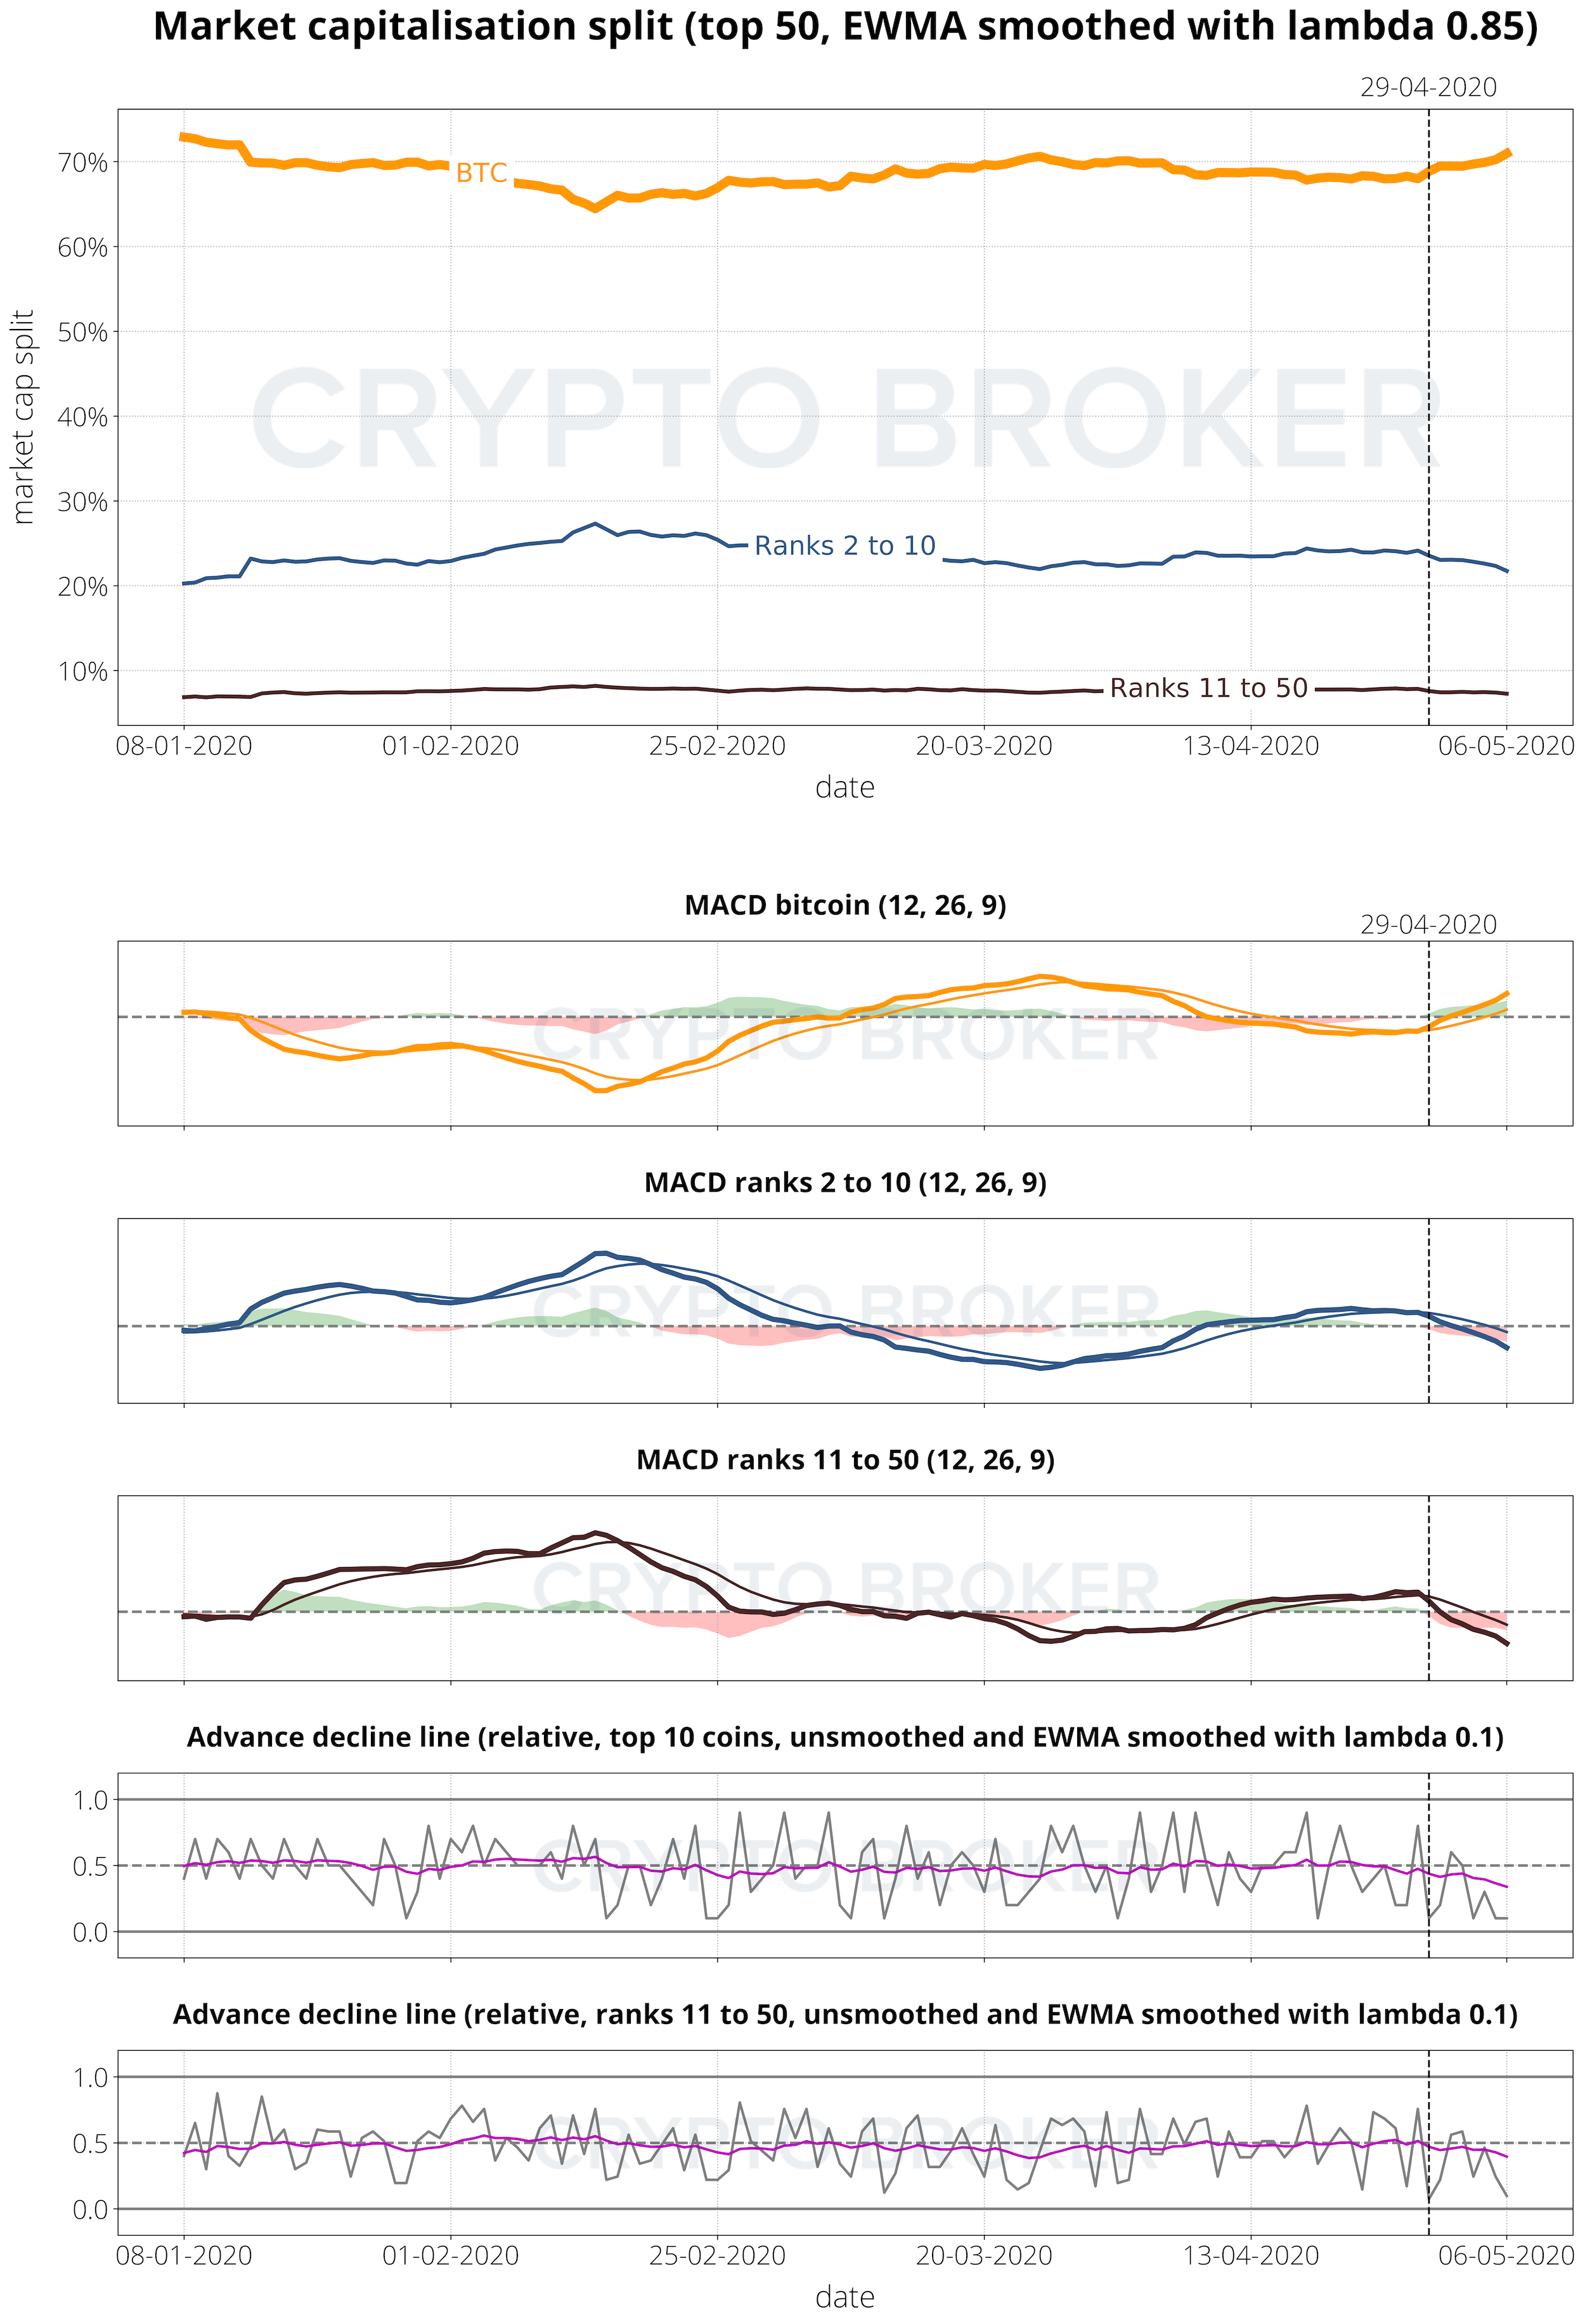
MACDs have changed since last week due to the outperfomance of BTC. BTC has left the neutral zone and is leaning towards moving into the overbought zone. All the other coins ranked between 2 and 50 have gone from neutral to oversold.
Estimated BTC halving: 4 days.
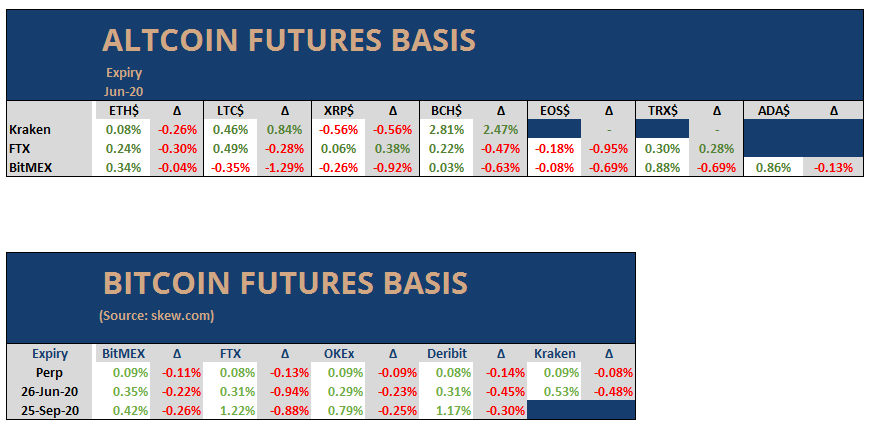
2 Altcoin Futures Basis Analysis
Futures basis trading does not seem to be very impressed by the rally. The BTC June futures basis is trading lower with a 0.5% premium, and the September futures basis with a 1% premium. Altcoin futures are trading neutral. Overnight funding decreased, where short position holders are paying long position holders.
BTC and ETH implied volatility decreased slightly. Front month volatility term structure remains high.
The overall traded volume for BTC and ETH is steadily increasing. All other factors, e.g. liquidations of positions and open interest in derivatives are moving higher as well.
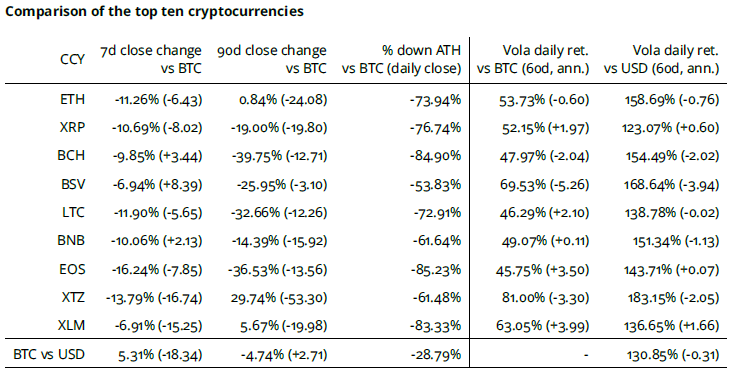
3 Top Ten Comparison
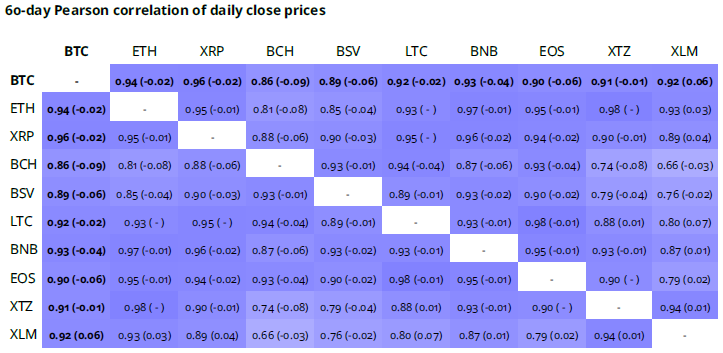
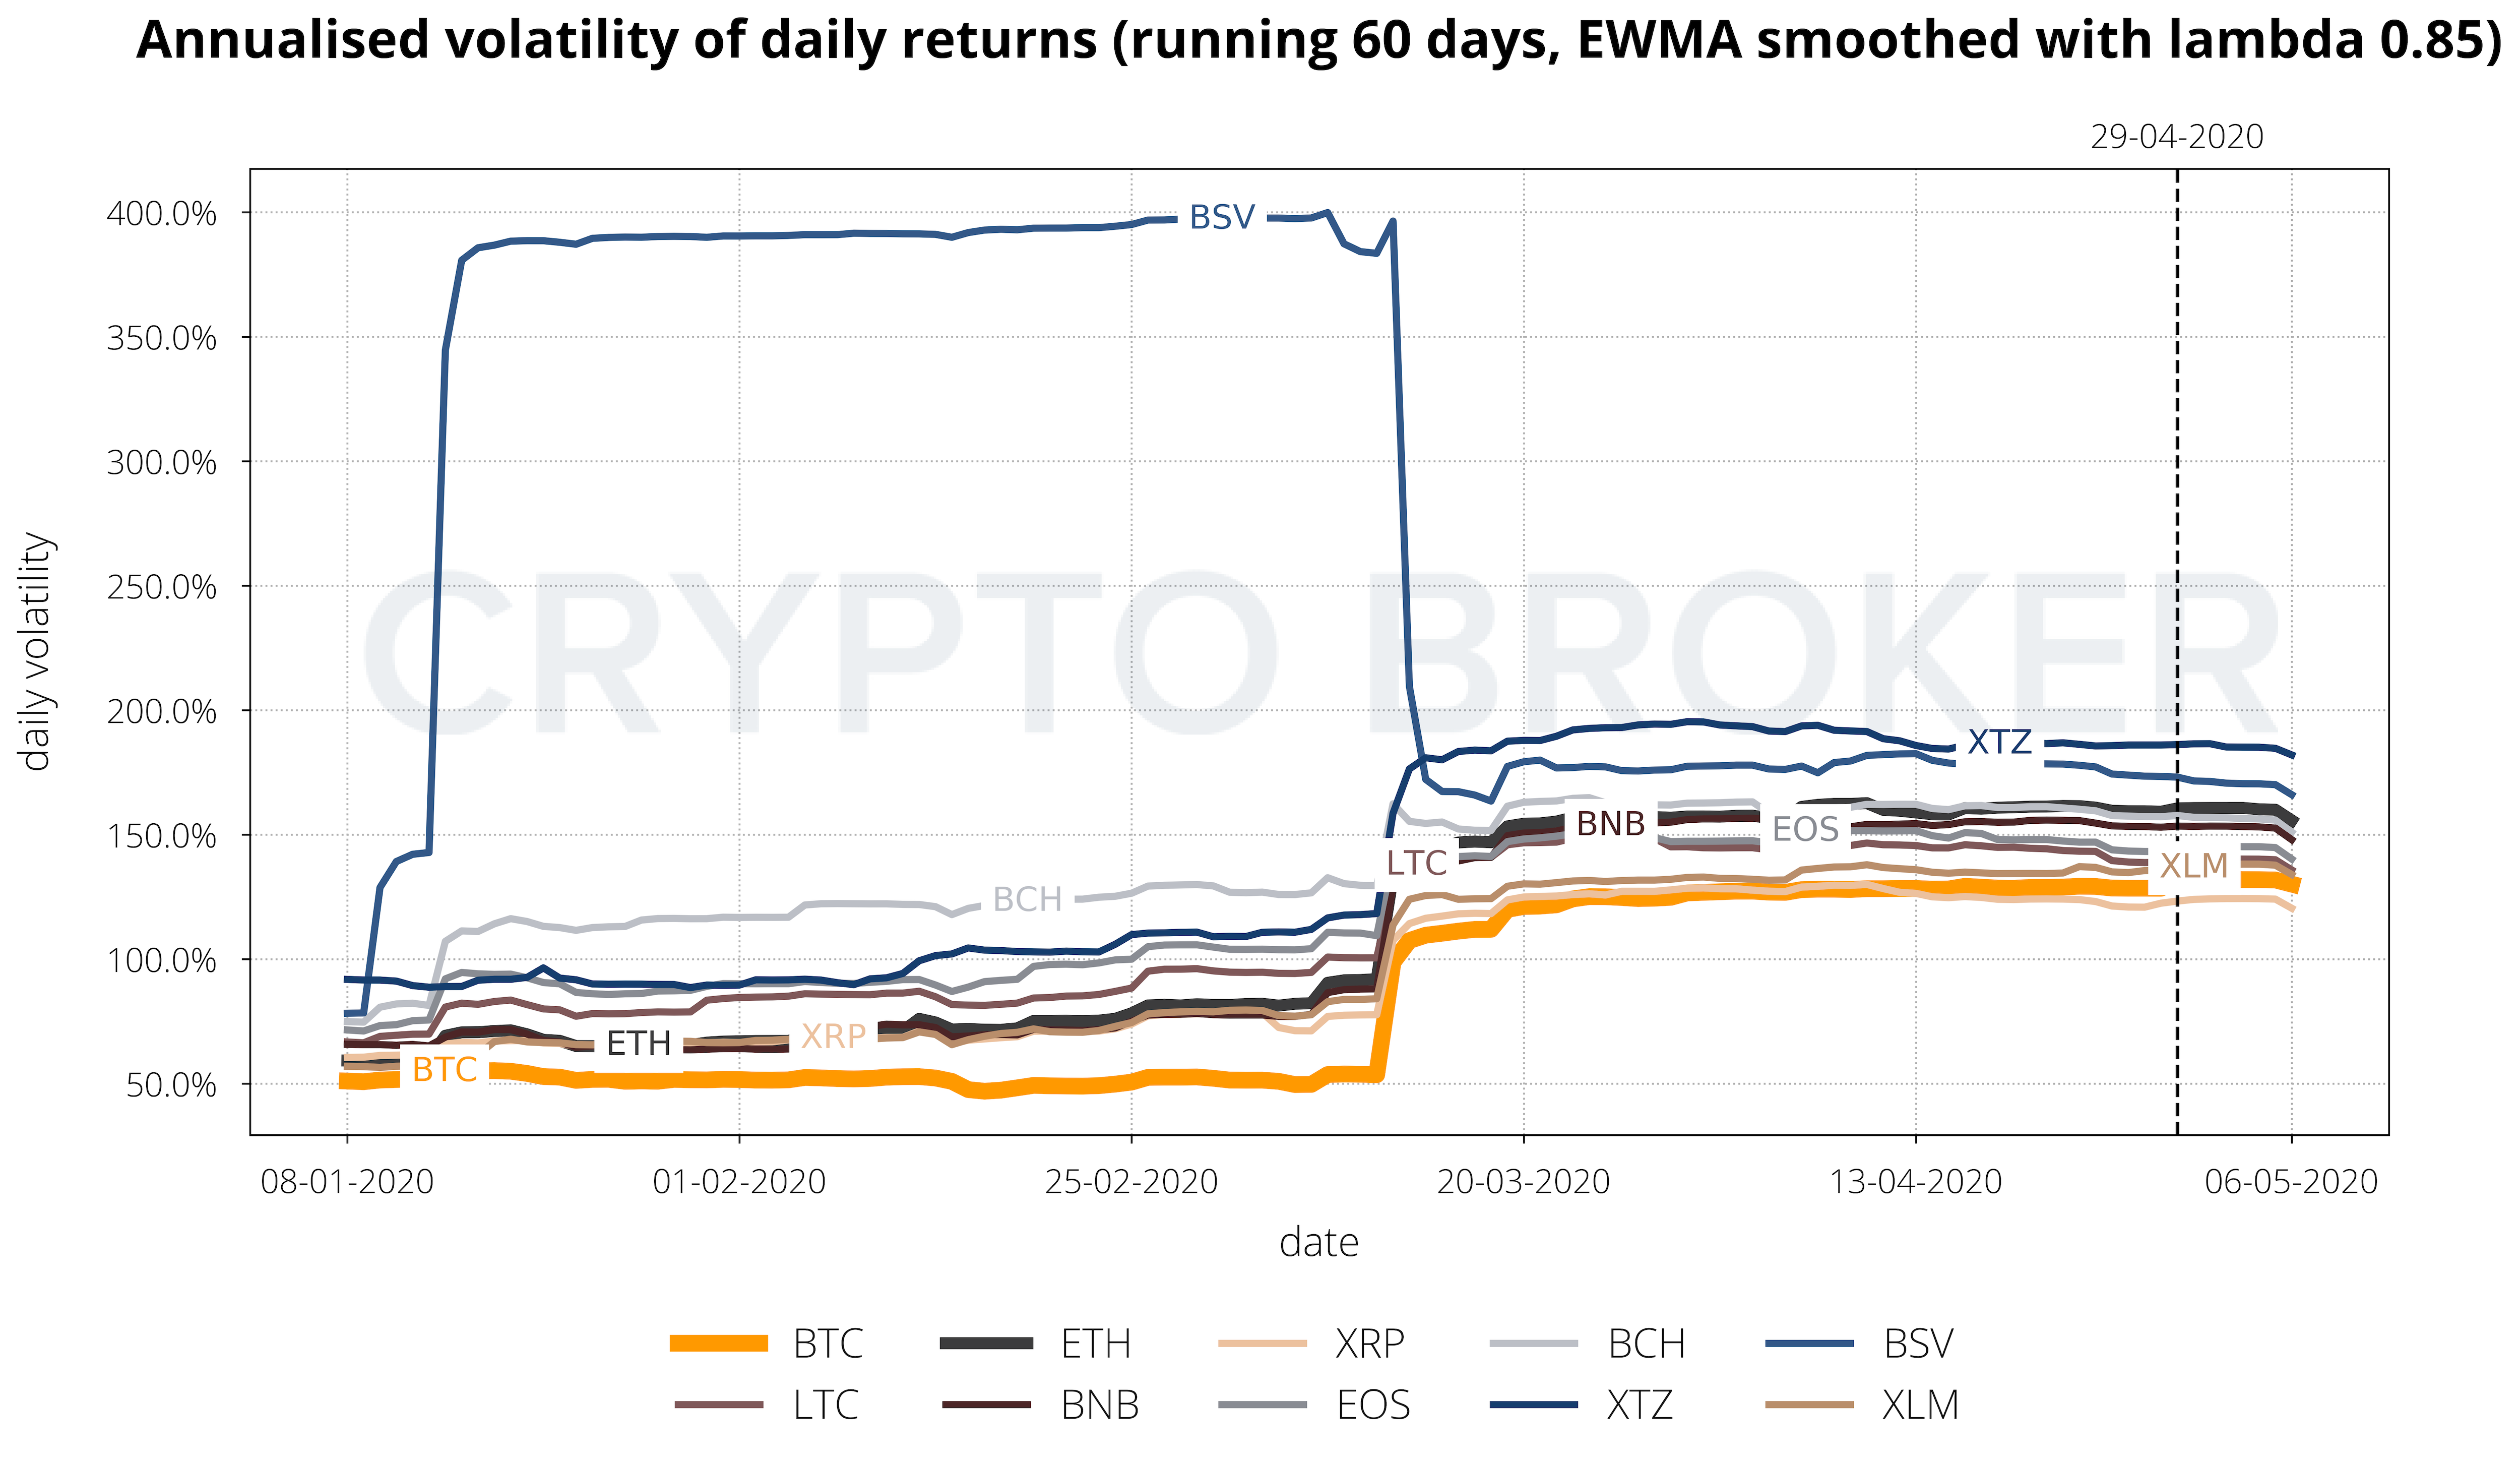
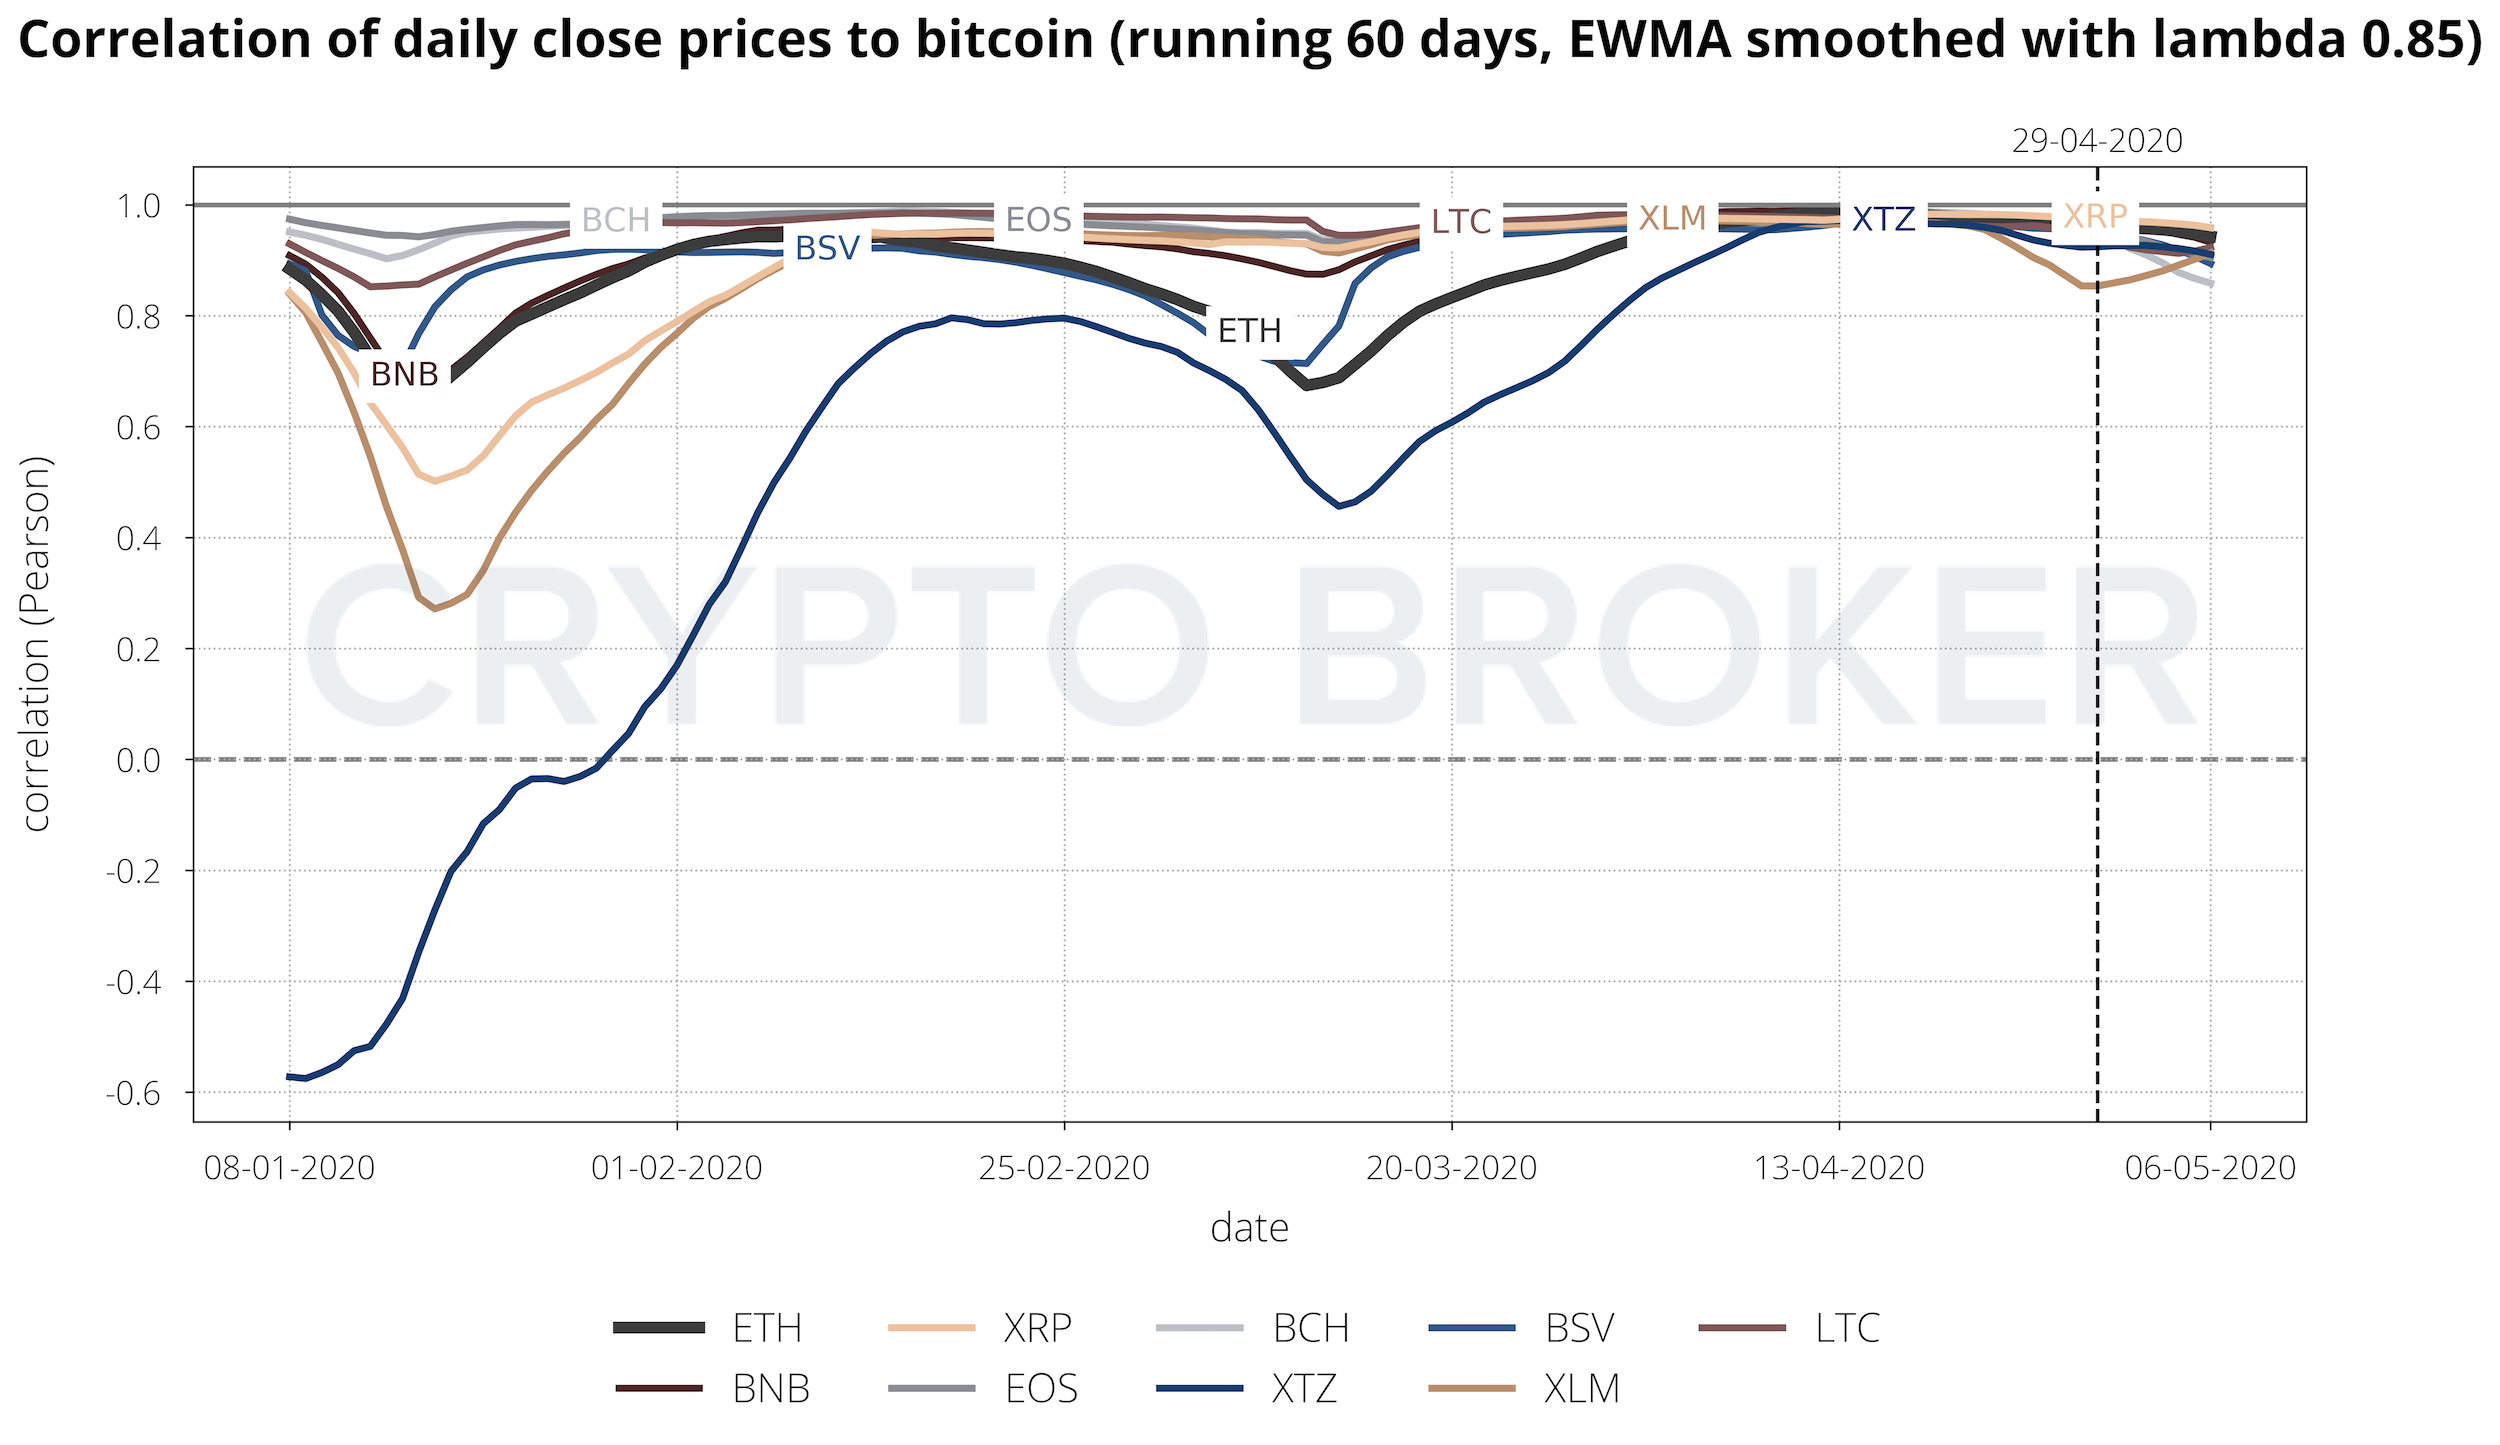
4 Volatility and Correlation Comparison
5 ETHBTC 4h Technical Chart Analysis
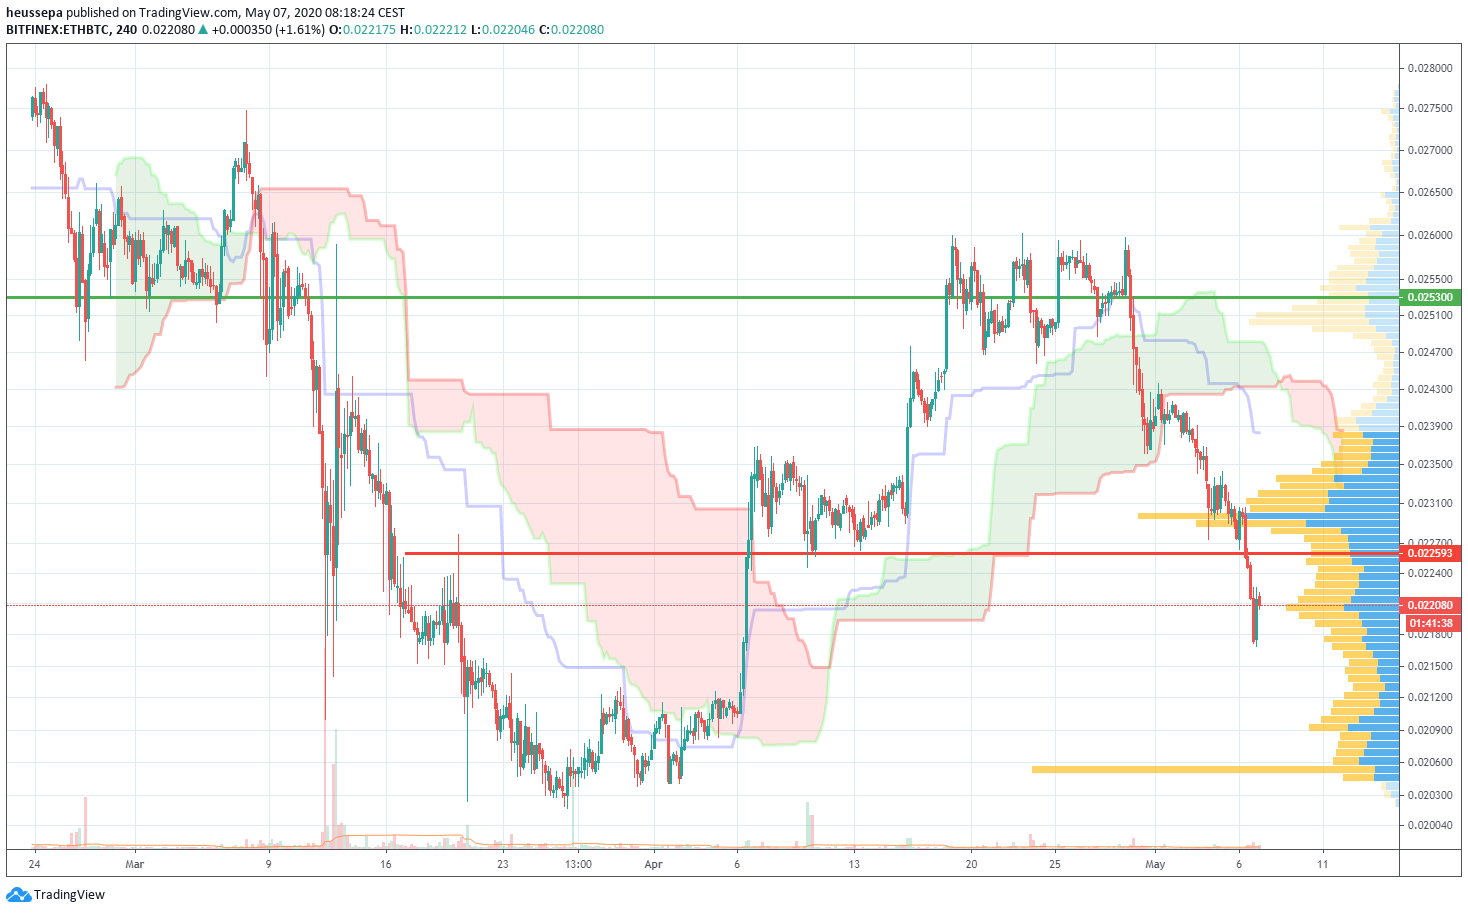
No time to breathe
Due to the force of King BTC, ETH had to bow down. There was a small battle near the lower band of the Ichimoku cloud, but then things gave way and we even moved through the short-term support line at around 0.02250.
The second indicator I mentioned in last week's report pertains to the margin longs on Bitfinex. Surprisingly, these have not blinked. There are still roughly 1.4 million ETH margin long contracts open, which means that nothing has changed since last week.
Right now, I do not see any reason to put a trade on in ETHBTC. But I still have the feeling that (slowly but surely) the altcoin bashing will come to an end. See the altcoin indices versus BTC charts for more on this.
View the chart: ETHBTC 4h
6 Market Cap Overview
Glossary
Advance Decline Line - the Advance Decline Line shows the ratio of coins for which the market cap increased relative to the market cap of BTC for each day.
ATH - all time high (maximum lookback period of 730€ days).
Data Source - tables and charts are based on daily close prices provided by Coinmarketcap.
EWMA - exponentially weighted moving average.
MACD - moving average convergence/divergence is a popular technical indicator to identify trends in the underlying instrument. It consists of the MACD and signal line, and the area shown in the background. The MACD line (strong) is the difference of two exponential moving averages, which are defined by the first and second parameter of the indicator. The signal line (weak) is the exponential moving average of the MACD line defined by the third parameter. The area in the background illustrates the difference between the MACD line and the signal line.
Pearson Correlation - quantifies the linear relationship between two variables.
Spearman Correlation - quantifies the monotonic relationship between two variables. As such, the Spearman Correlation is based on the ranked values of each variable and is used to detect non-linear relationships between the two.
About the author
Patrick Heusser is Head of Trading at Crypto Broker AG. Prior to joining the company, Patrick worked as an Interest Rate Trader at UBS and held various positions in the IRCC (interest rate, commodity and foreign exchange trading) in London, New York, Singapore and Zurich. Patrick is an expert in trading and risk management. He also gained experience in other areas, such as building start-up companies. Patrick has a degree in banking from a business school. He has also taken various courses in technical chart analysis.
Related Articles


