
Inhalt
- 1 Rotation Analysis
- 2 Altcoin Futures Basis Analysis
- 3 Top Ten Comparison
- 4 Volatility and Correlation Comparison
- 5 ETHBTC 4h Technical Chart Analysis
- 6 Market Cap Overview
- Glossary
1. Rotation Analysis
The challenge of staying above 10,000
Bitcoin rallied over the 10,000 mark and traded briefly at around 10,200, before losing several hundreds of points within mere minutes towards the 9,200 short-term support level.
Equity markets have stabilised and are steadily trading higher, so there is currently no fear to be expected from the traditional side. This setup is definitively supportive for all cryptocurrencies.
Unfortunately, there were not many top news stories that came out last week. The exchange Coinbase announced that it would list the Maker coin at the beginning of June, which gave Maker a boost of over 30% in one day.
Another item of importance is the upcoming launch of ETH 2.0. The project will be implemented in several phases. Phase 0: System with the Beacon Chain; Phase 1: Data with the parallel processing of transactions in shards; Phase 2: State with EVM 2.0 and smart contracts.
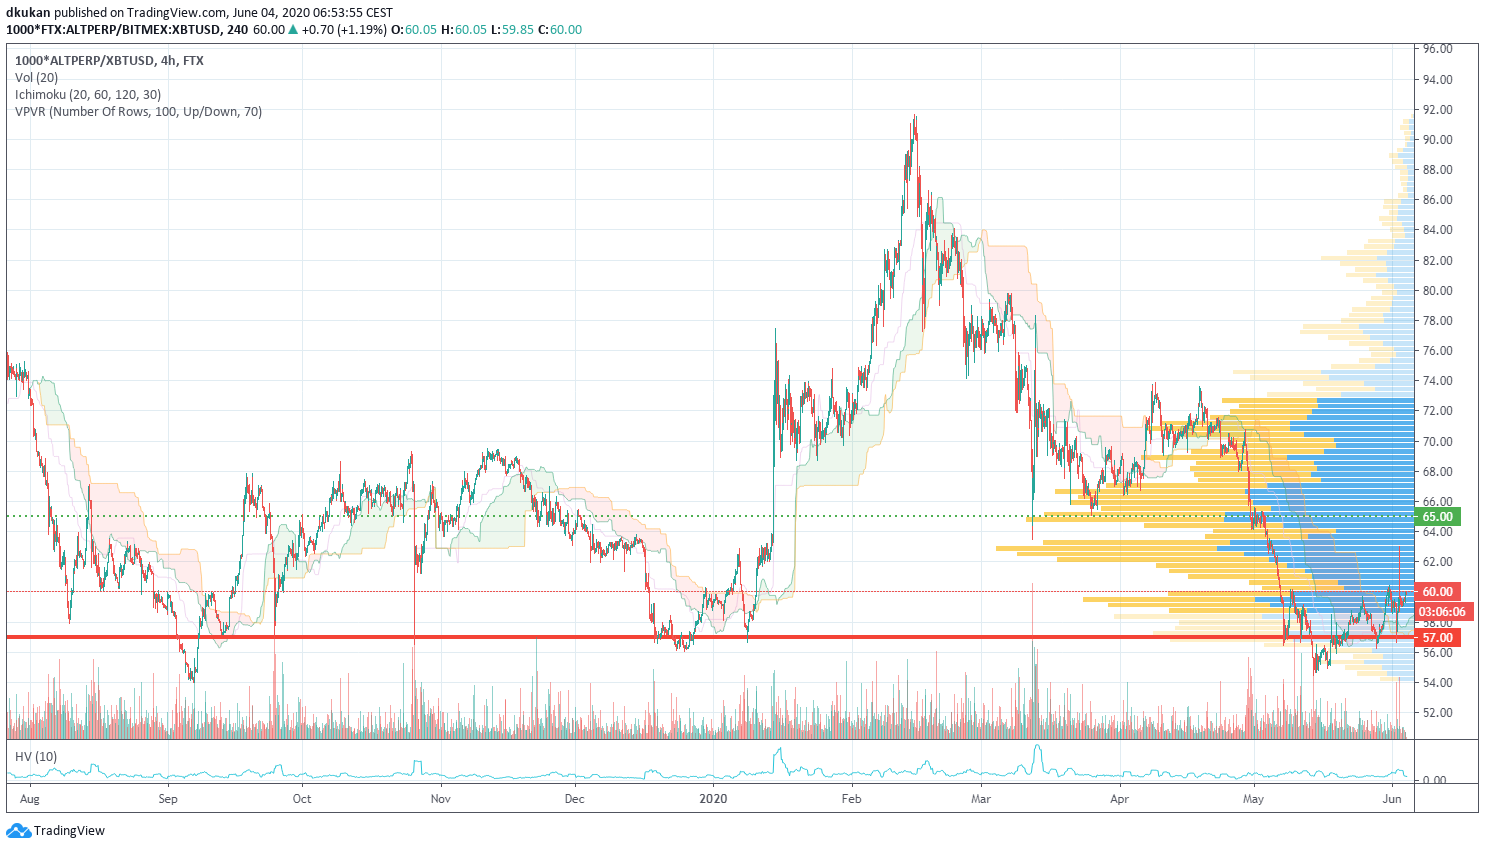
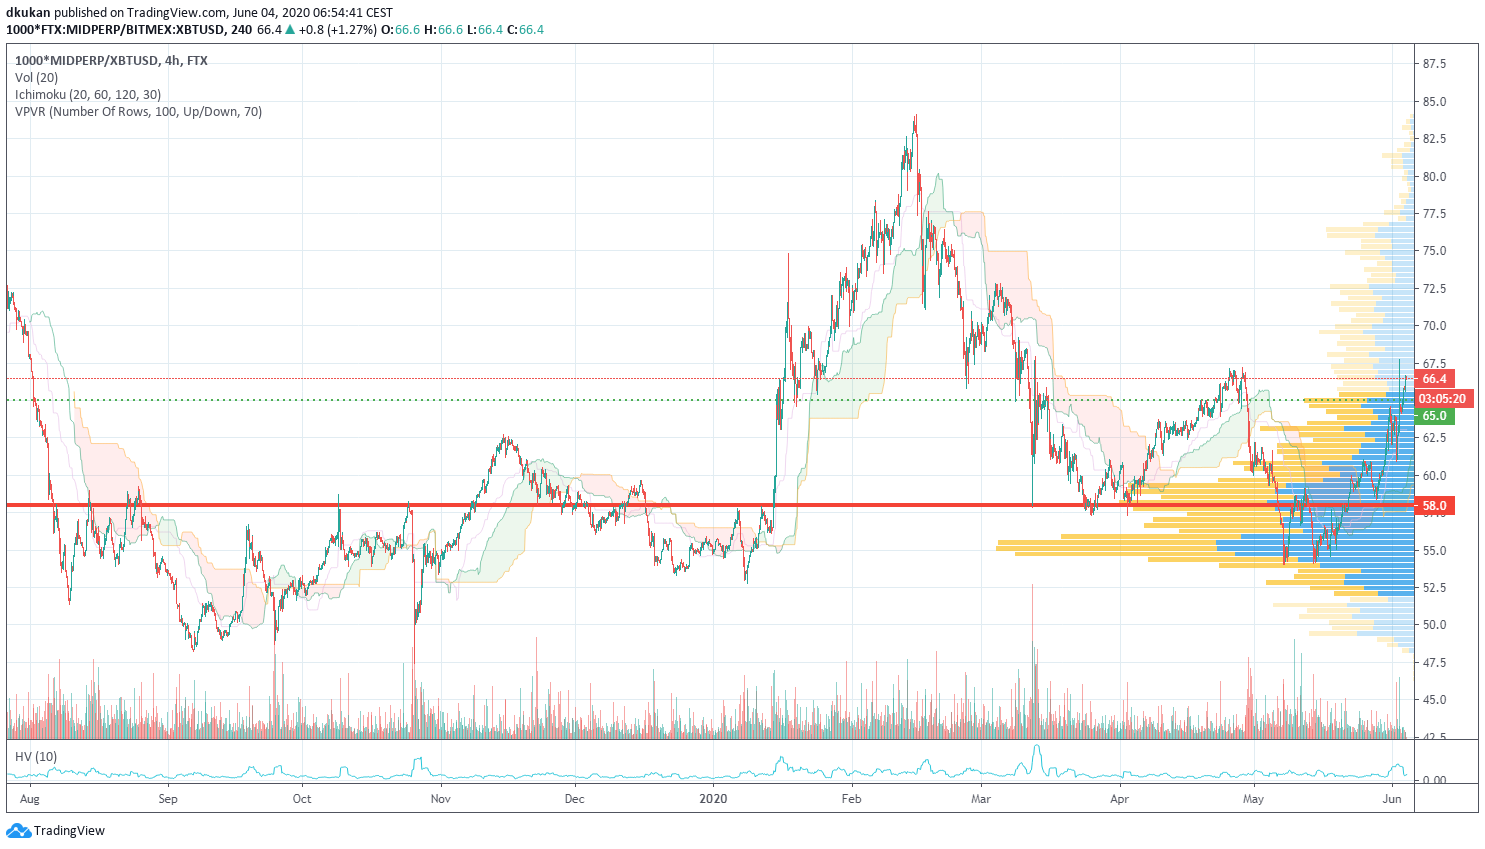
In the charts below, you can see the technical analysis for the Alt/Mid/Shit Indices. Attached you will also find our short-term view on support and resistance levels for all three indices:
Alt: Support 57.00 / Resistance 65.00 / Alt (4h)
Mid: Support 58.00 / Resistance 65.00 / Mid (4h)
Shit: Support 82.00 / Resistance 90.00 / Shit (4h)
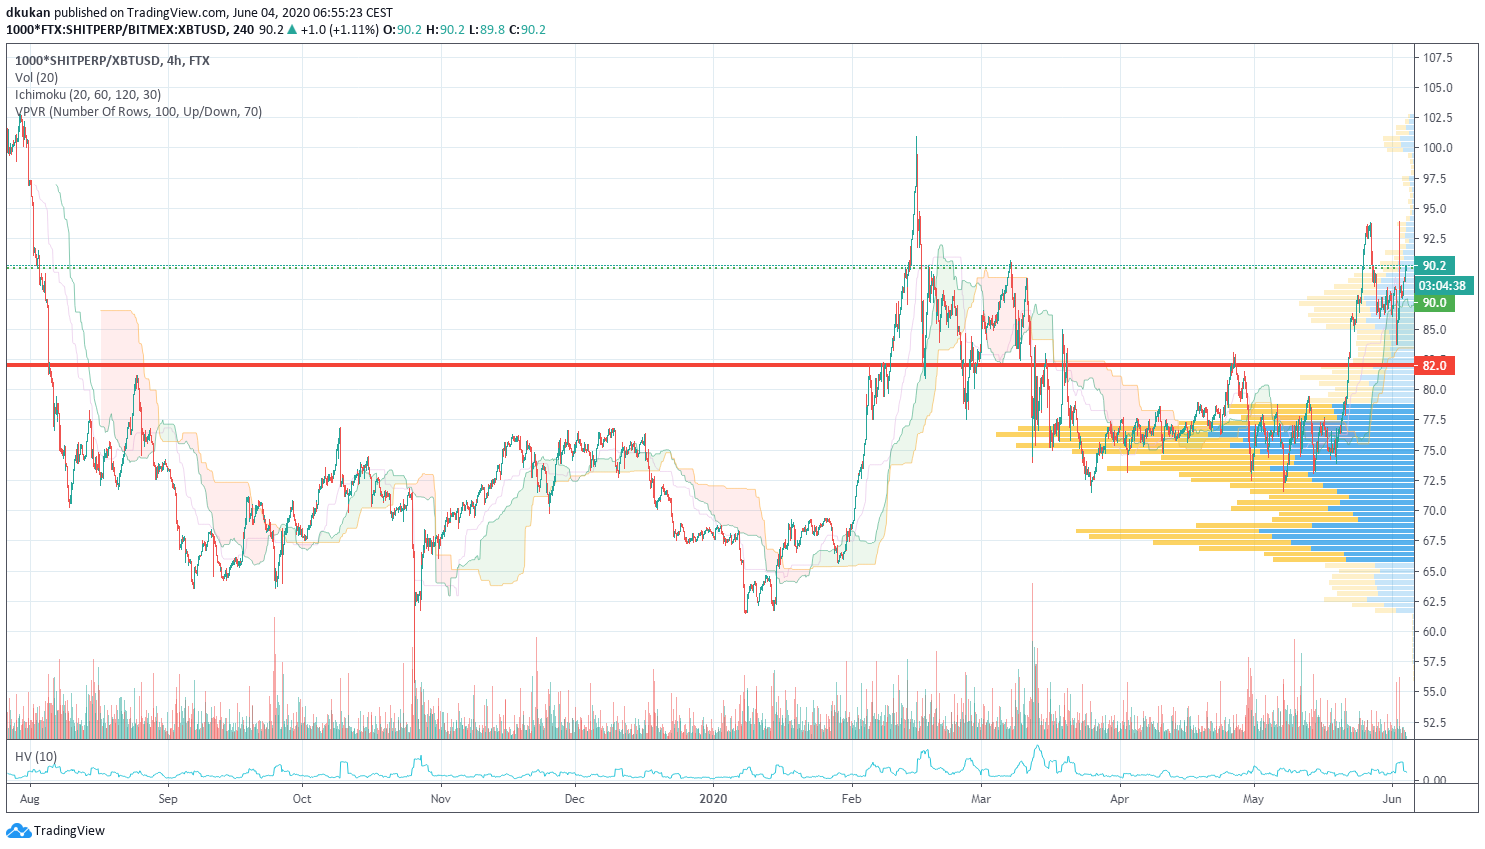
The rotation within the three indices has slowed a bit, especially the Shit Index moved neutrally over the last couple of days. The Mid Index performed well against bitcoin and is currently trading at the resistance level. Overall USD performance in the Mid Index is up 18%.
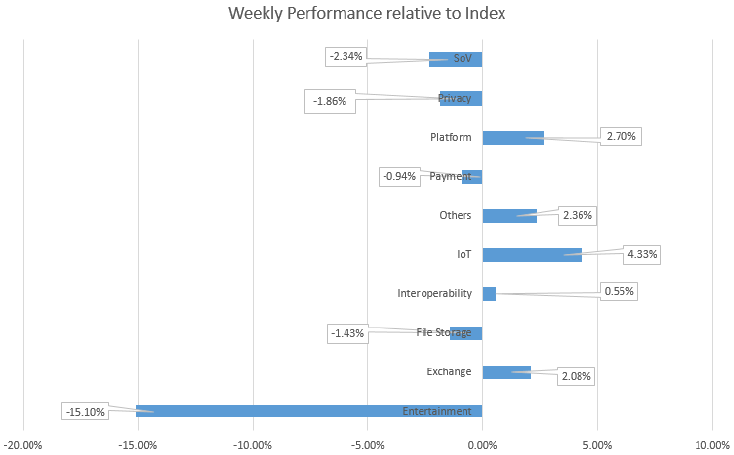
The Entertainment sector has finally seen a correction after a long run of outperformance against all other sectors. Entertainment lost 15% relative to the Index. All other sectors have not changed a great deal, and are trading within a bandwidth of minus 2% and plus 4% relative to the Index.
Theta was the most prominent coin within the Entertainment sector during the past few days; it is a constituent of the Shit Index. The coin corrected with minus 17% from the high of USD 0.345. Another coin performing with a minus of 10% USD was MATIC. The top performing coins were ADA, with a plus of 59%, and LRC, with a plus of 51%. Both coins are constituents of the Shit Index.
Ethereum Classic went through its Phoenix hard fork last weekend, and the major exchanges experienced some issues by suspending the deposits and withdrawals functions for one day.
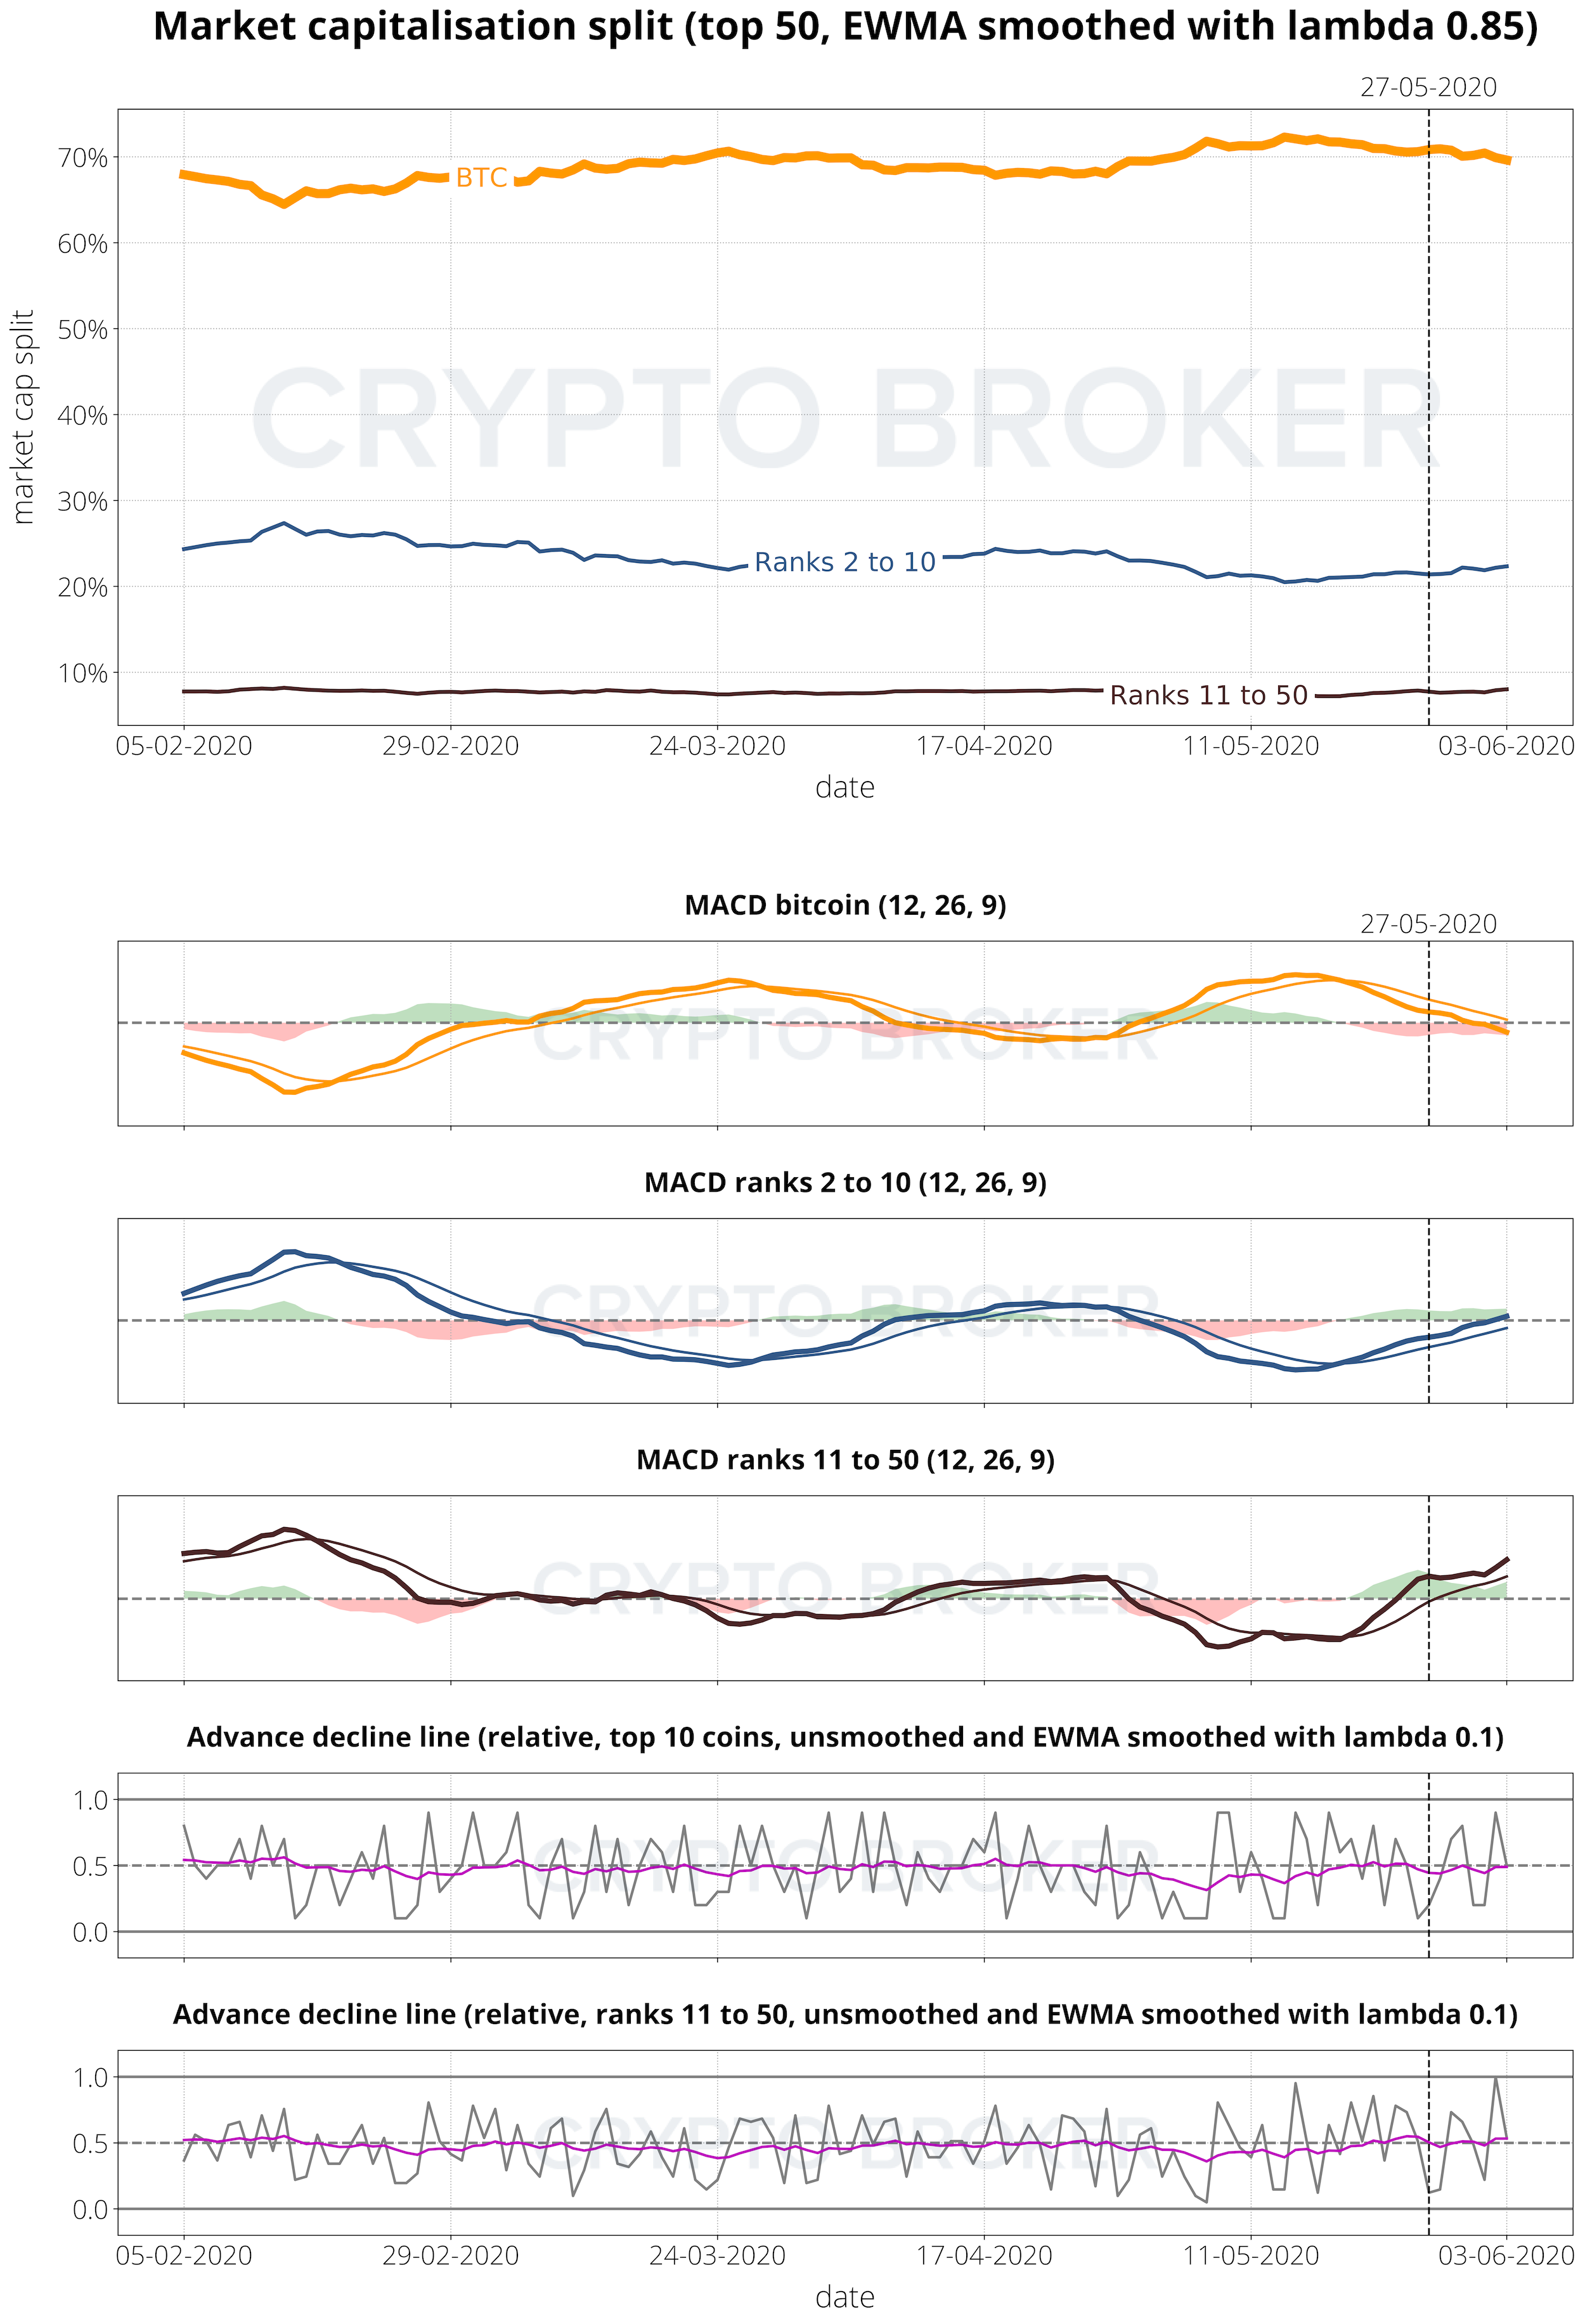
MACDs show a similar picture to last week. BTC and coins ranked from 2 to 10 are in a neutral zone, whereas coins ranked from 11 to 50 remain in the overbought zone.
Rotation has slowed down, but we do expect to see continued ongoing rotation.
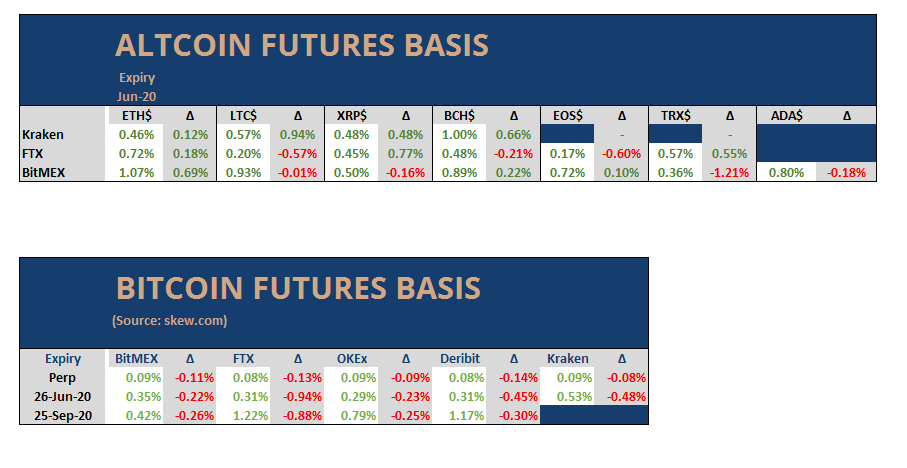
2 Altcoin Futures Basis Analysis
The Futures basis has not changed a great deal now before the June expiry. The June futures basis is still trading with a premium between 0.5% and 1%. The September futures basis is trading with a premium of roughly 1.5%. BTC funding rates are trading neutral, whereas the ETH funding rates are rather stretched. Overall trading volume increased in derivatives.
BTC and ETH implied volatility traded lower, especially in the back end. BTC 1 month ATM 68%; 2 month ATM 71%; 3 month ATM 74%. ETH 1 month ATM 73%; 2 month ATM 74%; 3 month ATM 77%.
Open interest in derivatives remains high. Liquidations were mainly seen within the short-term sell-off of bitcoin.
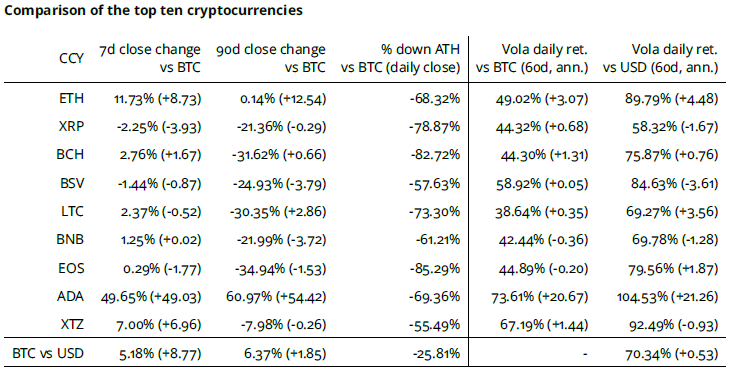
3 Top Ten Comparison
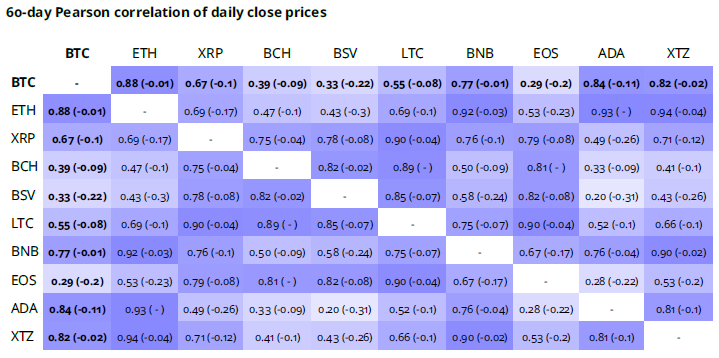
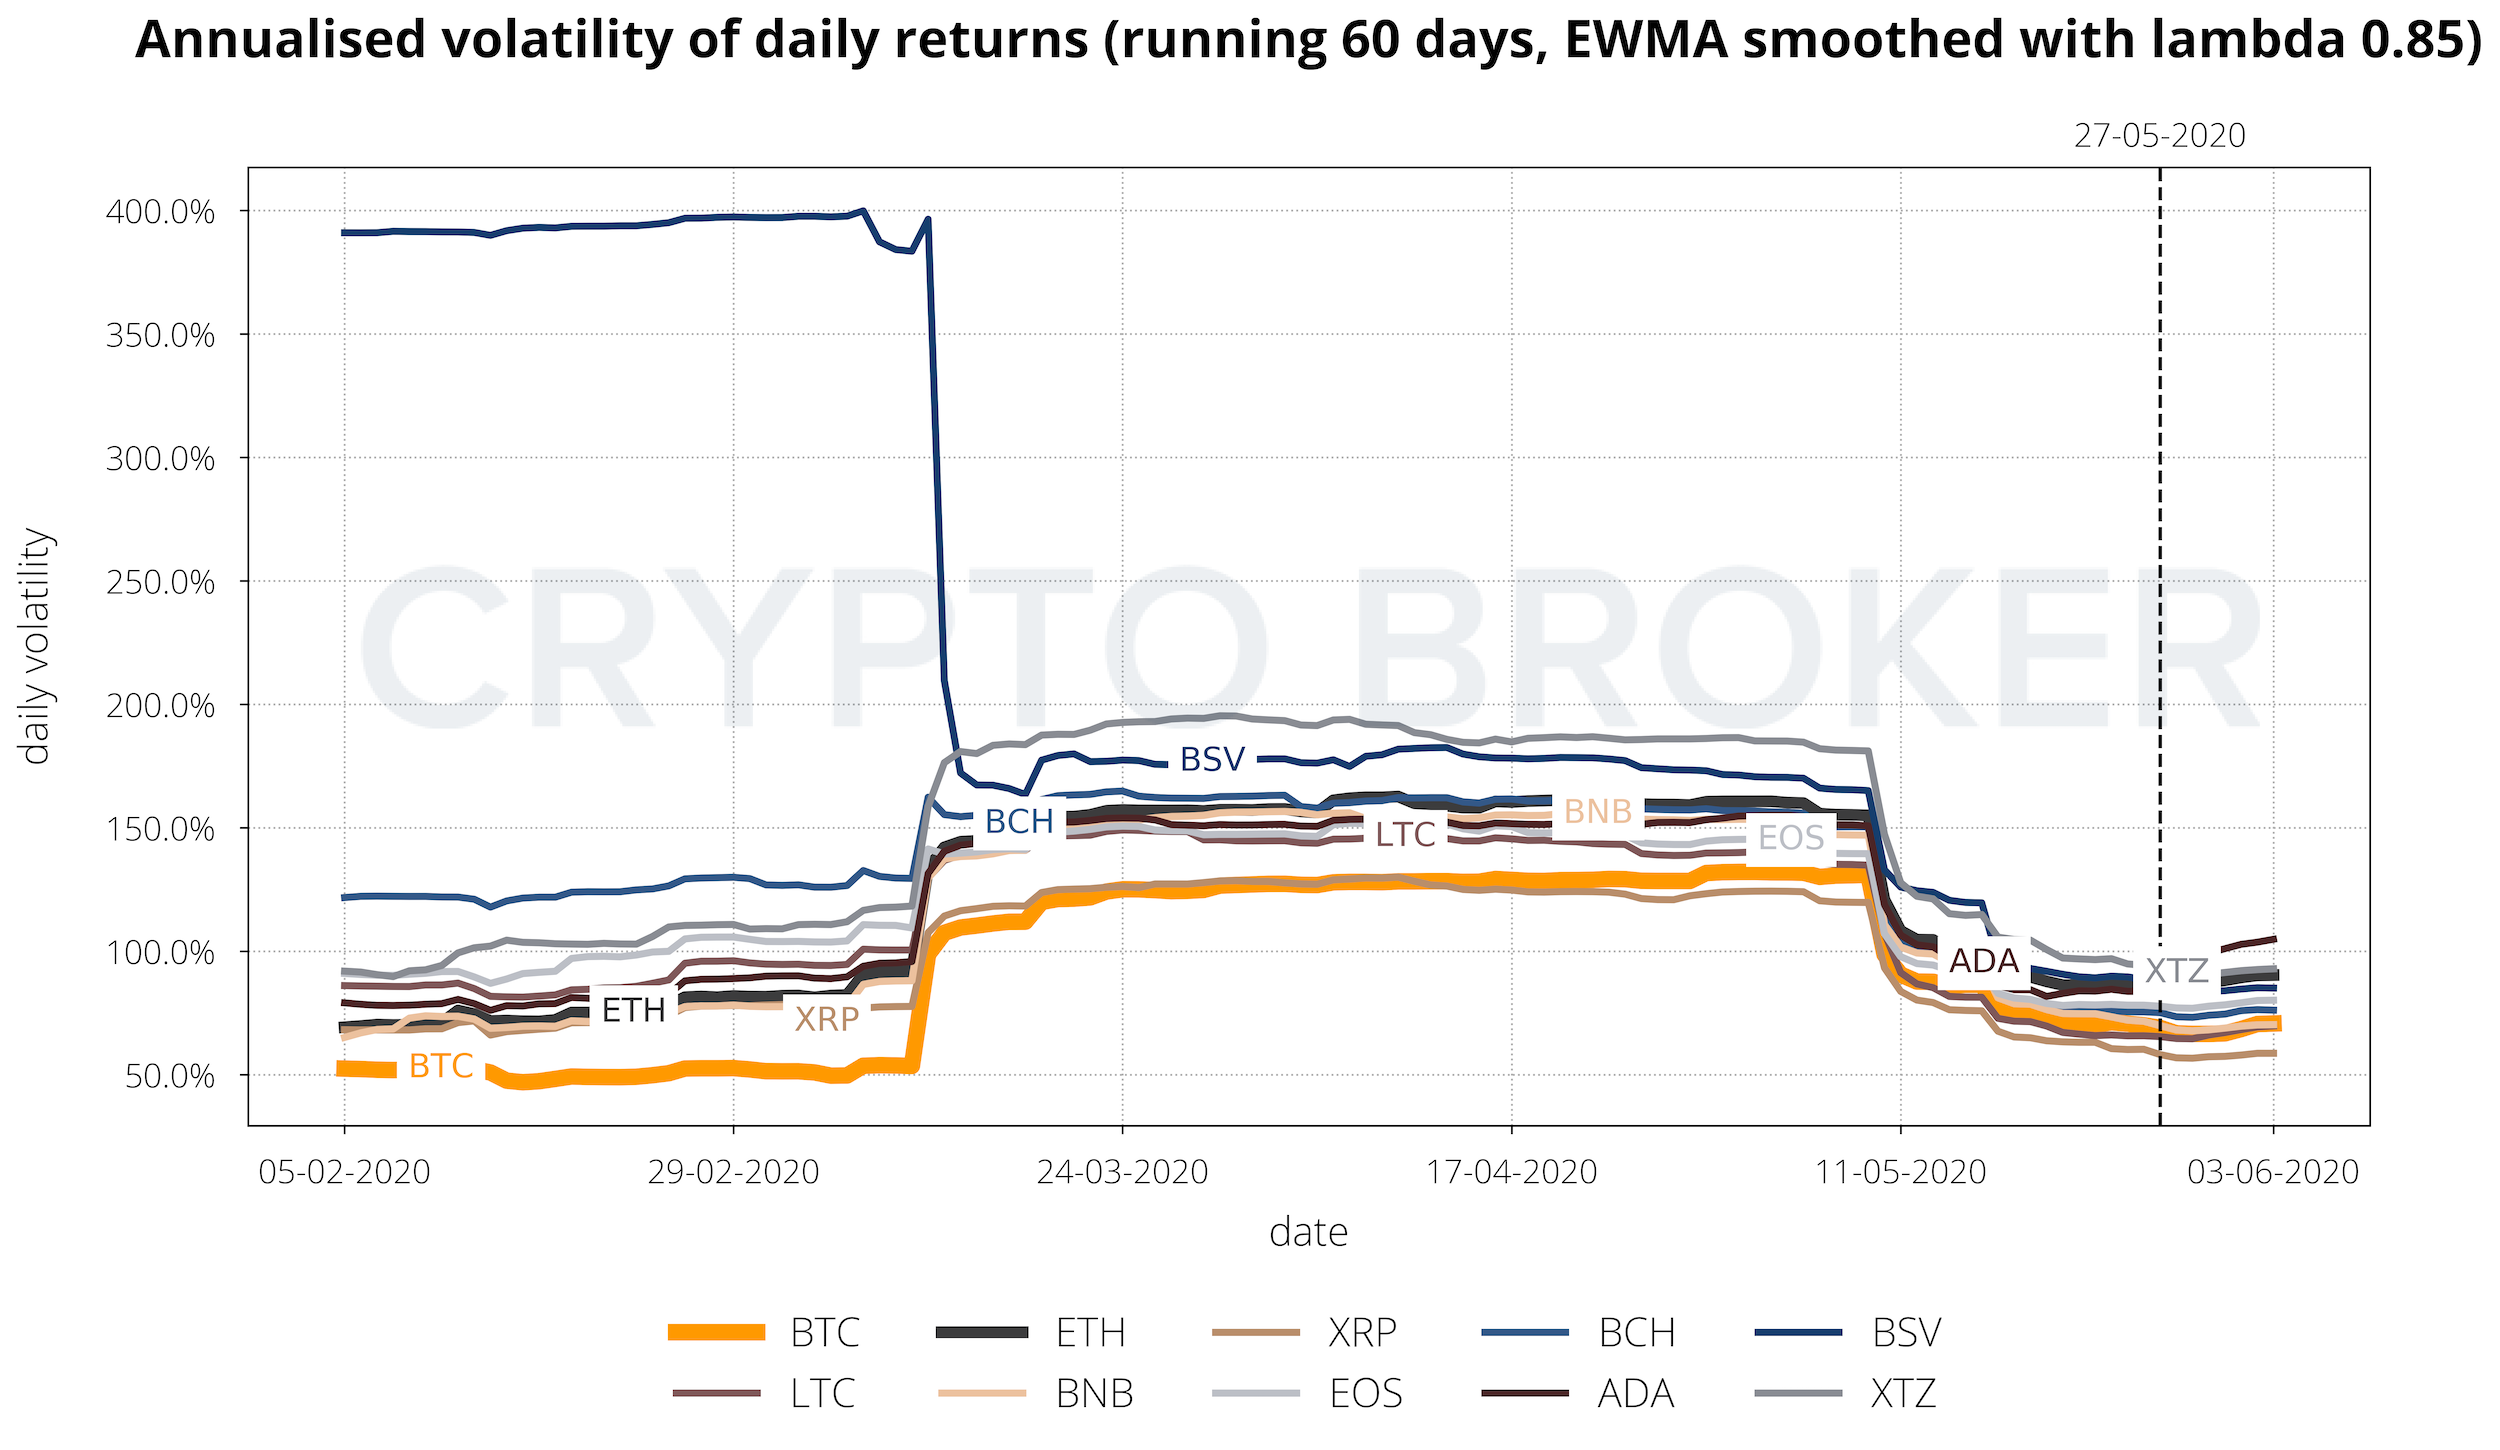
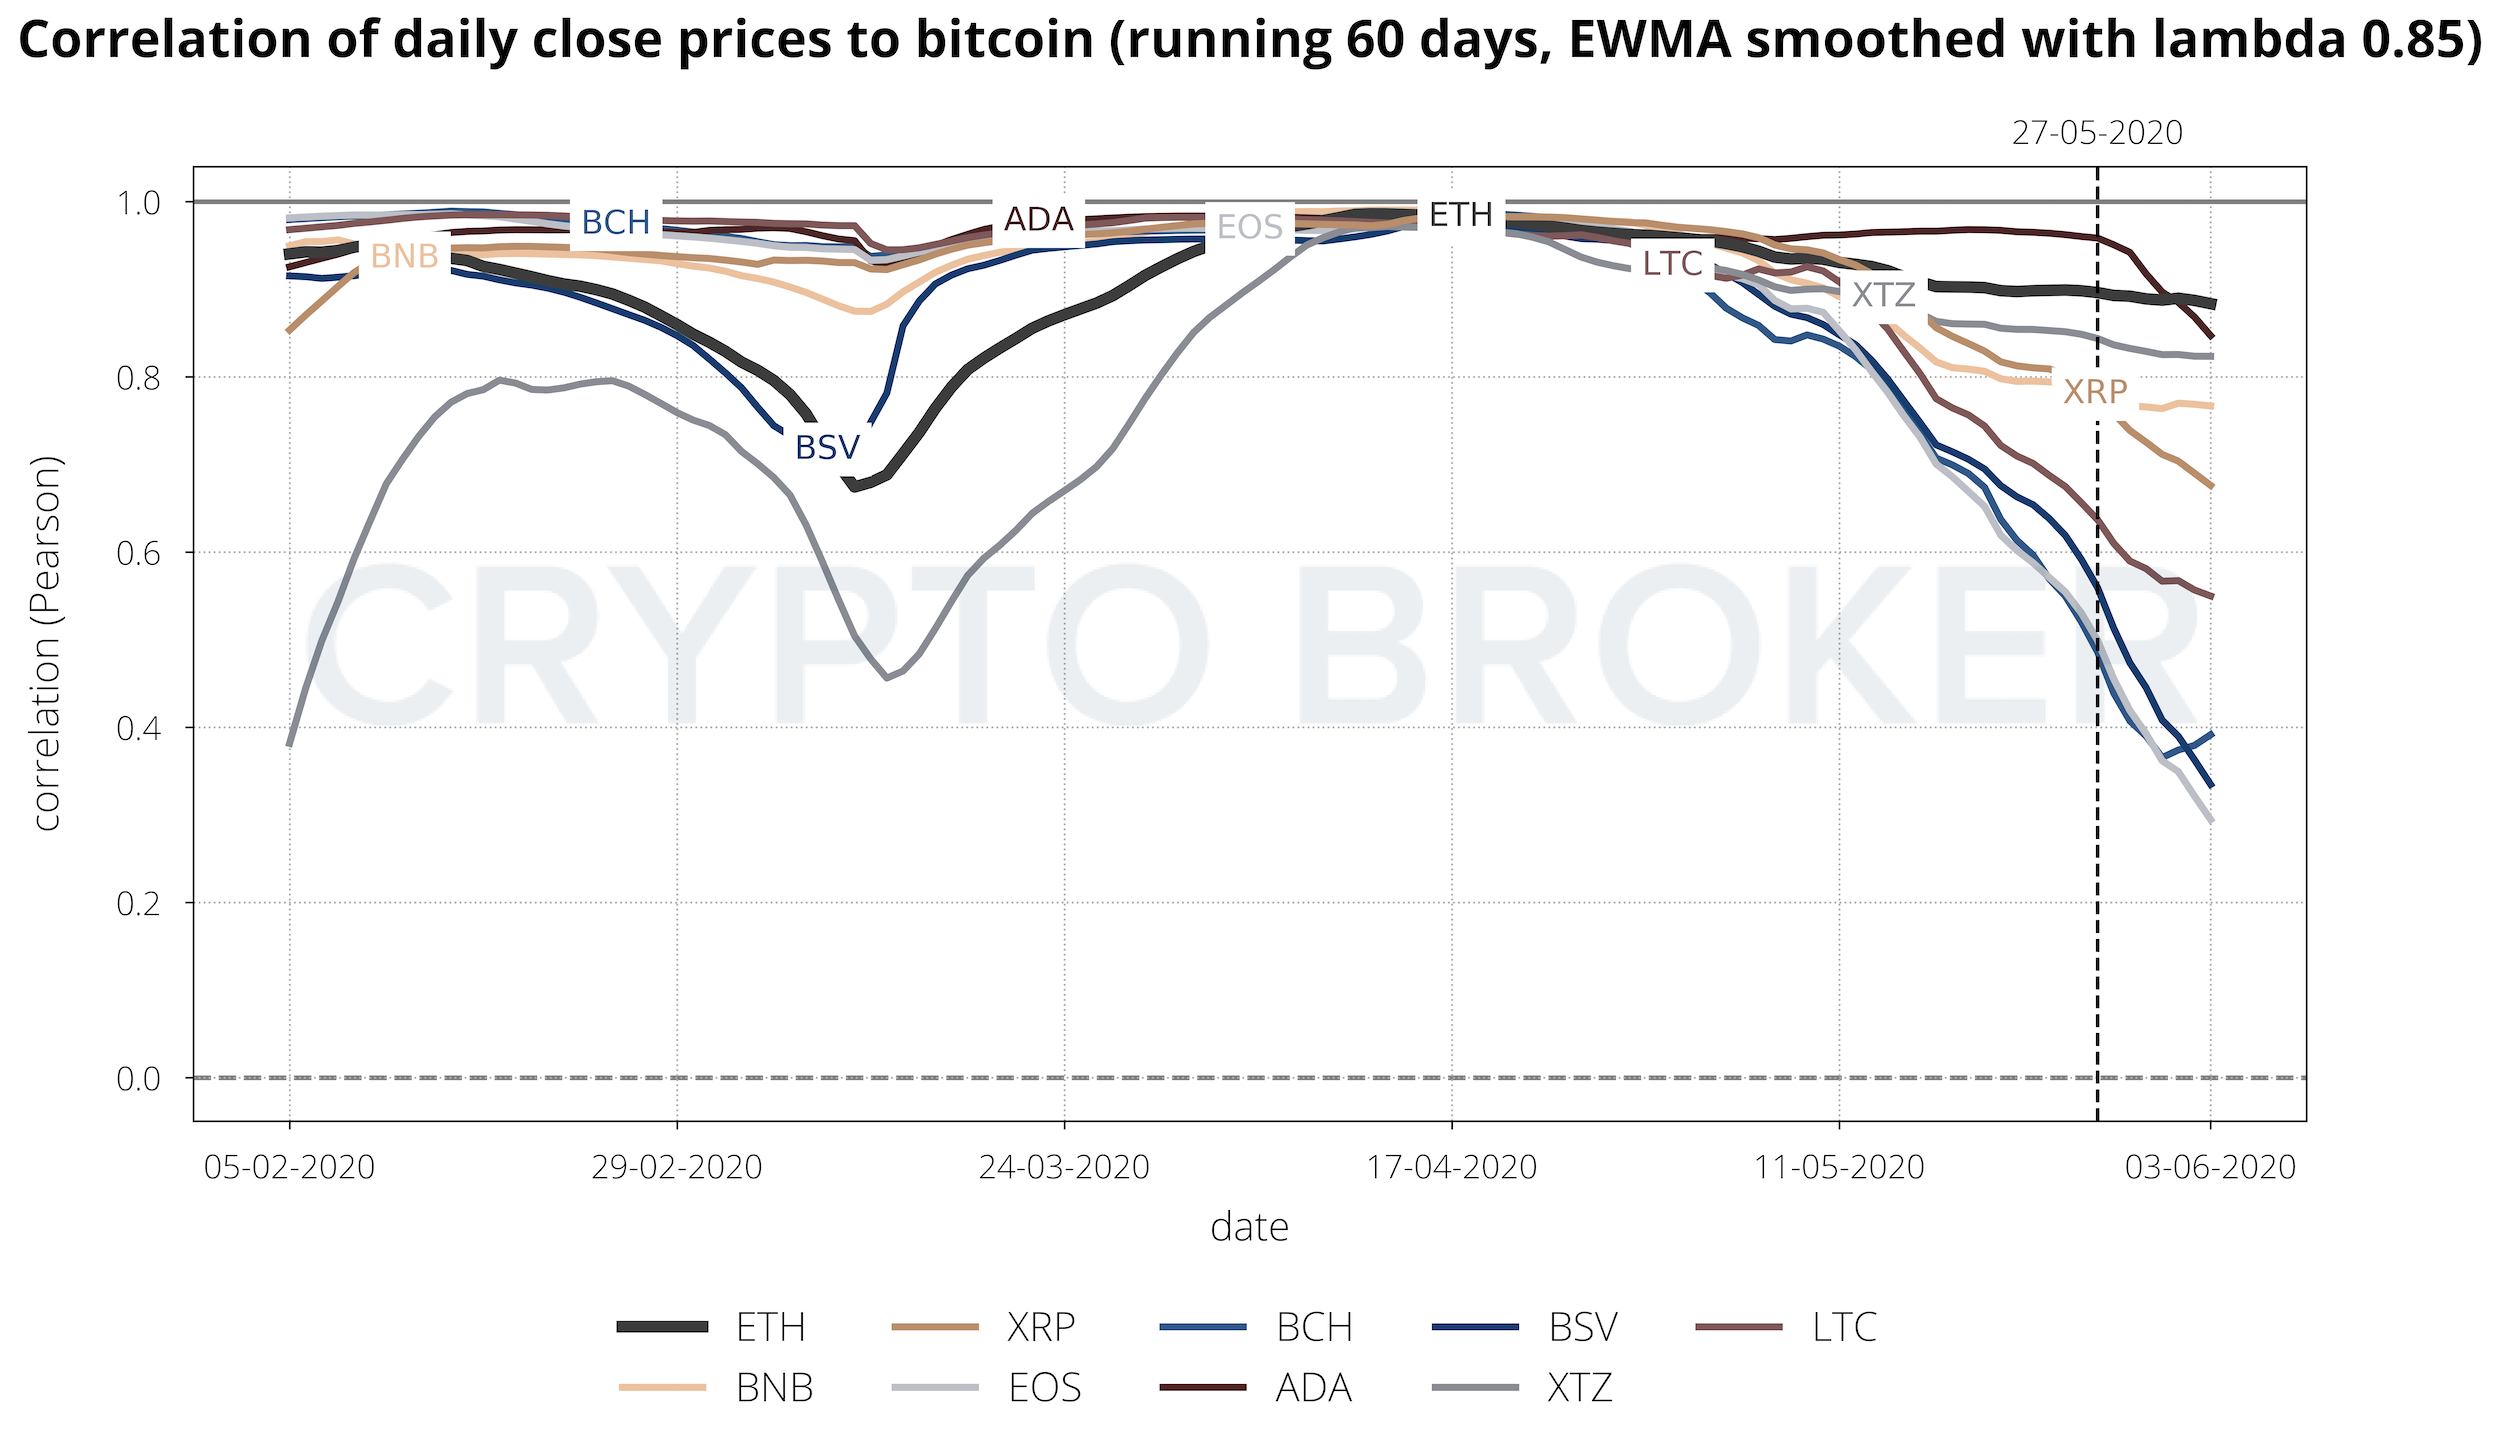
4 Volatility and Correlation Comparison
5 ETHBTC 4h Technical Chart Analysis
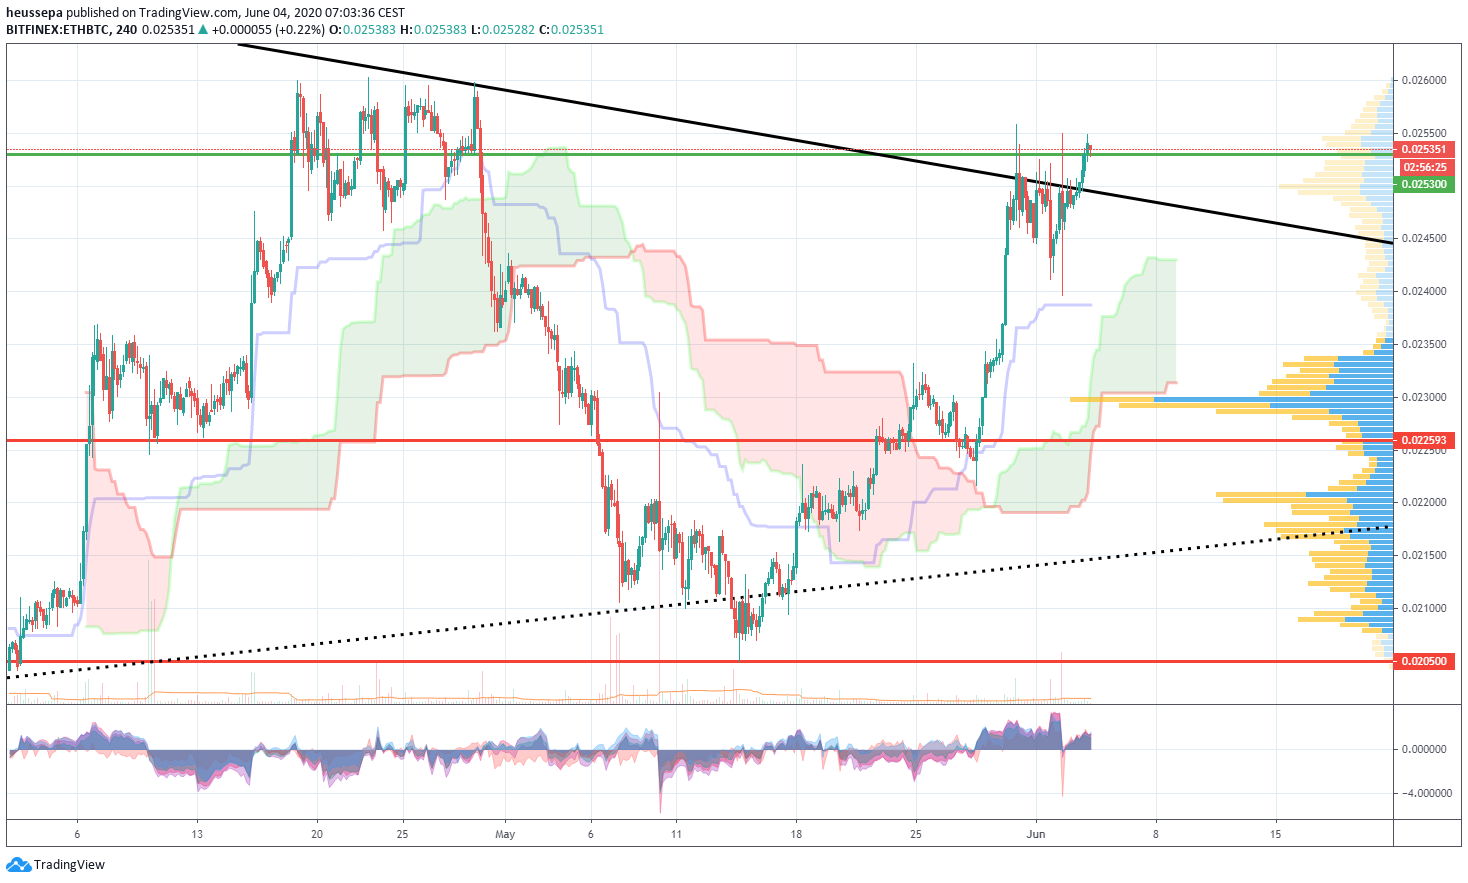
Target reached!
The price pushed through the 0.02300 level accompanied by good volume. The afterburner was even stronger, and nearly catapulted us through the 0.02530 resistance level.
After a few days of consolidating, it looks like the trend is going to resume. To get a better picture, though, we also need to zoom out and have a look at the daily chart. As you can see the 0.02530 support/resistance level has quite a history. I believe it will be significant when we print a daily closing above that level. In terms of the medium-term outlook, I expect to see the price push towards 0.03060.
The chart and fundamentals are looking strong, and, currently, there are no visible signs of the situation becoming overheated.
View the charts: ETHBTC 4h & ETHBTC daily
6 Market Cap Overview
Glossary
Advance Decline Line - the Advance Decline Line shows the ratio of coins for which the market cap increased relative to the market cap of BTC for each day.
ATH - all time high (maximum lookback period of 730€ days).
Data Source - tables and charts are based on daily close prices provided by Coinmarketcap.
EWMA - exponentially weighted moving average.
MACD - moving average convergence/divergence is a popular technical indicator to identify trends in the underlying instrument. It consists of the MACD and signal line, and the area shown in the background. The MACD line (strong) is the difference of two exponential moving averages, which are defined by the first and second parameter of the indicator. The signal line (weak) is the exponential moving average of the MACD line defined by the third parameter. The area in the background illustrates the difference between the MACD line and the signal line.
Pearson Correlation - quantifies the linear relationship between two variables.
Spearman Correlation - quantifies the monotonic relationship between two variables. As such, the Spearman Correlation is based on the ranked values of each variable and is used to detect non-linear relationships between the two.
About the author
Patrick Heusser is Head of Trading at Crypto Broker AG. Prior to joining the company, Patrick worked as an Interest Rate Trader at UBS and held various positions in the IRCC (interest rate, commodity and foreign exchange trading) in London, New York, Singapore and Zurich. Patrick is an expert in trading and risk management. He also gained experience in other areas, such as building start-up companies. Patrick has a degree in banking from a business school. He has also taken various courses in technical chart analysis.
Related Articles


