
Bitcoin USD daily Basis
Bitcoin USD Chart Analysis - Consolidation Below the 50,000 Mark
The reporting week was characterized by a consolidation phase, which took place just below the significant resistance zone 50,000 USD. After two days of a “breather” at the newly climbed level of the previous week, Bitcoin tried to conquer the areas of the 50,000 USD mark on Monday. Although a new daily high of 50,505 USD was reached during the course of the day, the price corrected back to 49,294 USD by the end of the day, and thus fell back below the resistance zone. Accordingly, some closure sales occurred on Tuesday, which led the price back to 47,699 USD by the end of the day. On Wednesday, a recovery set in, bringing the price back to 48,962 USD. Renewed declines took Bitcoin to its low for the week at 46,867 USD on Thursday. An incipient countermovement on Friday ensured a daily close at the level of the previous day's opening price. This stalemate remained until the weekend and so the price moved around the area of 49,000 USD also at the end of the week.
Breakout from upper range of three-month price corridor leads to path-breaking resistances
Daily Interval Review
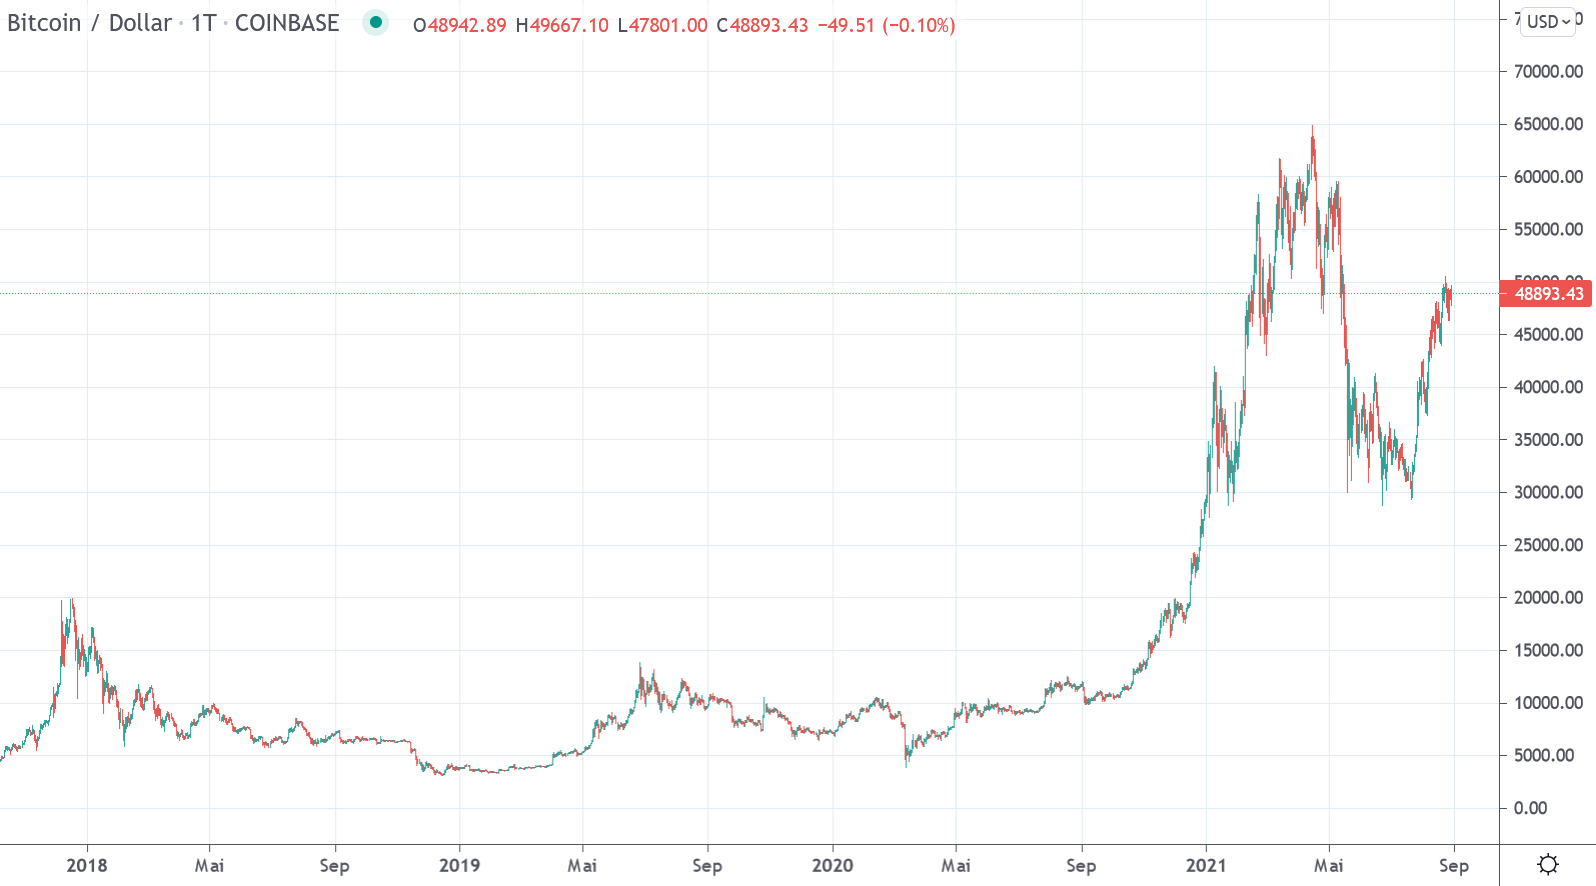
After the price plunge in mid-March 2020, a veritable countermovement established itself. This led to the resistance zones above 10,000 USD. After an initial rejection, and a consolidation phase lasting almost two months, a breakout through the fundamental resistance zone followed on July 27, which had been established since August 2019 and had already caused Bitcoin to fail a few times to date.
The resistance zone around 10,000 USD was interesting in several respects. On the one hand, the 0.618 Fibonacci point of the entire downward movement, which was initiated at the end of June 2019 just below 14,000 USD, is located here. On the other hand, the zone around 10,000 USD simultaneously acted as a confirmation of the still bearish trend from lower highs since December 2017 (see macro view on a weekly basis). Bitcoin was able to establish itself above the newly created support in the 10,000 USD area since the end of July 2020 and provided a first confirmation of a trend reversal with the break of the resistance zone around 12,200 USD towards the end of October 2020. In the following weeks, the positive trend accentuated and led Bitcoin through the 14,000 resistance in early November 2020 and close to the then all-time highs around 20,000 USD for the first time in early December, which remained untouched for 158 weeks since the bull market in 2017.
Since the breakout through the important 14,000 resistance at the beginning of November, it has been blow by blow. The breakout through the old all-time high at 20,000 USD saw a strong accentuation of the uptrend, which saw the Bitcoin price mark its new all-time high just below 65,000 USD on April 14. The rapid upward movement was so far characterized by 3 corrections, each of which found its low point around the 50-day average (light blue line). However, the fourth correction led for the first time clearly below it and thus it also came to a violation of the trend line, which has served as support since the beginning of the year, formed by the respective daily lows. In recent weeks, this resulted in an accelerated downward trend, which led below important support zones. Subsequently, the price consolidated in the corridor 30,000 – 40,000 USD for three months until the recent breakout from the upper range of the corridor.
Outlook
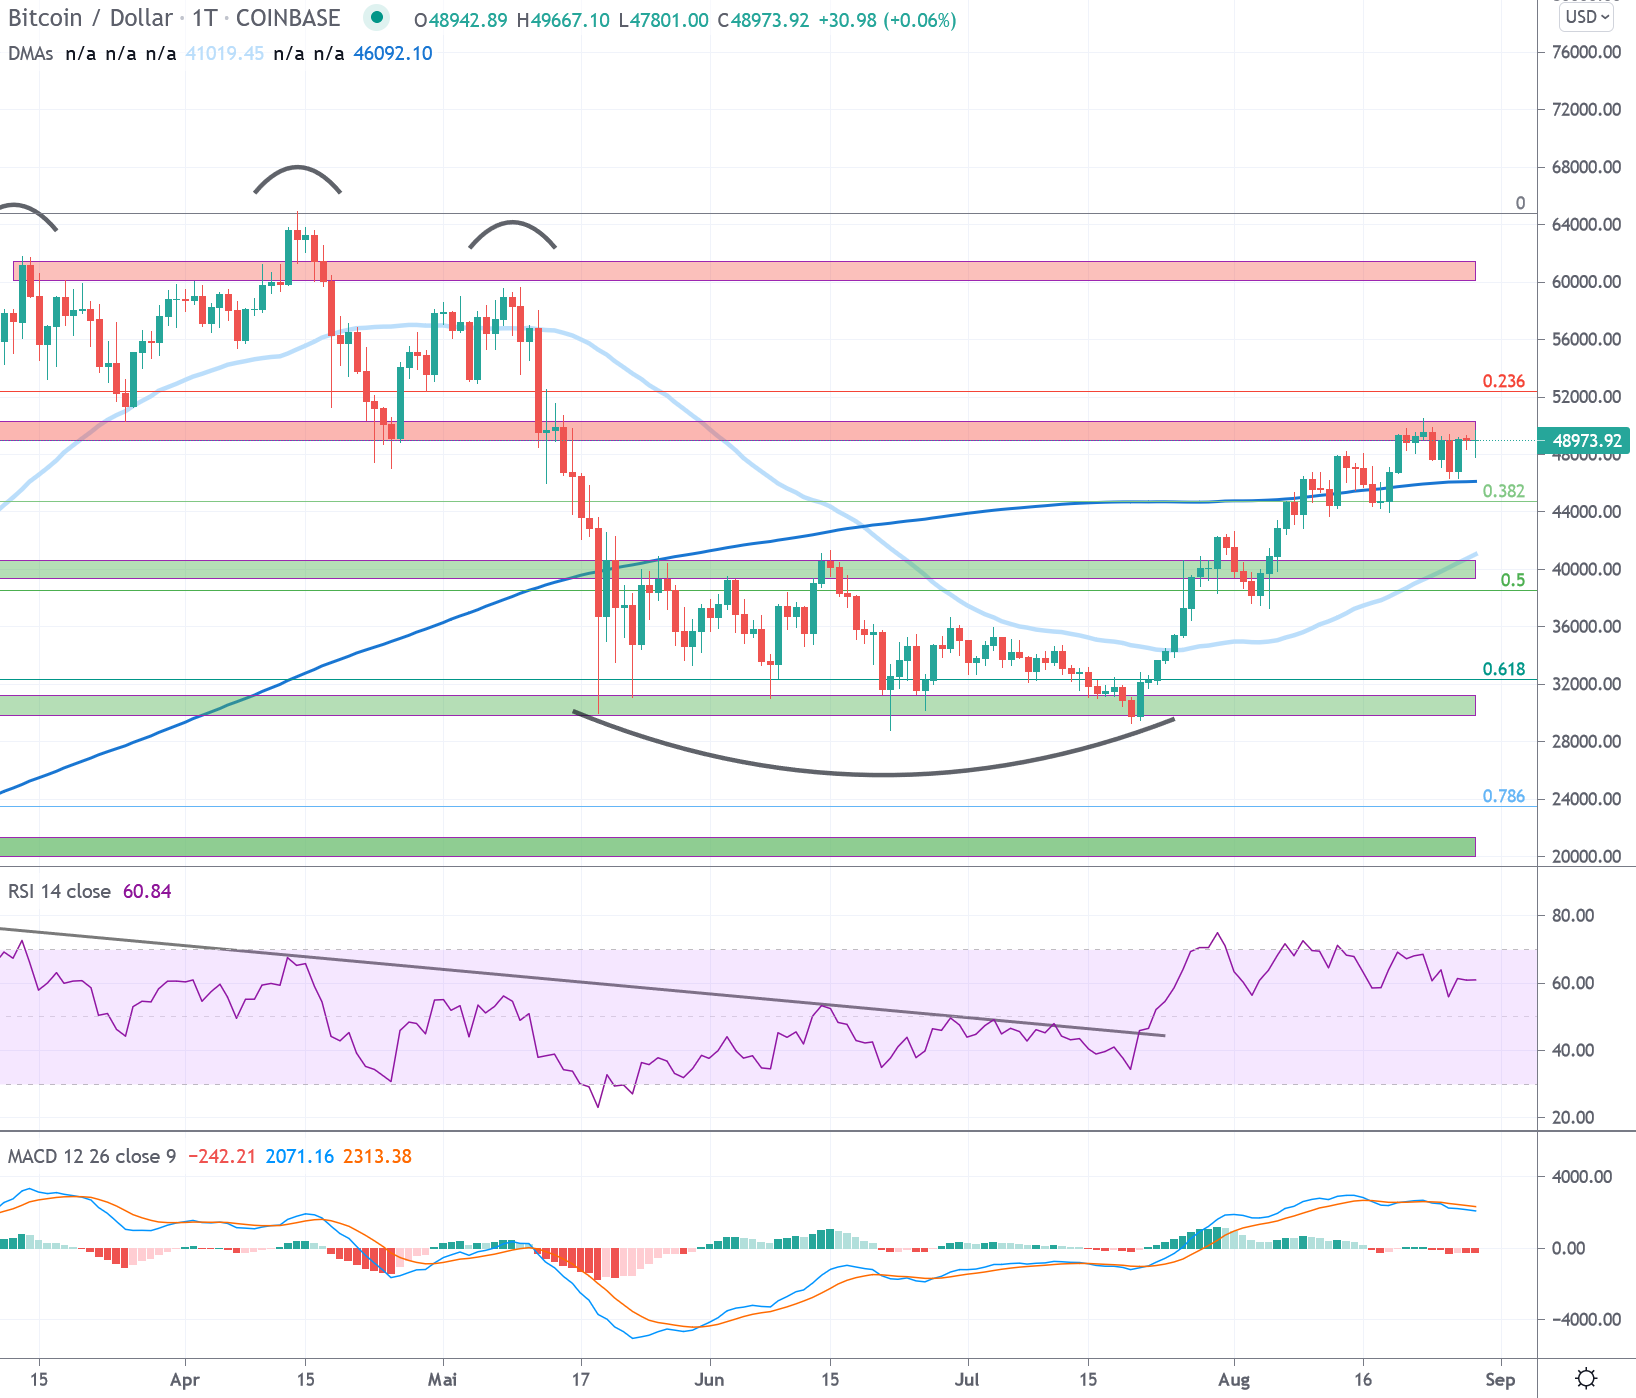
For the first time, we are above the 11-week price corridor 30,000 – 40,000 USD. A "rounding bottom scenario" in the area of the 0.618 Fibonacci point, which is calculated between the start of the rapid uptrend and the new all-time high, has manifested itself in a strong upward movement.
The impressive counter-movement that followed the last failed attempt to break the 30,000 USD support zone came determined and shaped the current positive market environment. The continued bullish price action takes Bitcoin right back to the 50,000 resistance level and back to the area above the 200-day moving average.
As expected, Bitcoin tested the 50,000 USD resistance zone again during the reporting week. This zone served as support several times between February and May and is therefore to be classified as significant resistance. The aforementioned breather is underway and a stalemate is forming just below the important resistance zone. A direct breakout would be a strong sign and suggests an imminent test of the all-time high. An incipient correction is not a leg-breaker for the time being and should not lead back to the zones below 42,000 USD for a sustained positive picture. A prolonged consolidation below the 50,000 area, coupled with lower daily closing prices, also carries the risk of an establishing "bull trap".
New all-time high or risk of a bull trap

Review Weekly Interval
Bitcoin was able to set a higher high above 10,000 USD for the first time in the weekly interval in 2020, which broke the prevailing bearish trend since December 2017. This broke the series of lower highs that lasted for 135 weeks (1).
Since this first overcoming of the bearish trend, the signs for a valid trend reversal intensified. With the push through important resistance zones and a continuous development above the 21-week average (2), the probabilities for a renewed reaching of the all-time high created in 2017/18 increased visibly. This was accomplished in mid-December 2020. This was followed by a strongly accentuated price discovery above this historical mark, which produced a new all-time high of 65,000 USD in mid-April. A consolidation initiated since then ended in a veritable price slide that brought Bitcoin back to the 30,000 USD mark in just two weeks. A subsequent breakout from the 10-week 30,000 - 40,000 USD consolidation area will bring Bitcoin back to the 50,000 USD resistance.
Outlook
The price movements in the past year created a good foundation to sustainably climb to new spheres beyond the all-time highs reached in 2017. The break of the 20,000 USD mark impressively demonstrated the power of the upward movement that has been established since October. The rapid price increase was now abruptly interrupted with a price drop, which even brought Bitcoin below the 21-week average (2) that has defined reliable bull or bear market phases in the past.
Bitcoin was able to leave behind the three-month correction phase in the 30,000 - 40,000 USD zone. The consolidation took place in the interesting 0.618 Fibonacci area since the start of the bull market. After breaking out of the upper price band of the three-month corridor, a continued significant counter-move took the price back to the 50,000 USD zone within the past 3 weeks while negating a forming shoulder-head-shoulder formation.
With the holding of the 30,000 USD support in the 0.618 Fibonacci zone, a scenario of a continuing price development, which eventually leads beyond the existing all-time high, remains intact. Such a scenario is reinforced by sustained price action above the 40,000 support zone and a recapture of the 21-week moving average over the near term. A presumed "make it or break it" situation is emerging in the current price area in the following weeks. Here, the market decides whether a price discovery above the all-time high should take place or whether the current upward movement below the all-time high ends in a "bull trap" as in January 2018.
Disclaimer
All information in this publication is provided for general information purposes only. The information provided in this publication does not constitute investment advice and is not intended as such. This publication does not constitute and is not intended as an offer, recommendation or solicitation to invest in any financial instrument, including cryptocurrencies and the like. The contents contained in the publication represent the personal opinions of the respective authors and are not suitable or intended as a basis for decision-making.
Risk notice
Investing in cryptocurrencies, is fundamentally associated with risk. The total loss of the invested capital cannot be excluded. Cryptocurrencies are very volatile and can therefore be exposed to extreme price fluctuations in a short period of time.

