
Bitcoin/USD daily basis
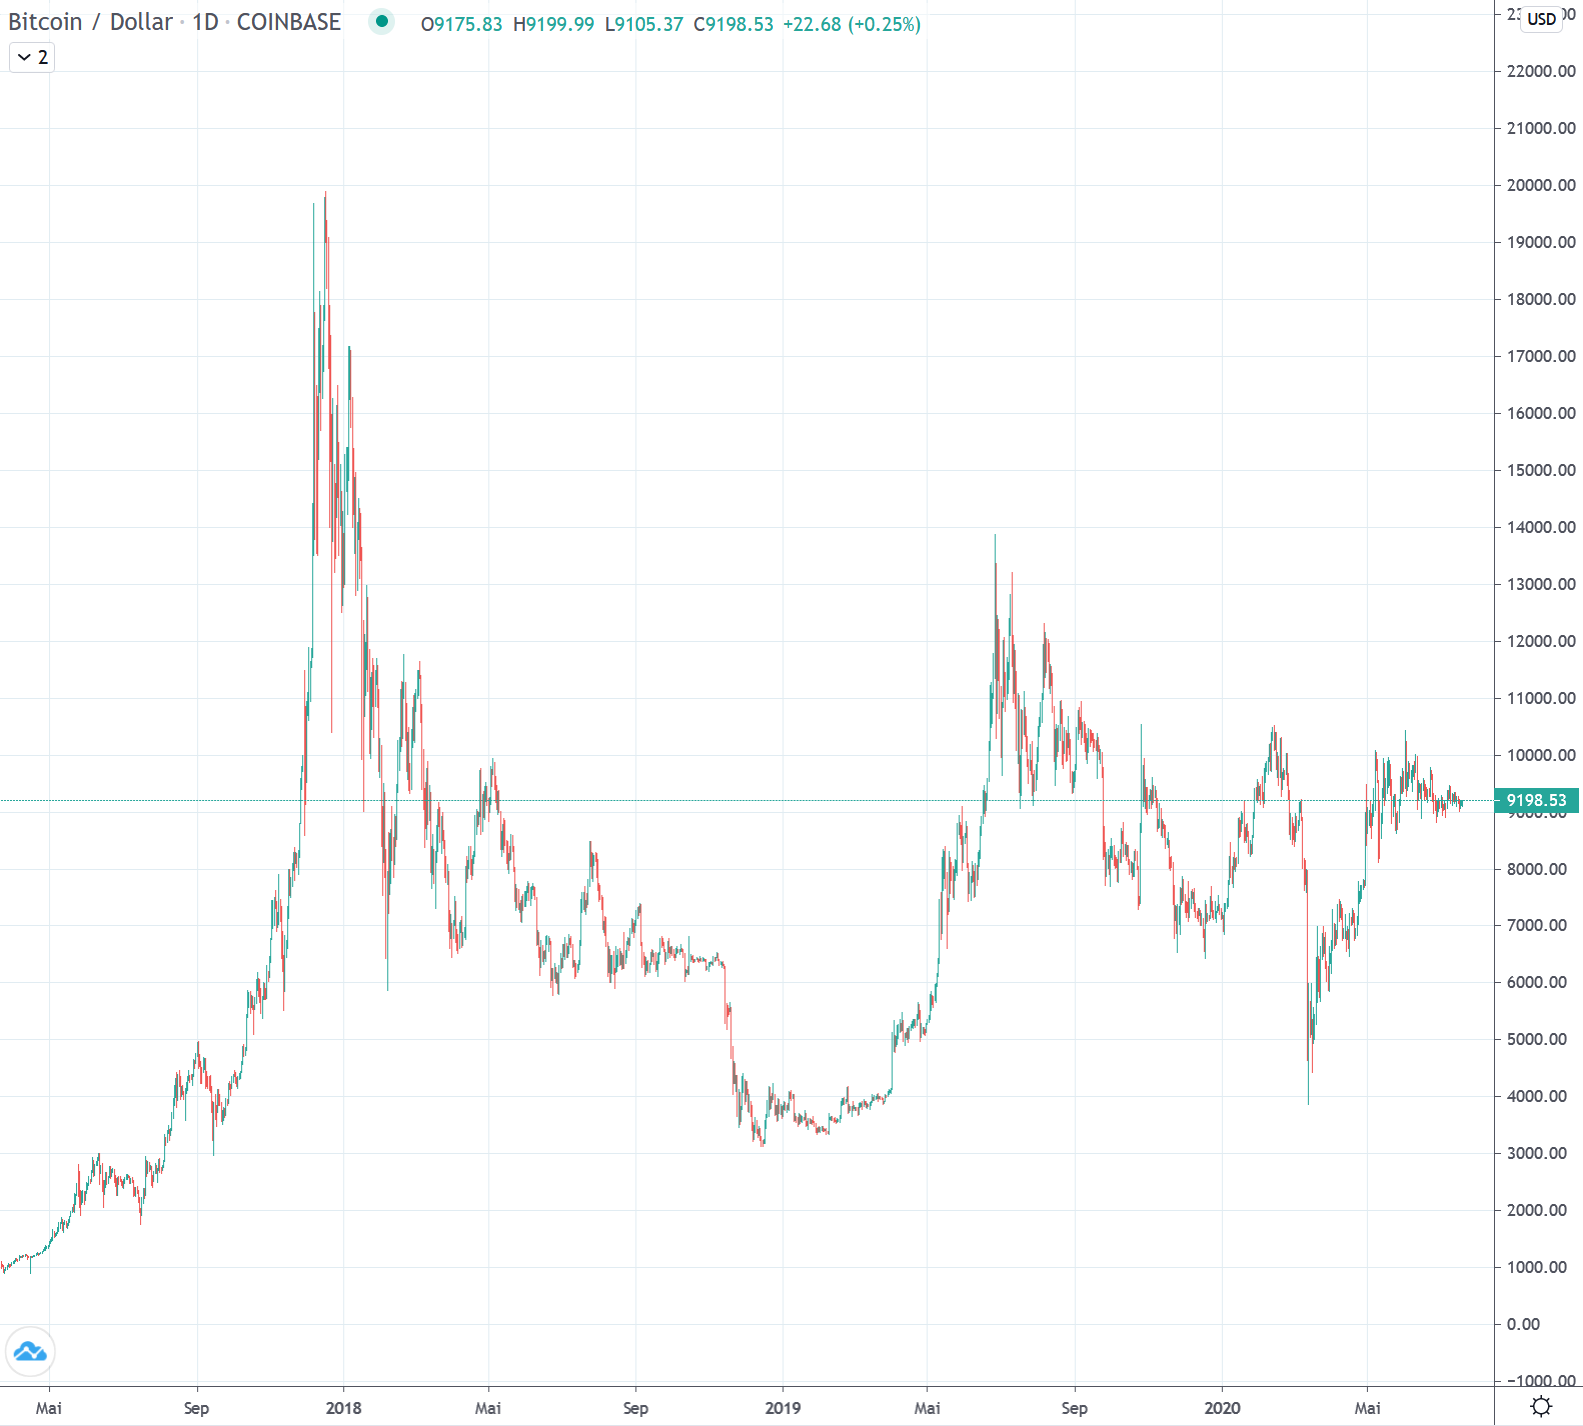
Bitcoin USD – The 9’200 USD magnet
Another week of very narrow trading ranges is moving in. The USD 9,200 mark acted like a magnet. The first three days of the reporting week were marked by slightly lower daily highs and lows. On Thursday, a brief outlier marked the week’s low just below USD 9,000. The price recovered in line with this trend in the days that followed and has since returned to USD 9,200. The stalemate between bulls and bears continued for another week.
Advancing to well-known resistances in micro and macro trends
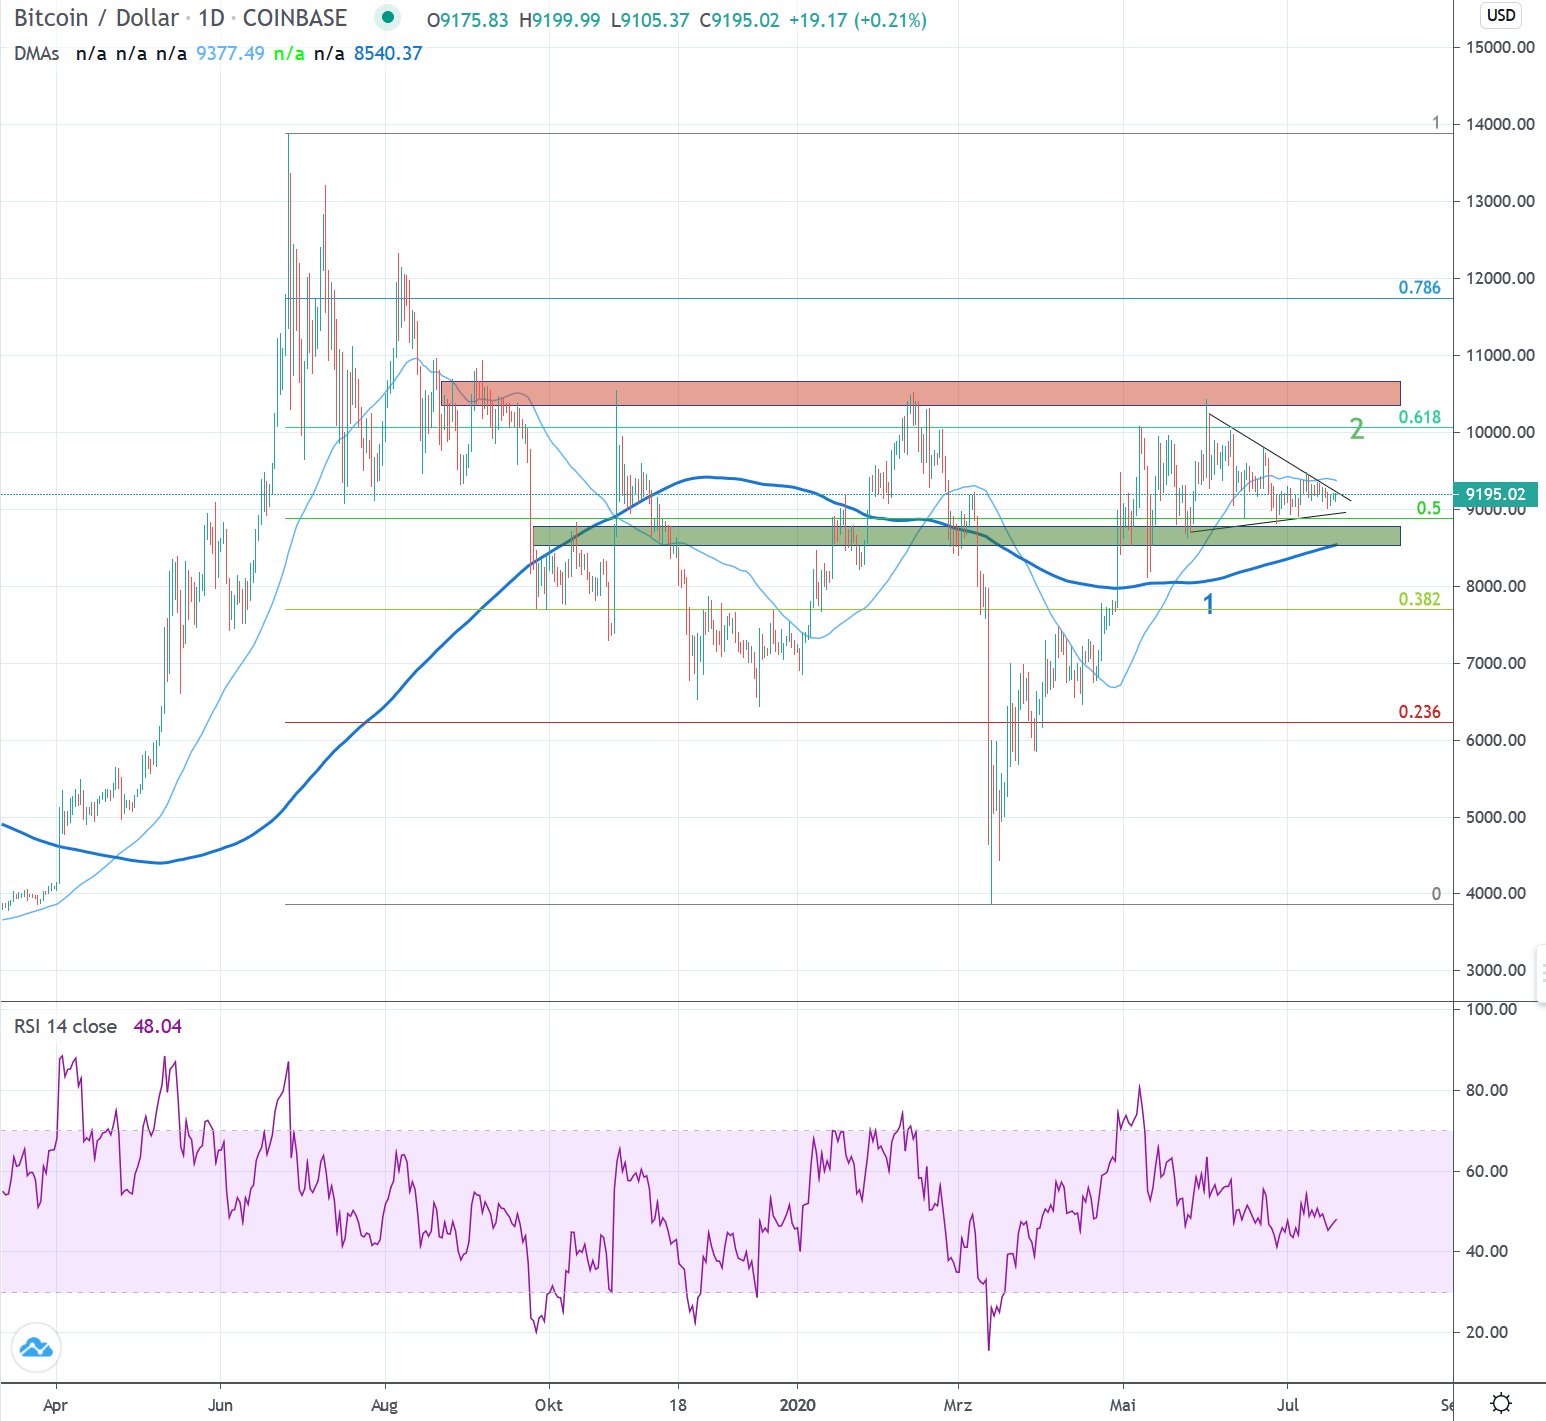
A veritable countermovement established itself after the price slump of mid-March. This led up to the resistance zones around USD 10,000 (red). This was followed by a first rejection, which brought the price back to the 200-day average (1), just over USD 8,000. In the meantime, further attempts to climb to the area beyond the USD 10,000 level have failed. Ignoring the intraday outliers of 10 and 11 May, Bitcoin has been trading within the USD 8,500 – USD 10,000 zone for over two and a half months.
The resistance zone around USD 10,000 is interesting in several respects. On the one hand, the 0.618 Fibonacci point (2) of the entire downward movement, which was heralded at the end of June 2019 just below USD 14,000, is located here. On the other hand, the zone around USD 10,000 simultaneously functions as a confirmation of the still bearish trend of lower highs since December 2017 (see next section).
The importance of the resistance zone is also reflected in the trading range that has been taking place within the USD 8,500 – USD 10,000 zone since the beginning of May. Since the beginning of June, a trend of lower daily highs can be observed. The support zone around 8’500 USD (green) remains to be observed. The 200-day moving average (1) is now also just below 8,500 USD. The positive structure of the micro-trend since the March low is endangered with a renewed test of the zone 7’500 – 7’700 USD. The zone around USD 7,000 can serve as a last support before the confident build-up suffers lasting damage.
Macro: On the threshold of a trend reversal

Bitcoin has so far failed to set a higher high in the weekly interval, which would have broken the prevailing bearish trend since December 2017. In its last attempt since the beginning of the year, the upward trend in the relevant zone at around USD 10,500 failed to establish itself. The countermovement that began in mid-March after the sharp price correction brings the price once again to the trend line, which is the result of the lower highs since the end of 2017.
If the negative macro picture is to be broken, the tendency of lower highs since 2017 must be sustainably overcome. This should be legitimized with several weekly candles above the USD 10,000 mark in order to rule out false outbreaks such as those in July 2019. The current establishment in the new range looks sustainable and should take place in the coming weeks above the 8,400 – 8,700 USD zone, as well as above the 21-week average (1) in order not to cloud the new positive picture again.
If a renewed rejection to below the USD 7,000 zone were to occur, support in the lower range of the macro trend can be expected from the 200-week average (2) at USD 6,200, which has never been breached since its inception, and from the trend line (3) of the respective lows of the upward trend since March 2017.

