Close Menu
Crypto Valley Journal
    Facebook X (Twitter) Instagram
    Crypto Valley Journal
    • Hot Topics
      • News
      • Minds
    • Focus
      • Background
      • Blockchain
      • Legal & Compliance
      • Non-Fungible Token (NFTs)
    • Investing
      • Markets
      • Financial Products
      • Decentralized Finance (DeFi)
      • Exchange overview
    • Education
      • Basics
      • Glossary
      • Politicians on crypto
    • Statistics
      • Bitcoin-ETF-Flows
      • Ethereum-ETF-Flows
      • Crypto market data
      • On-chain data
    • Academy
      • Overview
      • Part 1: Blockchain
      • Part 2: Money
      • Part 3: Bitcoin
      • Part 4: Cryptocurrencies
      • Part 5: Decentralized Finance
      • Part 6: Investing
    • English
      • Deutsch
    Crypto Valley Journal
    You are at:Home»Markets»Technical Analysis»Technical Analysis August 11, 2020
    Technical Analysis

    Technical Analysis August 11, 2020

    By Patrick Heusser on 11. August 2020 Technical Analysis
    An overview of the trading activities on the cryptomarkets. Studies on traded volumes, supply and demand situations, as well as periodic technical analysis of the most important crypto-currencies and indices, including the perspective of Crypto Finance AG Senior Trader Patrick Heusser.

    Technical Analysis

    Good Morning!

    Let's go straight to the charts!

    BTC$ (daily)

    Technical Analysis

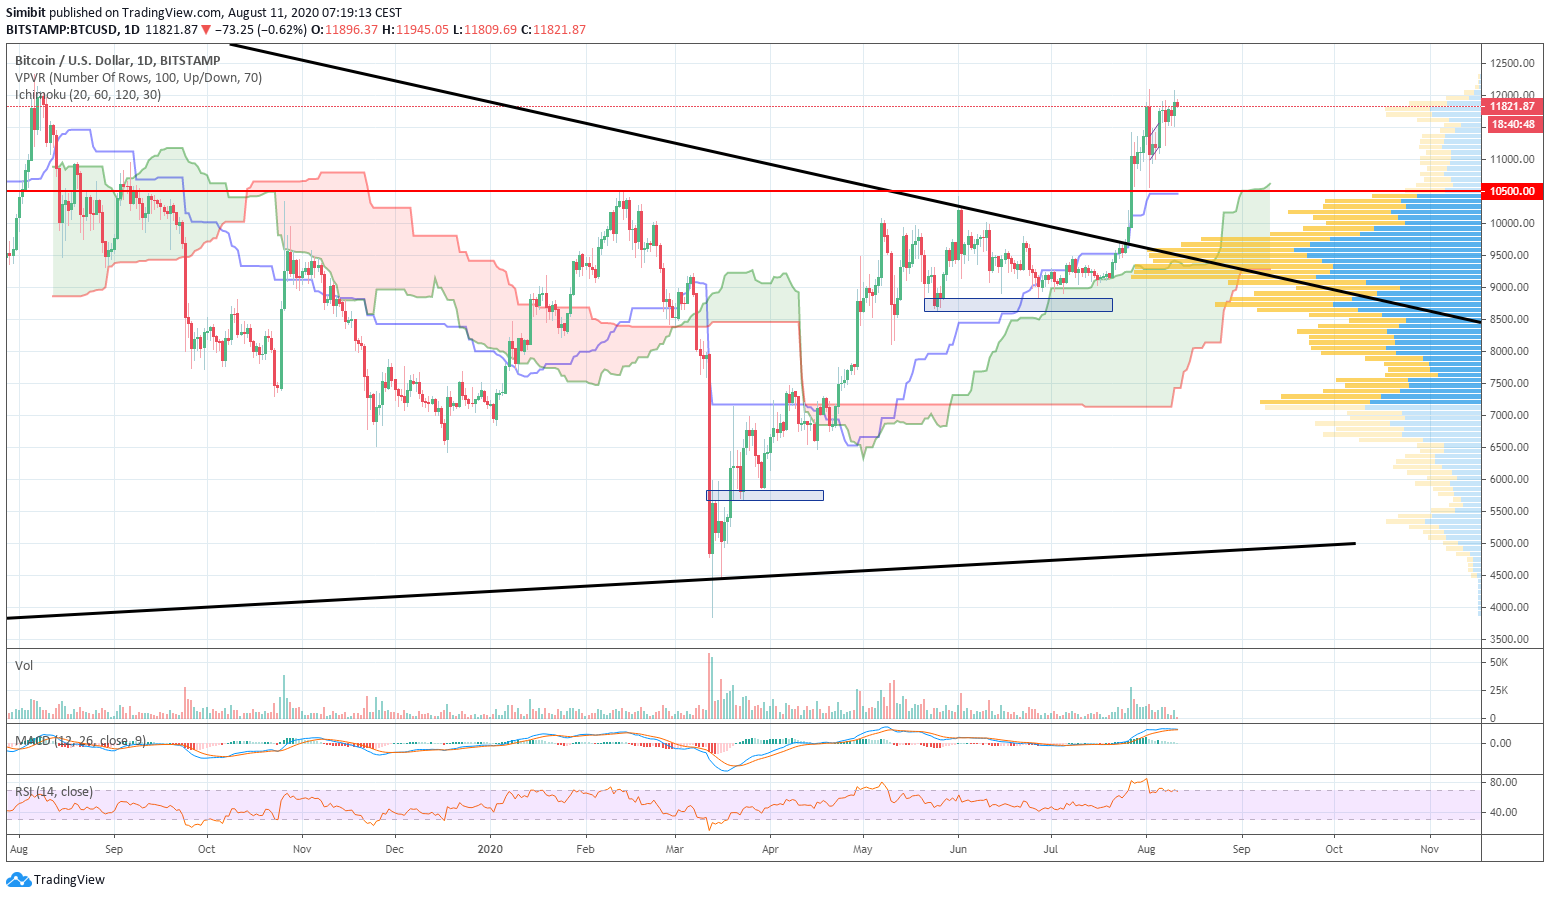
    There wasn’t much progress in terms of price this week, but we did see a healthy consolidation near the recent highs. The daily range is well defined between $10.5k and $12k, as is the tactical trading strategy: buy the dips as long as we stay above $10.5k, and chase the breakout when the daily close is above $12k.

    ETH$ (daily)

    Technical Analysis

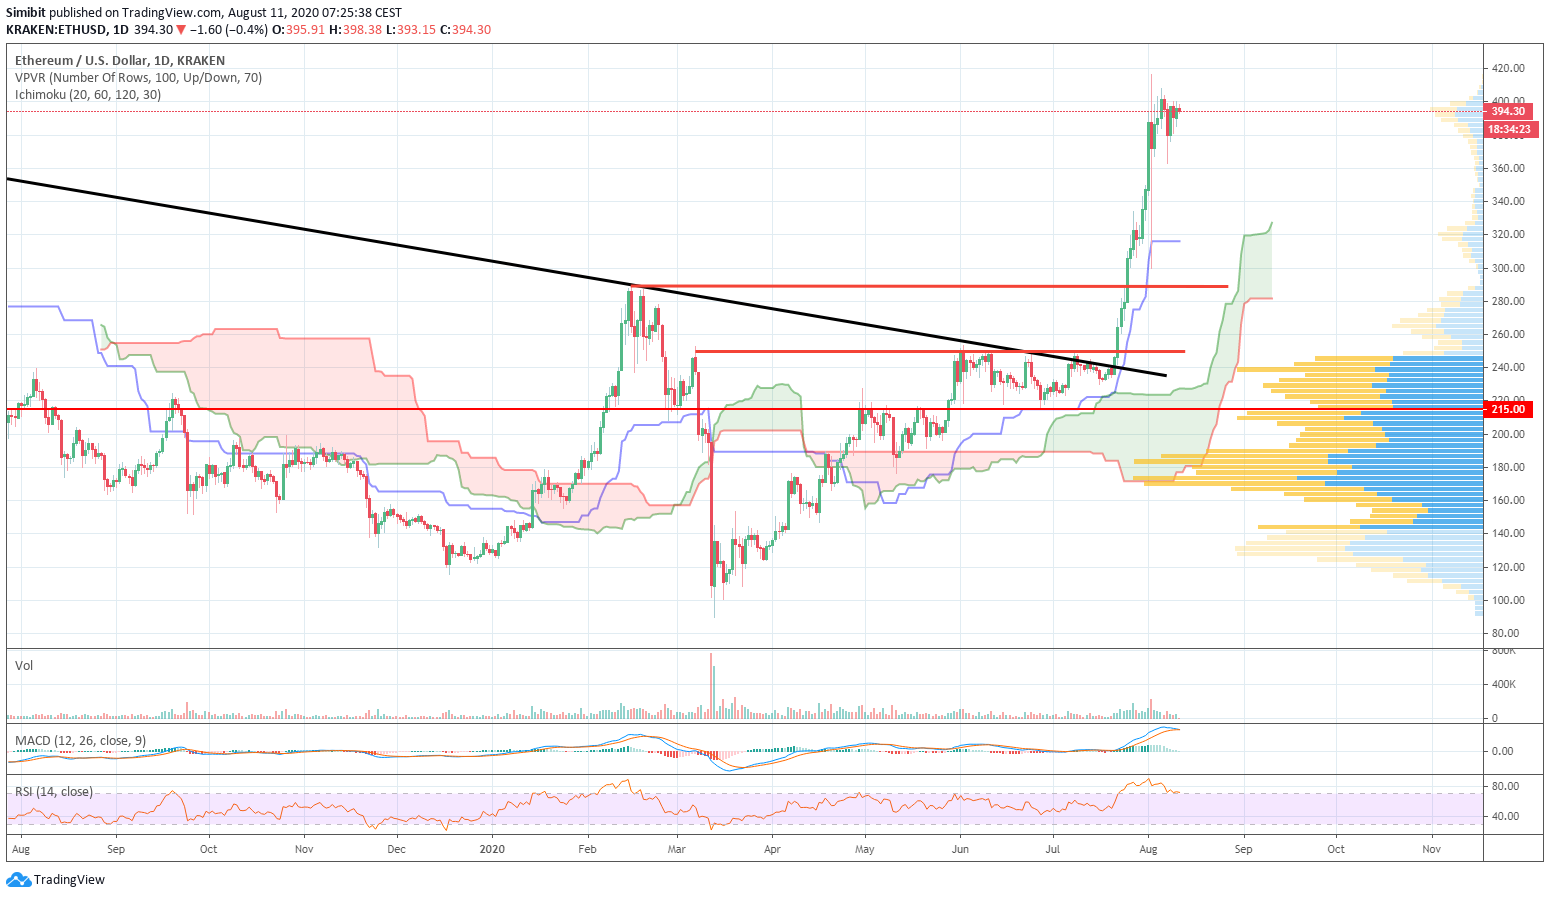
    The picture here is the same as it is for BTC$. There is a nice consolidation near the highs. The relevant levels for the bulls: the most recent intraday low of around $360 and the important support zone around $290-$300. On the topside, a daily close above $400 should pave the way for the next leg up.

    ETHBTC (daily)

    Technical Analysis

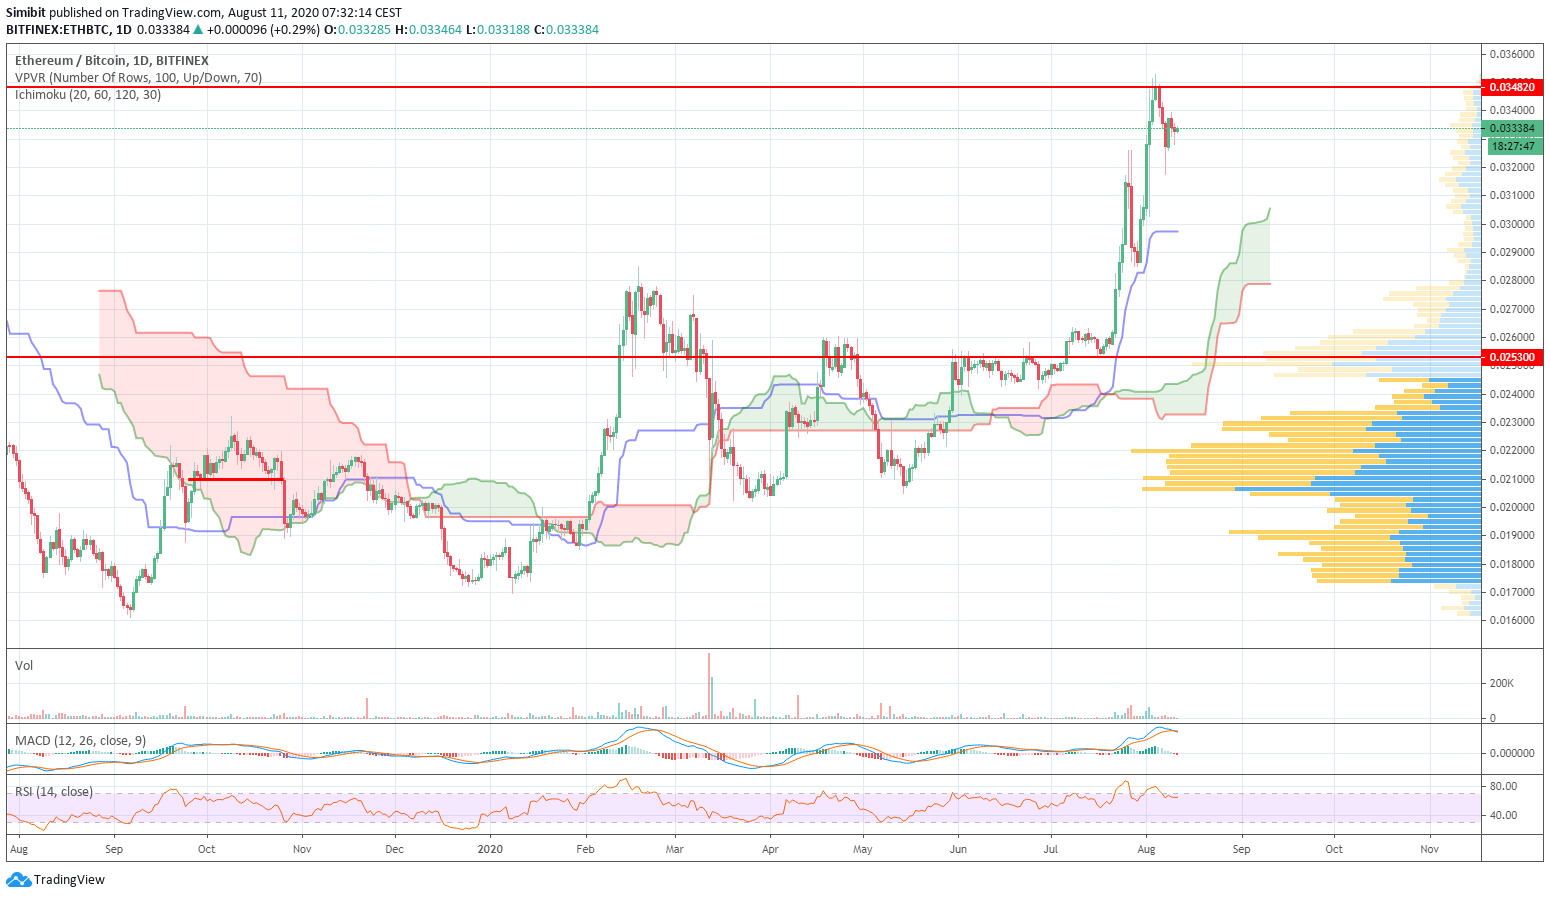
    As expected, the resistance at 0.0350 proved to be a tough one and the cross is taking a breath. I wouldn’t be surprised to see a fast dip down into the 0.0300 region, which should act as a strong support. A daily close above 0.0350 would open up the possibility for the next leg up to 0.0400.

    ALTPERP$ (daily)

    Technical Analysis

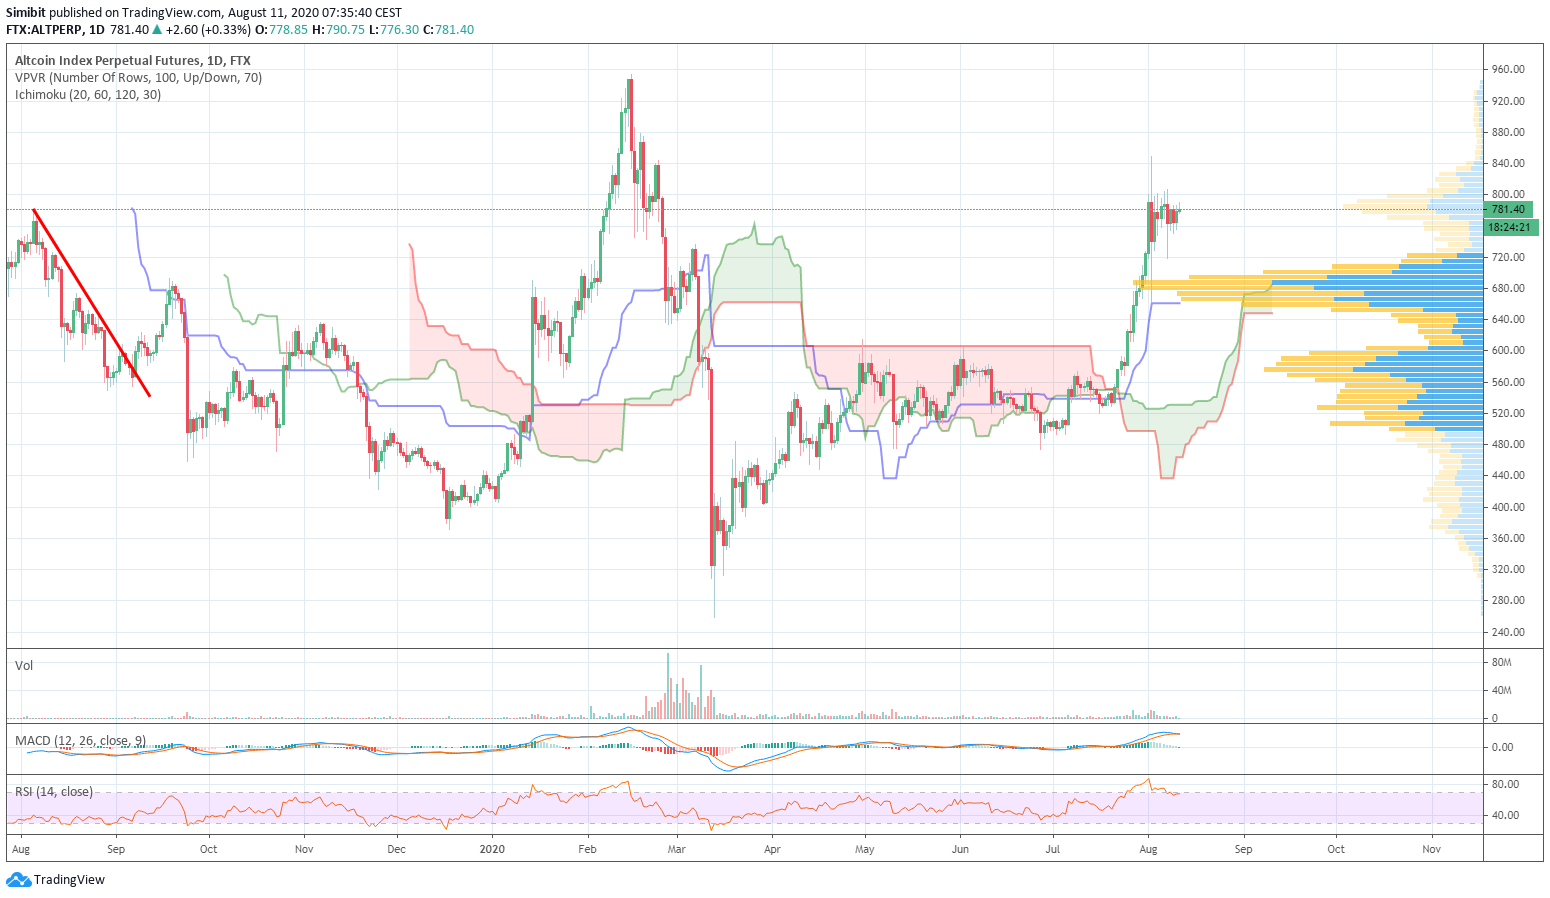
    We are seeing the same consolidation picture in the Alt Index. The $680 level should act as a strong support, whereas a close above $800 could push the index towards highs around $950.

    MIDPERP$ (daily)

    5

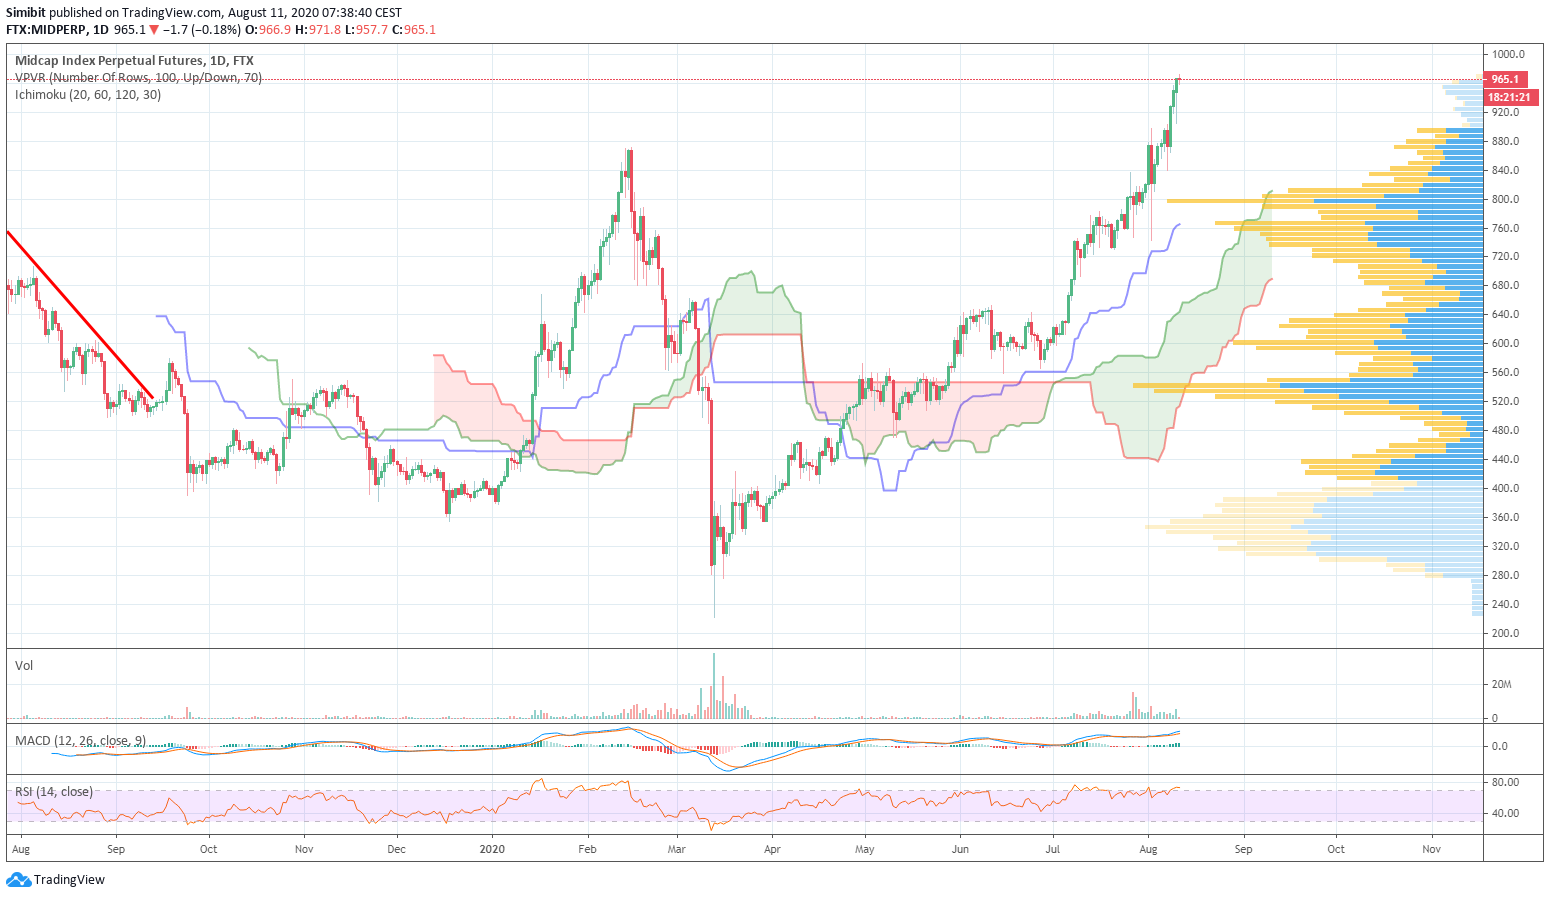
    We are seeing an entirely different picture in the Mid Index. It continues to push higher, setting new all-time highs on a daily basis (note: the index launched in July 2019). If you intend to buy the dips, $800 and $880 are the regions to do so in.

    SHITPERP (daily)

    6

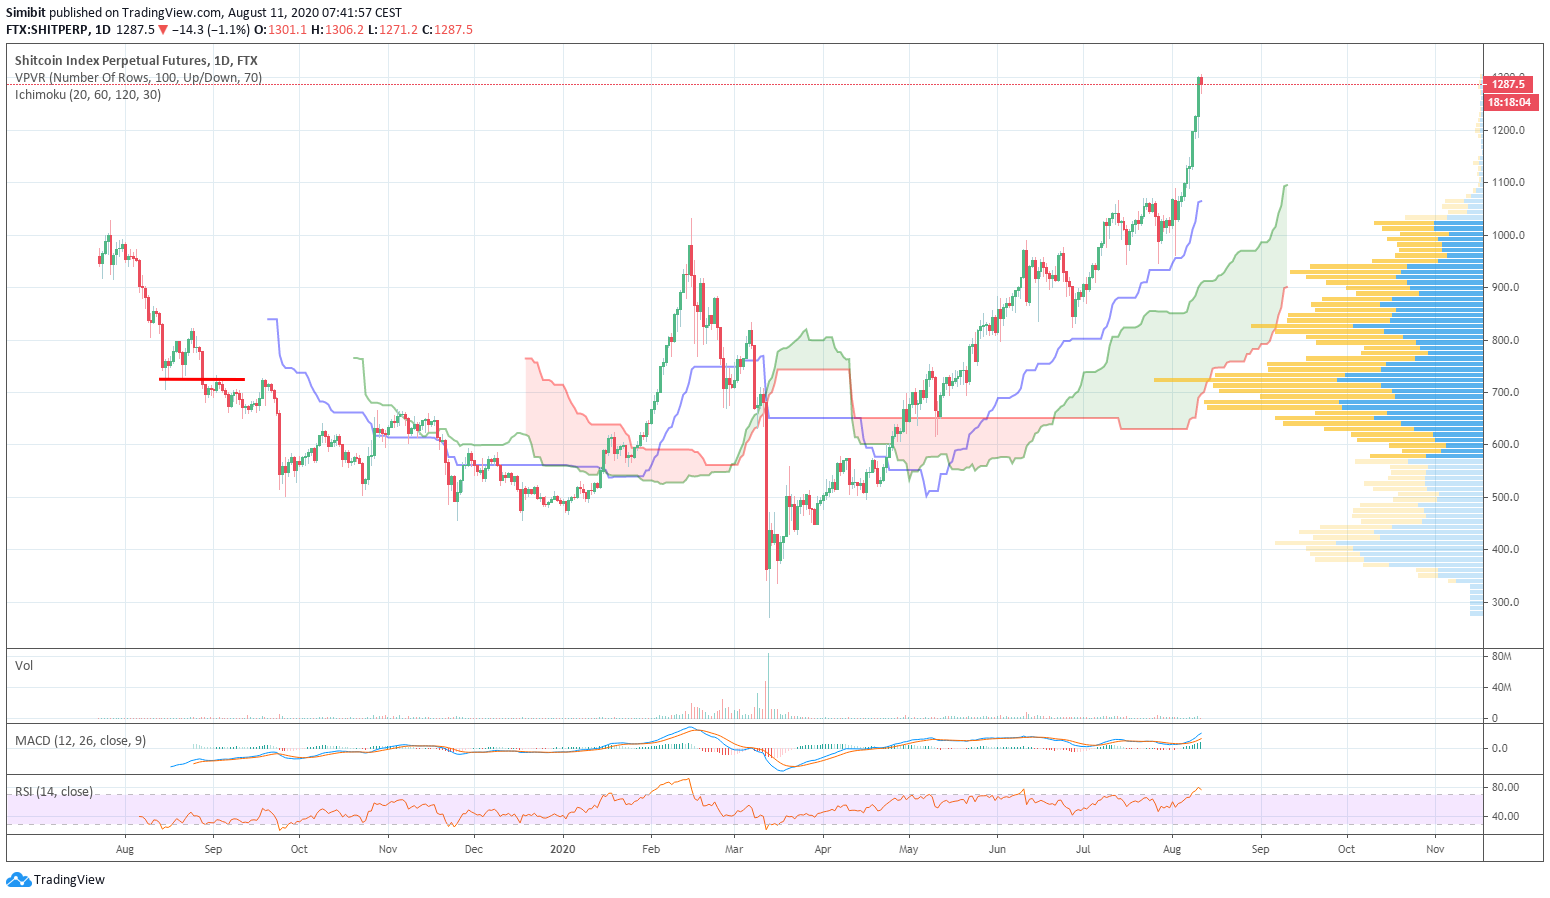
    The story is the same but stronger in the Shit Index. Just let it run…

    DEFIPERP (4h)

    7

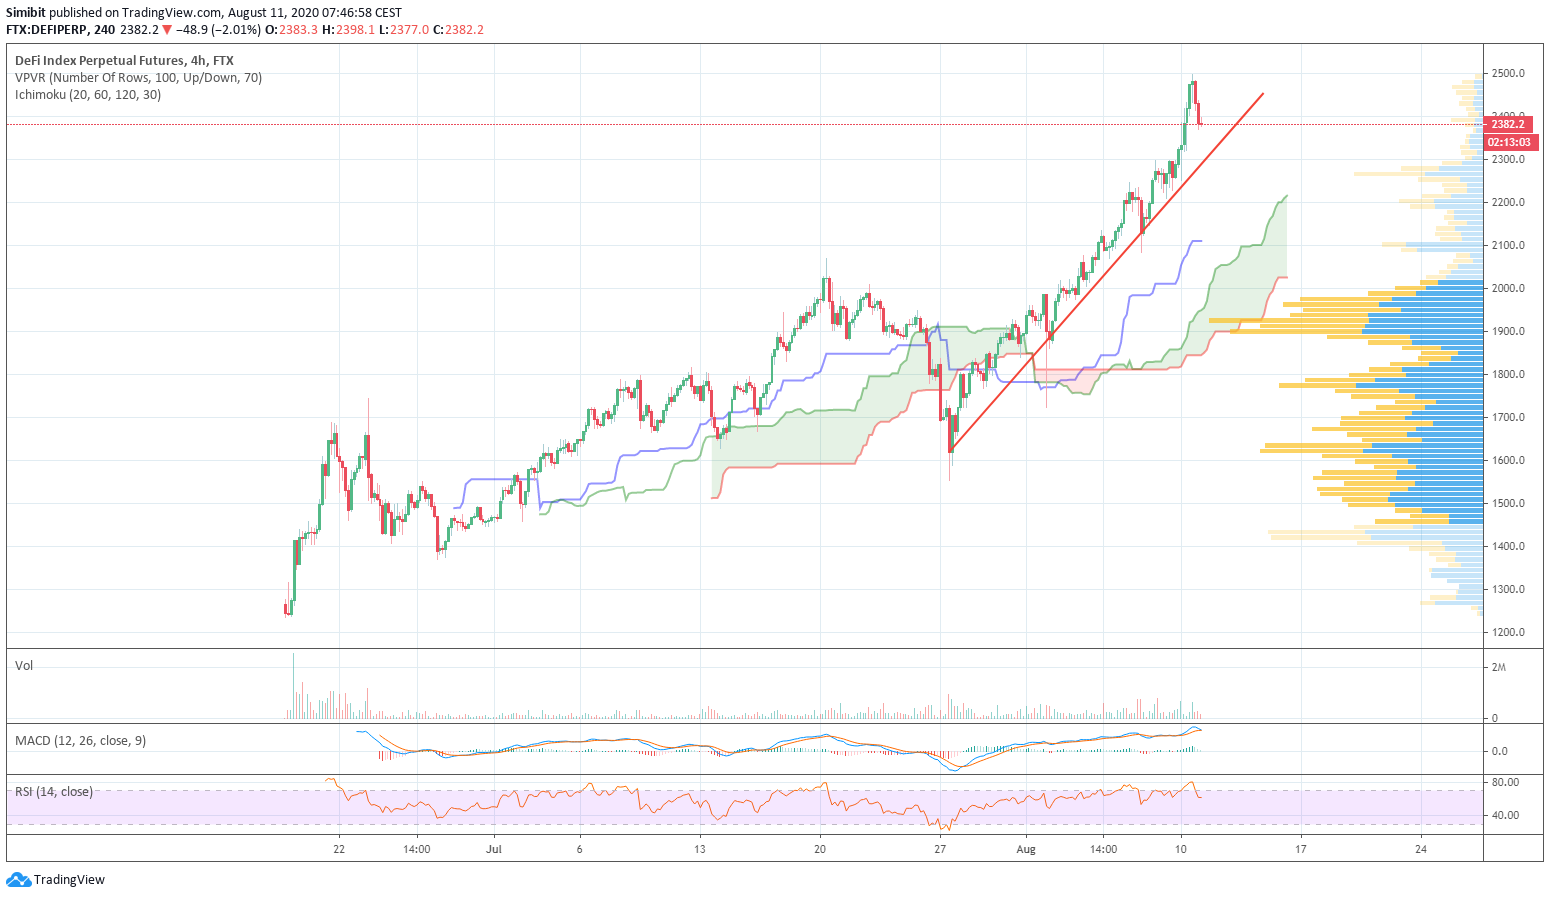
    You like things even more extreme? The Defi Index is still profiting from the recent DeFi hype. This index is in a very strong uptrend with a clearly defined support based on closing prices. I would exit any longs with a close below the trendline.

    Share. Facebook Twitter LinkedIn Email Telegram WhatsApp

    About the author

    Patrick Heusser

      Patrick Heusser is Head of Trading at Crypto Broker AG. Prior to joining the company, Patrick worked as an Interest Rate Trader at UBS and held various positions in the IRCC (interest rate, commodity and foreign exchange trading) in London, New York, Singapore and Zurich. Patrick is an expert in trading and risk management. He also gained experience in other areas, such as building start-up companies. Patrick has a degree in banking from a business school. He has also taken various courses in technical chart analysis.

      Related Articles

      technical chart analysis

      Technical Analysis August 23, 2022

      technical chart analysis

      Technical Analysis August 2nd, 2022

      Bitcoin USD

      Weekly Bitcoin USD chart analysis calendar week 24 – 2022

      Canada announces national crypto ATM ban. Roughly 4,000 machines are affected as Ottawa targets fraud and money laundering.
      29. April 2026

      Canada bans crypto ATMs

      OKX, BlackRock and Standard Chartered launch a joint framework that makes tokenized RWAs usable as margin collateral under G-SIB custody.
      29. April 2026

      OKX, BlackRock and Standard Chartered use tokenized treasuries as collateral

      Hoskinson calls support of the CLARITY Act by Garlinghouse and the XRP community insanity and accuses Ripple of harming the industry.
      28. April 2026

      XRP vs. Cardano: Hoskinson calls CLARITY Act support “insanity”

      twitter image button instagram image button linkedin image button youtube image button

      About Crypto Valley Journal
      About Crypto Valley Journal

      On the pulse of the movement

      • Academy
      • Contact
      • Advertising
      • About us
      • Partner
      • Imprint
      • Privacy
      • Disclaimer
      Search

      Type above and press Enter to search. Press Esc to cancel.