Close Menu
Crypto Valley Journal
    Facebook X (Twitter) Instagram
    Crypto Valley Journal
    • Hot Topics
      • News
      • Minds
    • Focus
      • Background
      • Blockchain
      • Legal & Compliance
      • Non-Fungible Token (NFTs)
    • Investing
      • Markets
      • Financial Products
      • Decentralized Finance (DeFi)
      • Exchange overview
    • Education
      • Basics
      • Glossary
      • Politicians on crypto
    • Statistics
      • Bitcoin-ETF-Flows
      • Ethereum-ETF-Flows
      • Crypto market data
      • On-chain data
    • Academy
      • Overview
      • Part 1: Blockchain
      • Part 2: Money
      • Part 3: Bitcoin
      • Part 4: Cryptocurrencies
      • Part 5: Decentralized Finance
      • Part 6: Investing
    • English
      • Deutsch
    Crypto Valley Journal
    You are at:Home»Markets»Technical Analysis»Technical Analysis October 13, 2020
    Technical Analysis

    Technical Analysis October 13, 2020

    By Patrick Heusser on 13. October 2020 Technical Analysis
    An overview of the trading activities on the cryptomarkets. Studies on traded volumes, supply and demand situations, as well as periodic technical analysis of the most important crypto-currencies and indices, including the perspective of Crypto Finance AG Senior Trader Patrick Heusser.

    Technical Analysis

    Good Morning!

    Bitcoin $BTC (4h)

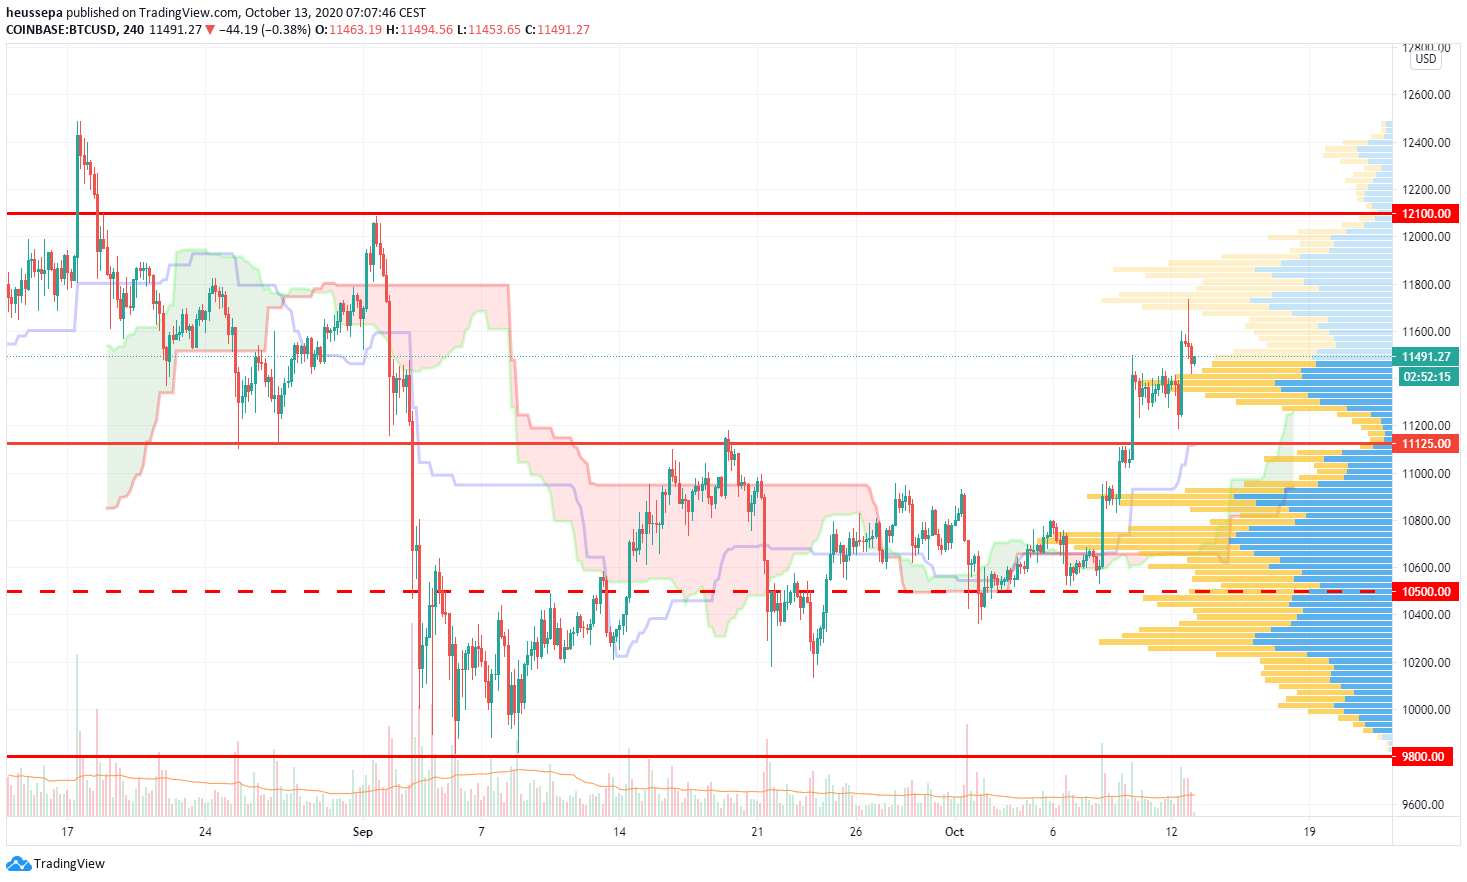
    Finally, we are seeing some movement outside of the old range of 9.8-11.2k.

    I was asked yesterday, where I see this market heading. My quick response was that I thought we'd see 14k and not 10.5k (again).

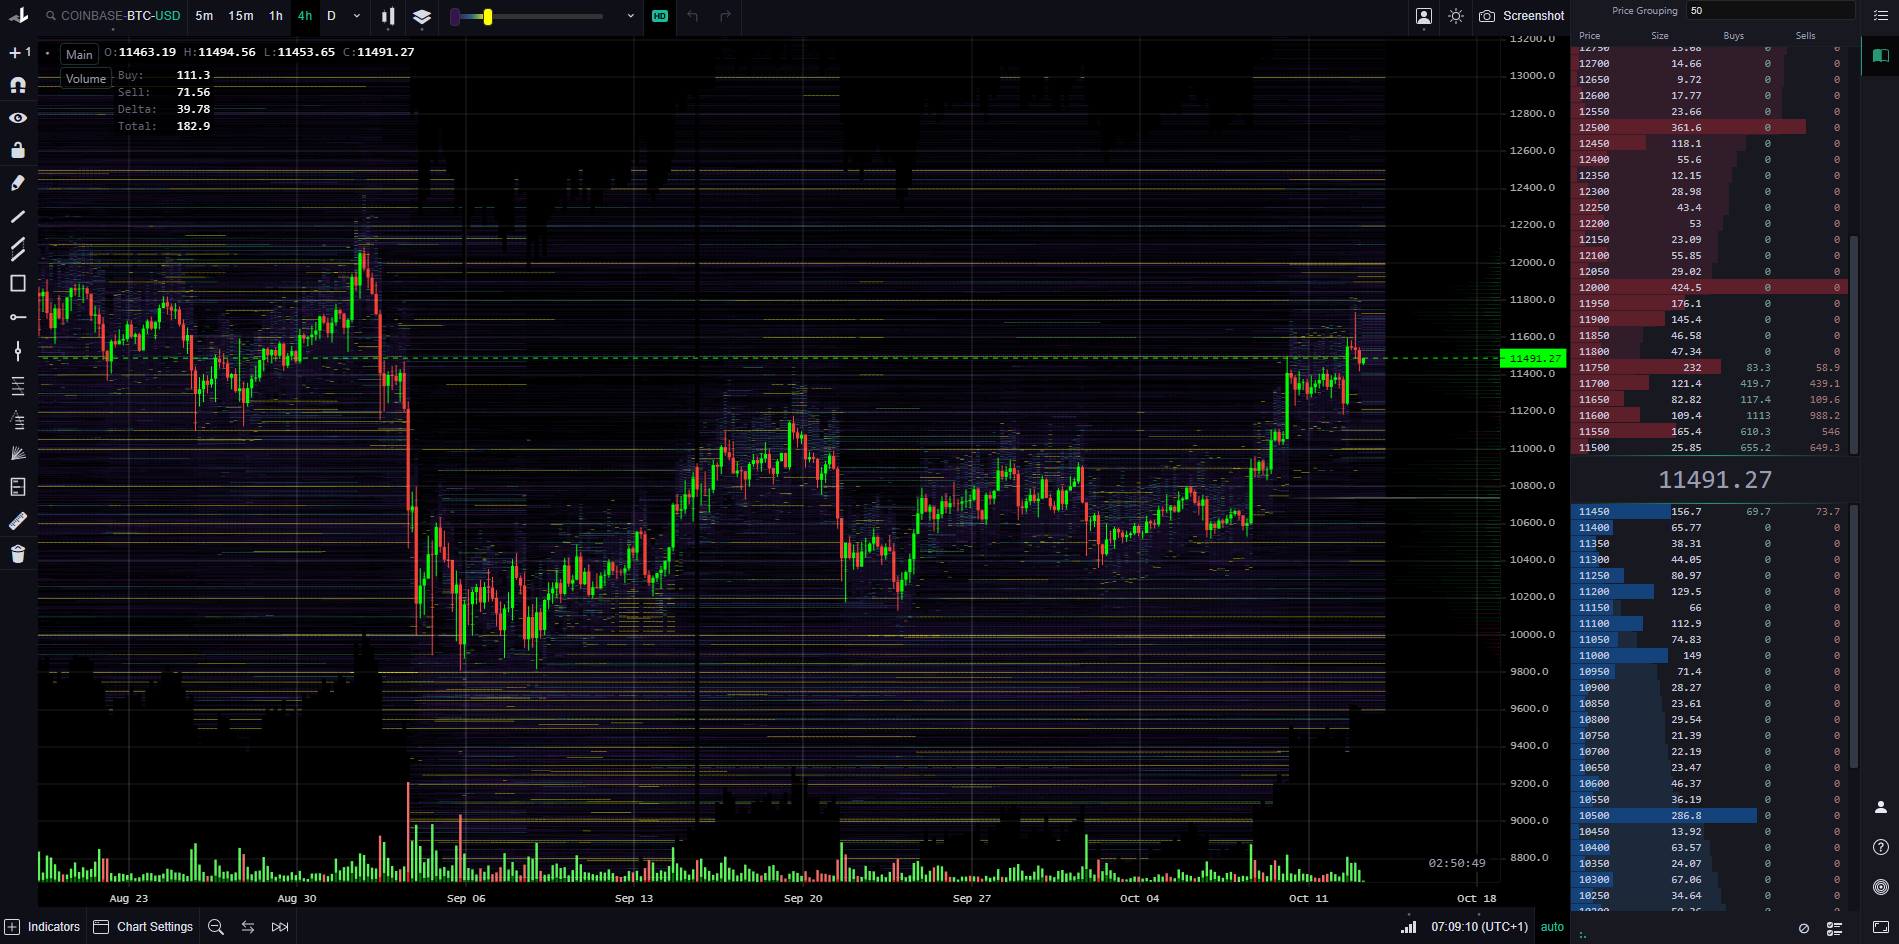
    Currently, this call is well on track. The only thing that worries me a bit is the massive supply we have around 12k. These are not only from Asian accounts (or platforms), but also on Coinbase. I will monitor the supply over the coming days.

    On the downside, I am interested in seeing if drops like we saw yesterday and overnight are being bought up continuously that quickly. The order book is not that well populated on the bid side, but for some reason when the price dips market buy orders come in and support the price.

    See also the Coinbase Heat Map below:

    Ethereum $ETH (4h)

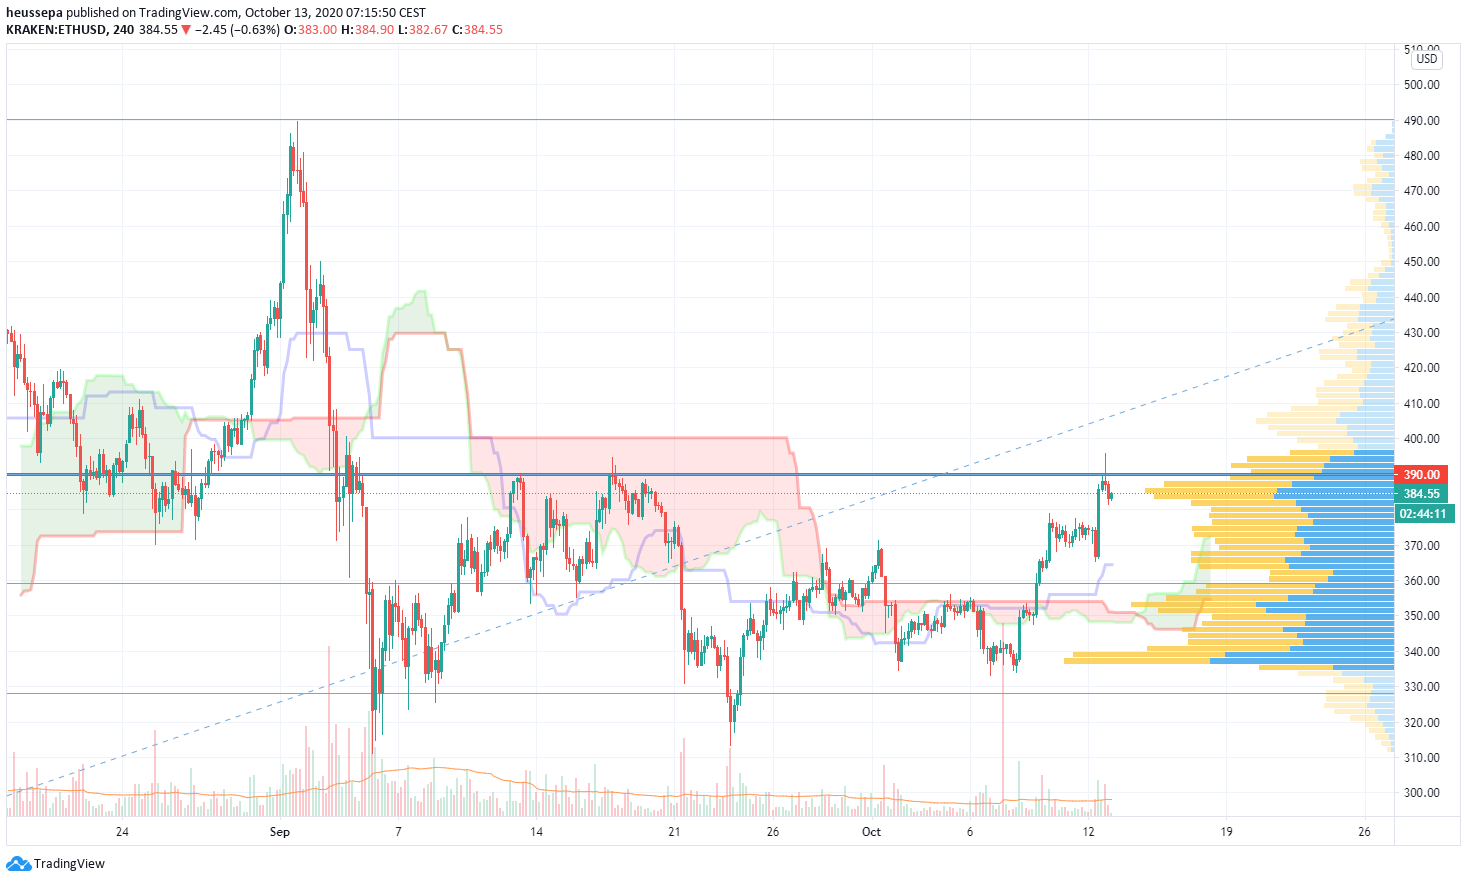
    The good old $390 level is capping the price again. Let's see for how long...

    I see the current short-term range as 360-390. To me, a breakout of $390 on a daily closing basis is a very bullish sign. This could spark a rally in the medium term towards the recent high of $490.

    Everything below $330 will destroy the current bullish sentiment.
    https://www.tradingview.com/x/O09AJsNb/

    Ethereum/Bitcoin $ETHBTC (4h)

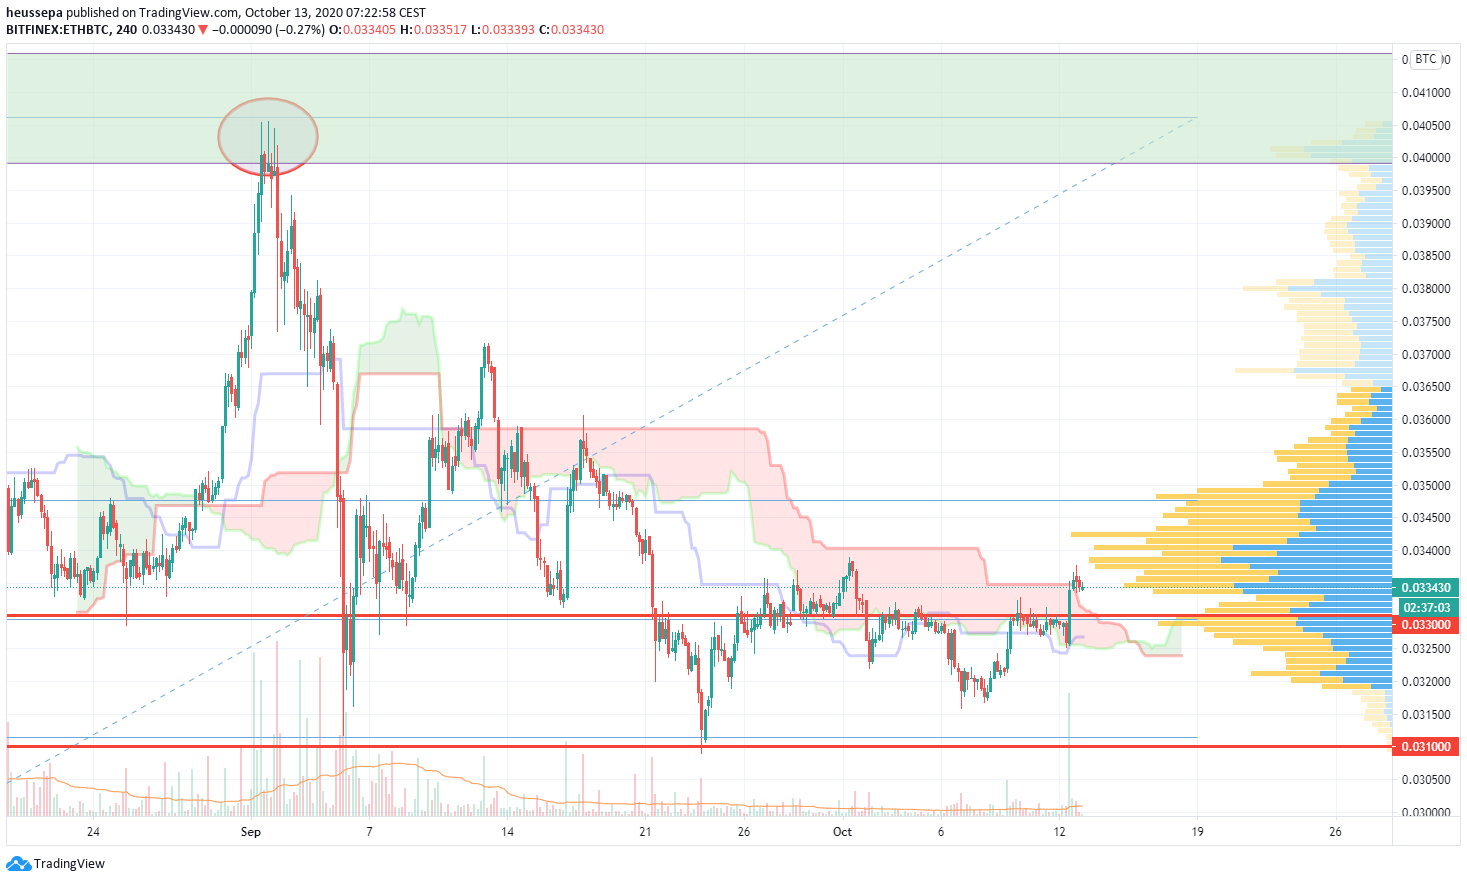
    The first important hurdle was taken yesterday by pushing decisively through the 0.033 support/resistance flip line. In addition to this, we also pushed through the Ichimoku cloud and are now above the upper band line.

    The cloud turned positive and the price is currently right at the lower end of a large liquidity pool (between 0.00335 - 0.00345).

    The current situation is in line with my bullish outlook for ETH$. There is a strong possibility that we will see a rotation back into ETH versus BTC.

    $DEFI (4h)

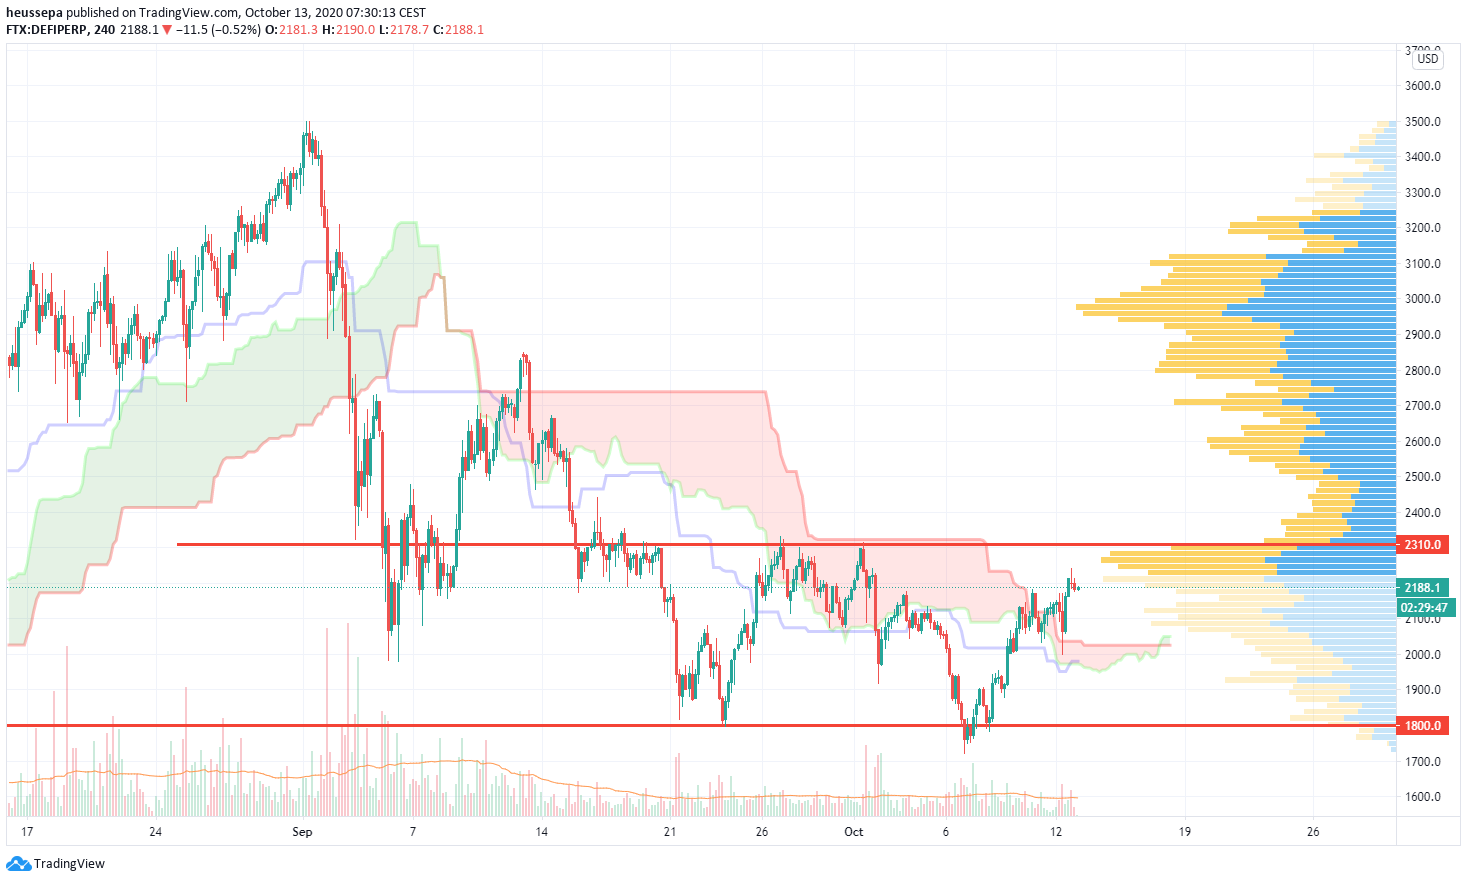
    There has been a nice recovery, but we are still within the larger range of 1,800-2,310. The first indication of a possible trend change was when we pushed through the baseline (blue line), and then (a little later) through the entire Ichimoku cloud.

    However, in order for me to get into long positions, I need to see a break above 2,310, and see at least one daily closing above that level.

    In case that happens, I expect to see a swift move higher towards 3,000, since there has not been much traded in between.

    $UNISWAP (4h)

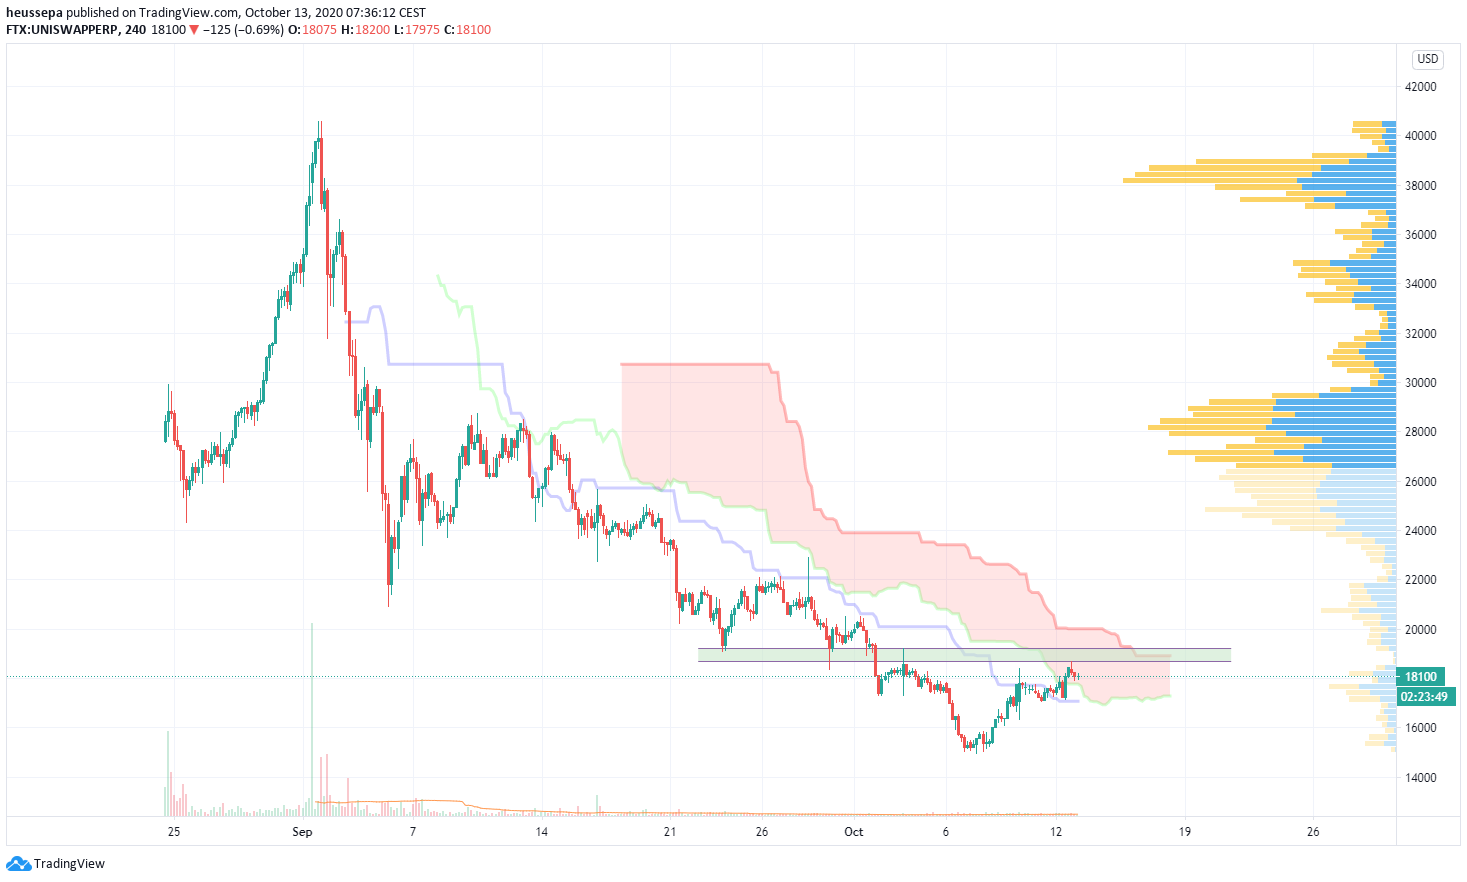
    Since we began looking a bit closer at the smaller coins, I will add more on the UNISWAP index.

    The pattern is faily similar to what we have seen for DEFI$. We also pushed through the baseline and into the Ichimoku cloud.

    The resistance zone seems to be at around 19k. This needs to be taken out, and (with it) we should close above the upper band of the Ichimoku cloud. This would turn me bullish.

    $YFI (4h)

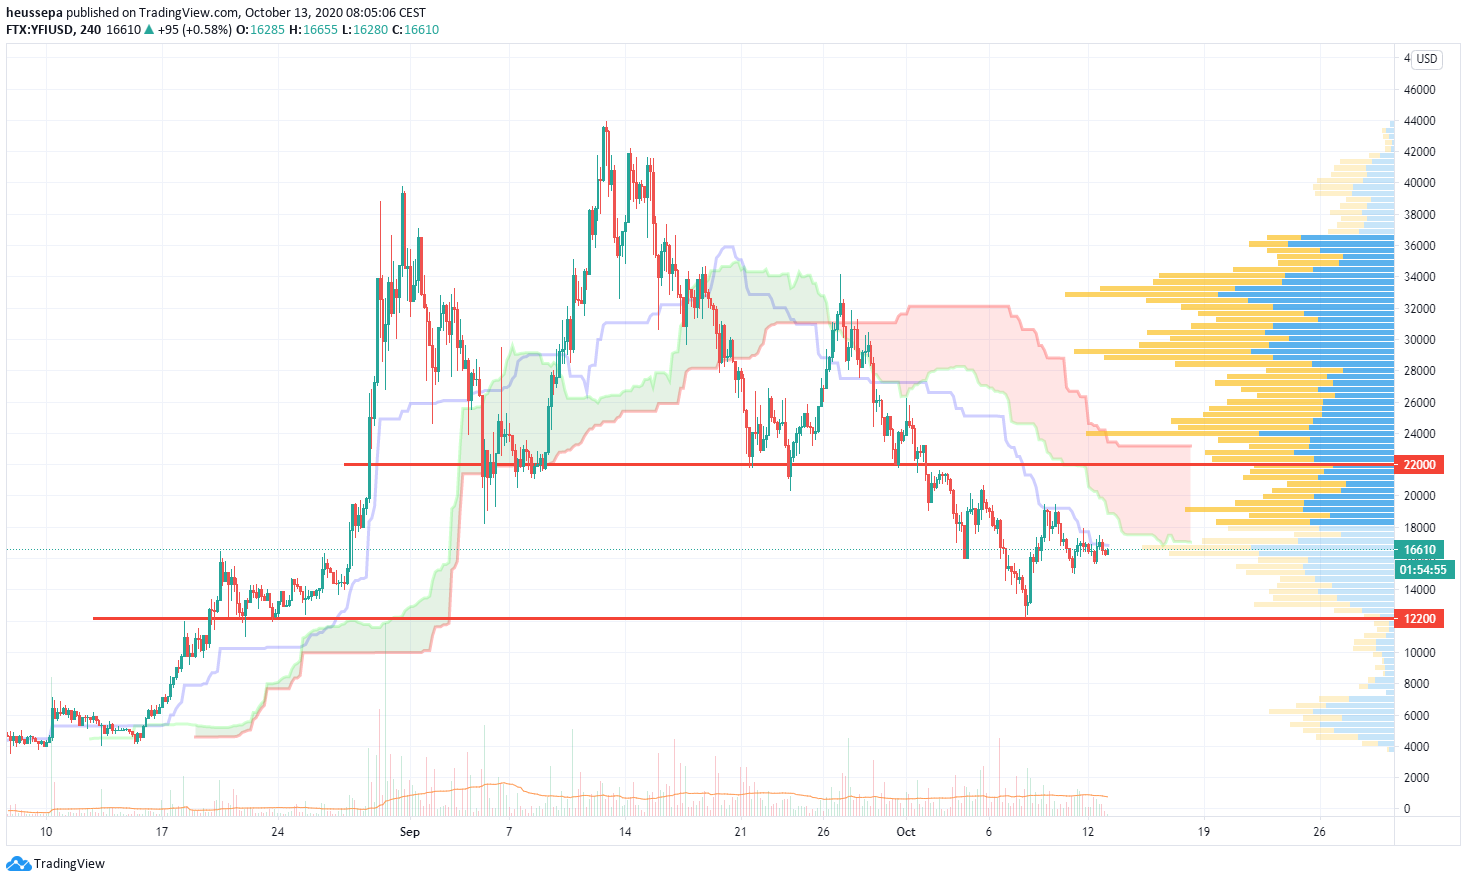
    Fundamentally, I still like the coin/project, but I have to admit that it does not look good technically for the bulls.

    After we broke the 22k level, the bullish scenario was gone. I am not fully convinced that the top formation is/was a shoulder-head-shoulder. Therefore, I am sticking with the current (large) range of 12.2k-22k.

    $DOT (4h)

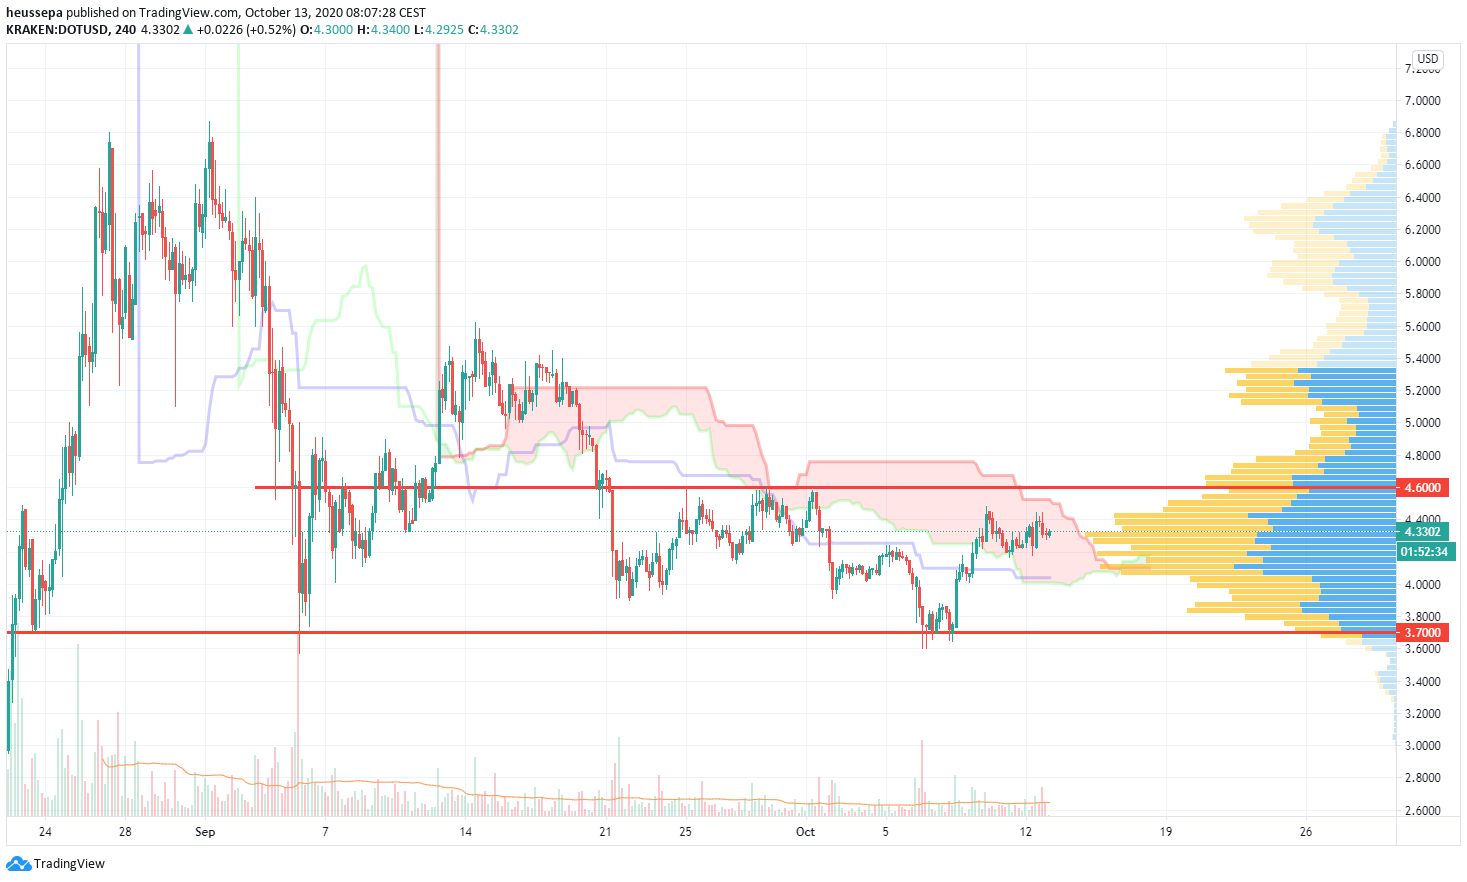
    Dot is holding well at $3.70. The price is now within the Ichimoku cloud, which just recently turned bullish. Let us see if we can turn this baby around.

    $4.60 is the resistance we need to break to see a swift move up to $5.40.

    Share. Facebook Twitter LinkedIn Email Telegram WhatsApp

    About the author

    Patrick Heusser

      Patrick Heusser is Head of Trading at Crypto Broker AG. Prior to joining the company, Patrick worked as an Interest Rate Trader at UBS and held various positions in the IRCC (interest rate, commodity and foreign exchange trading) in London, New York, Singapore and Zurich. Patrick is an expert in trading and risk management. He also gained experience in other areas, such as building start-up companies. Patrick has a degree in banking from a business school. He has also taken various courses in technical chart analysis.

      Related Articles

      technical chart analysis

      Technical Analysis August 23, 2022

      technical chart analysis

      Technical Analysis August 2nd, 2022

      Bitcoin USD

      Weekly Bitcoin USD chart analysis calendar week 24 – 2022

      CME and ICE press CFTC and Congress to put Hyperliquid under oversight. At stake: 700 million USD in daily oil perpetual volume.
      16. May 2026

      CME and ICE push regulators to act against Hyperliquid

      CVJ.CH Weekly review calendar week
      16. May 2026

      Weekly review CW 20: Clarity Act is nearing the finish line

      Poland's Sejm debates four MiCA bills while the Zondacrypto case puts Zug-based Divisio Holding AG at the center of a criminal probe.
      15. May 2026

      Zondacrypto scandal collides with Poland’s MiCA endgame

      twitter image button instagram image button linkedin image button youtube image button

      About Crypto Valley Journal
      About Crypto Valley Journal

      On the pulse of the movement

      • Academy
      • Contact
      • Advertising
      • About us
      • Partner
      • Imprint
      • Privacy
      • Disclaimer
      Search

      Type above and press Enter to search. Press Esc to cancel.