Close Menu
Crypto Valley Journal
    Facebook X (Twitter) Instagram
    Crypto Valley Journal
    • Hot Topics
      • News
      • Minds
    • Focus
      • Background
      • Blockchain
      • Legal & Compliance
      • Non-Fungible Token (NFTs)
    • Investing
      • Markets
      • Financial Products
      • Decentralized Finance (DeFi)
      • Exchange overview
    • Education
      • Basics
      • Glossary
      • Politicians on crypto
    • Statistics
      • Bitcoin-ETF-Flows
      • Ethereum-ETF-Flows
      • Crypto market data
      • On-chain data
    • Academy
      • Overview
      • Part 1: Blockchain
      • Part 2: Money
      • Part 3: Bitcoin
      • Part 4: Cryptocurrencies
      • Part 5: Decentralized Finance
      • Part 6: Investing
    • English
      • Deutsch
    Crypto Valley Journal
    You are at:Home » Markets » Technical Analysis » Technical Analysis October 19, 2021
    technical chart analysis

    Technical Analysis October 19, 2021

    By Patrick Heusser on 19. October 2021 Technical Analysis

    An overview of the trading activities on the cryptomarkets. Studies on traded volumes, supply and demand situations, as well as periodic technical analysis of the most important crypto-currencies and indices, including the perspective of professional Traders.

    Technical Analysis

    Good Morning!

    A week has passed since our last TA Tuesday... And nothing has changed - at least in terms of altcoins versus bitcoin.

    Ethereum inverse head and shoulders formation

    Ethereum ETH/USD (daily) / Charts: Tradingview

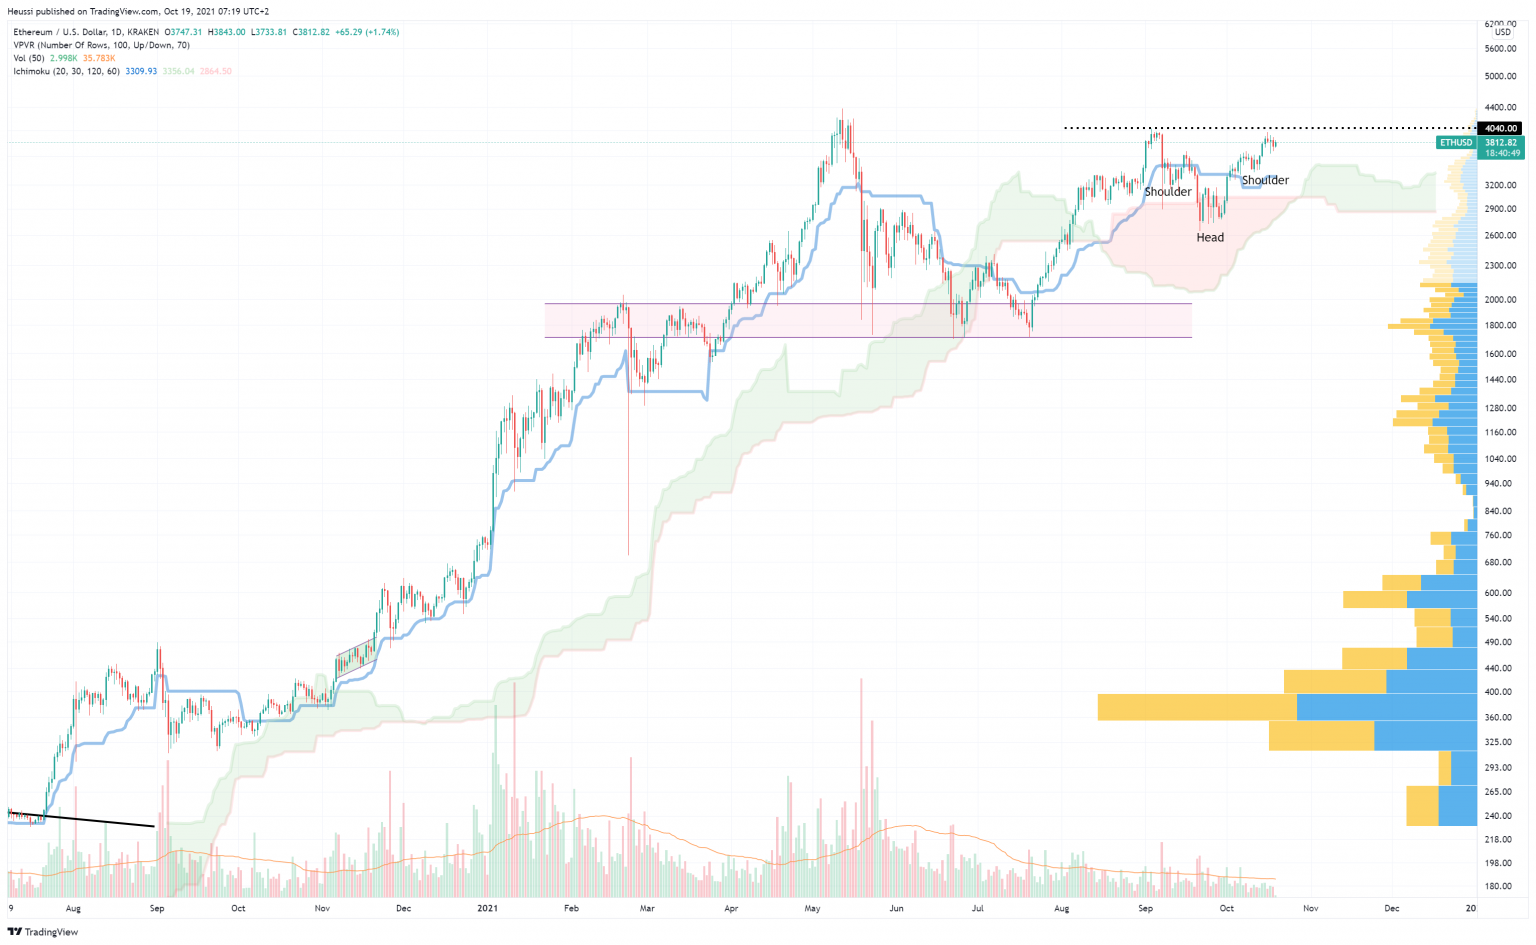
    However, there is a potential Ethereum (ETH) formation that has been popping up a lot on Twitter called an inverse shoulder-head-shoulder formation. As far as I'm concerned, this pattern will only become interesting when the price pushes through $4k and prints a daily closing above it. The entire scenario will fall apart if we trade below the baseline (blue line). But don't get me wrong: the $4k level remains very important.

    The Bitcoin price falls below USD 60,000 to its lowest level since October 2024 as Strategy, ETF buyers and retail all retreat at once. Market Review

    Crypto winter: Bitcoin price breaks below USD 60,000 again

    technical chart analysis Technical Analysis

    Technical Analysis August 23, 2022

    The Bitcoin price falls below USD 60,000 to its lowest level since October 2024 as Strategy, ETF buyers and retail all retreat at once. Market Review

    Crypto winter: Bitcoin price breaks below USD 60,000 again

    BlackRock files its fourth S-1 amendment for the Bitcoin Premium Income ETF (BITA). A Bloomberg analyst expects a launch ahead of Goldman Sachs. Financial Products

    Launch of BlackRock’s income-generating Bitcoin ETF moves closer

    Marktkommentar
    Ethereum vs. Bitcoin ETH/BTC (daily)

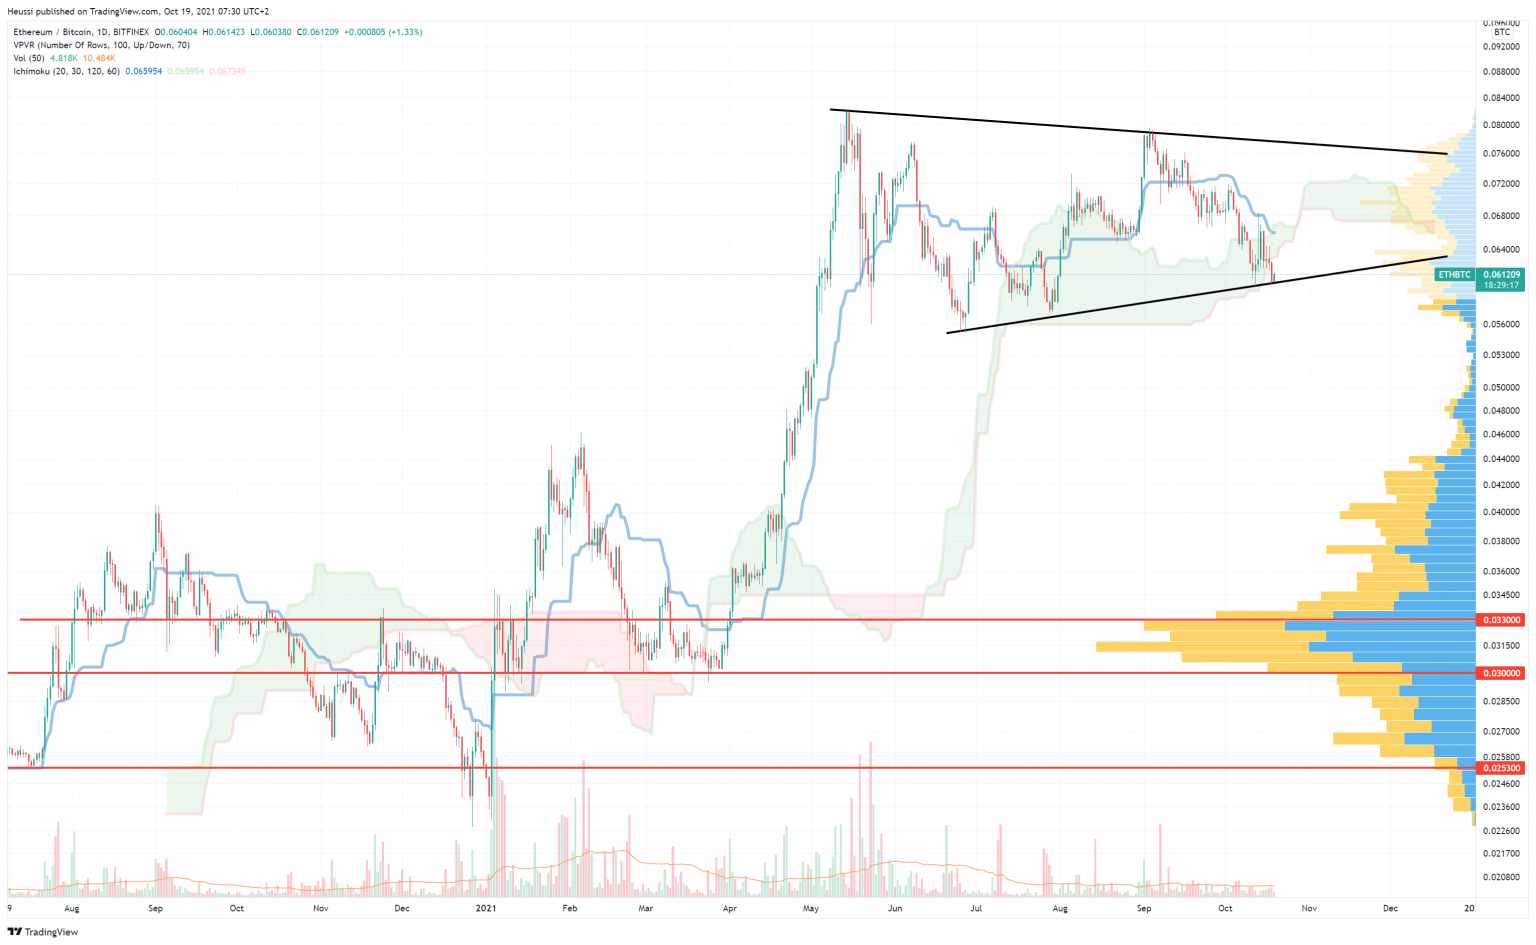
    I have also checked the Ethereum/Bitcoin (ETHBTC) chart to see if I get some positive vibes there as well. In terms of the big picture, we are in a potential triangle with three touchpoints on the lower leg and only two on the upper one. From a "timing" perspective, the ETHBTC chart looks supportive of another lower leg bounce, which could turn into the push needed for the ETH price to close above the $4k level.

    But... only time will tell.


    Copyright © 2021 | Crypto Broker AG | All rights reserved.
    All intellectual property, proprietary and other rights and interests in this publication and the subject matter hereof are owned by Crypto Broker AG including, without limitation, all registered design, copyright, trademark and service mark rights.

    Disclaimer
    This publication provided by Crypto Broker AG, a corporate entity registered under Swiss law, is published for information purposes only. This publication shall not constitute any investment  advice respectively does not constitute an offer, solicitation or recommendation to acquire or dispose of any investment or to engage in any other transaction. This publication is not intended for solicitation purposes but only for use as general information. All descriptions, examples and calculations contained in this publication are for illustrative purposes only. While reasonable care has been taken in the preparation of this publication to provide details that are accurate and not misleading at the time of publication, Crypto Broker AG (a) does not make any representations or warranties regarding the information contained herein, whether express or implied, including without limitation any implied warranty of merchantability or fitness for a particular purpose or any warranty with respect to the accuracy, correctness, quality, completeness or timeliness of such information, and (b) shall not be responsible or liable for any third party’s use of any information contained herein under any circumstances, including, without limitation, in connection with actual trading or otherwise or for any errors or omissions contained in this publication.

    Risk disclosure
    Investments in virtual currencies are high-risk investments with the risk of total loss of the investment and you should not invest in virtual currencies unless you understand and can bear the risks involved with such investments. No information provided in this publication shall constitute investment advice. Crypto Broker AG excludes its liability for any losses arising from the use of, or reliance on, information provided in this publication.
    Share. Facebook Twitter LinkedIn Email Telegram WhatsApp

    About the author

    Patrick Heusser

      Patrick Heusser is Head of Trading at Crypto Broker AG. Prior to joining the company, Patrick worked as an Interest Rate Trader at UBS and held various positions in the IRCC (interest rate, commodity and foreign exchange trading) in London, New York, Singapore and Zurich. Patrick is an expert in trading and risk management. He also gained experience in other areas, such as building start-up companies. Patrick has a degree in banking from a business school. He has also taken various courses in technical chart analysis.

      Related Articles

      technical chart analysis

      Technical Analysis August 23, 2022

      technical chart analysis

      Technical Analysis August 2nd, 2022

      Bitcoin USD

      Weekly Bitcoin USD chart analysis calendar week 24 – 2022

      Binance withdraws its Greek MiCA license application and halts all EU crypto services from 1 July. Customers must withdraw their funds.
      26. June 2026

      Binance halts EU services after failed MiCA license

      SBI Holdings acquires Bitbank for USD 288.6 million, becoming Japan's largest crypto exchange operator by assets under management.
      25. June 2026

      SBI Holdings acquires Bitbank for USD 290 million

      The Bitcoin price falls below USD 60,000 to its lowest level since October 2024 as Strategy, ETF buyers and retail all retreat at once.
      25. June 2026

      Crypto winter: Bitcoin price breaks below USD 60,000 again

      twitter image button instagram image button linkedin image button youtube image button

      About Crypto Valley Journal
      About Crypto Valley Journal

      On the pulse of the movement

      • Academy
      • Contact
      • Advertising
      • About us
      • Partner
      • Imprint
      • Privacy
      • Disclaimer
      Search

      Type above and press Enter to search. Press Esc to cancel.