Close Menu
Crypto Valley Journal
    Facebook X (Twitter) Instagram
    Crypto Valley Journal
    • Hot Topics
      • News
      • Minds
    • Focus
      • Background
      • Blockchain
      • Legal & Compliance
      • Non-Fungible Token (NFTs)
    • Investing
      • Markets
      • Financial Products
      • Decentralized Finance (DeFi)
      • Exchange overview
    • Education
      • Basics
      • Glossary
      • Politicians on crypto
    • Statistics
      • Bitcoin-ETF-Flows
      • Ethereum-ETF-Flows
      • Crypto market data
      • On-chain data
    • Academy
      • Overview
      • Part 1: Blockchain
      • Part 2: Money
      • Part 3: Bitcoin
      • Part 4: Cryptocurrencies
      • Part 5: Decentralized Finance
      • Part 6: Investing
    • English
      • Deutsch
    Crypto Valley Journal
    You are at:Home»Markets»Technical Analysis»Weekly Bitcoin/USD Chart Analysis: Calendar Week 17
    Bitcoin USD

    Weekly Bitcoin/USD Chart Analysis: Calendar Week 17

    By Editorial Office CVJ.CH on 20. April 2020 Technical Analysis

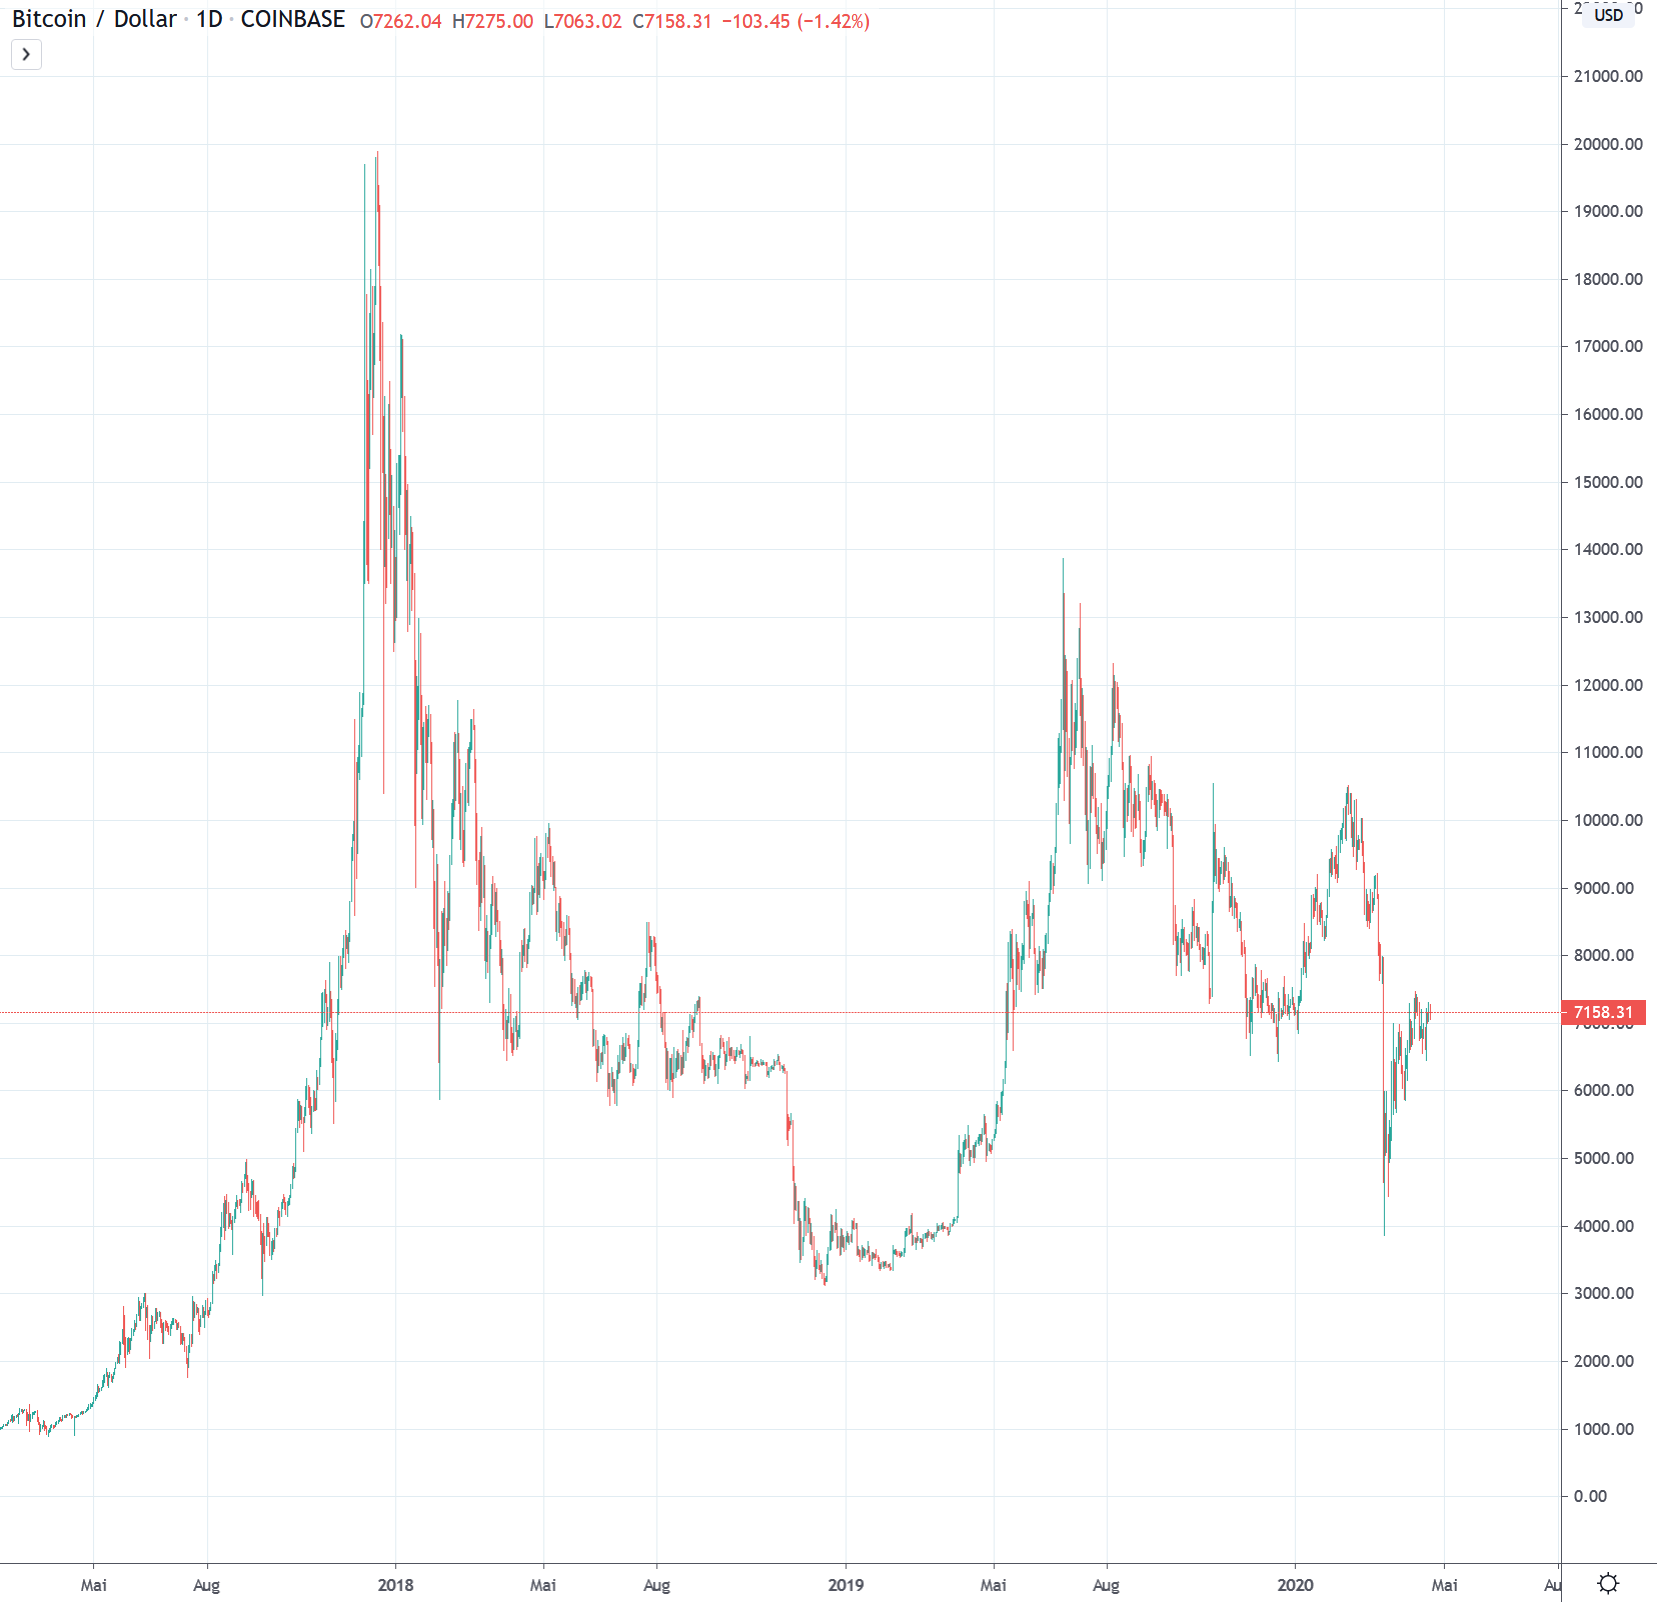
    Bitcoin/USD daily basis


    Bitcoin USD
    Source: Tradingview.com

    Bitcoin USD - Range between 6'500 and 7'000 USD

    The Bitcoin price tested the zone below USD 7,000 at the beginning of the reporting week. Already on Monday there was a downward movement to just under USD 6,500. However, the price recovered to over USD 6,800 on the same day. On Wednesday the next detour to 6,500 USD took place and on Thursday another attempt to bring the price below 6,500 USD was clearly rejected. As a consequence, higher daily lows and highs followed over the next 3 trading days, which in turn brought the price above the USD 7,000 mark. On the weekend, a renewed consolidation around the USD 7,000 mark took place, in a range of USD 300.

    Resistance zone above 7'000 USD remains a hurdle in the micro-trend

    Bitcoin USD
    Source: tradingview.com

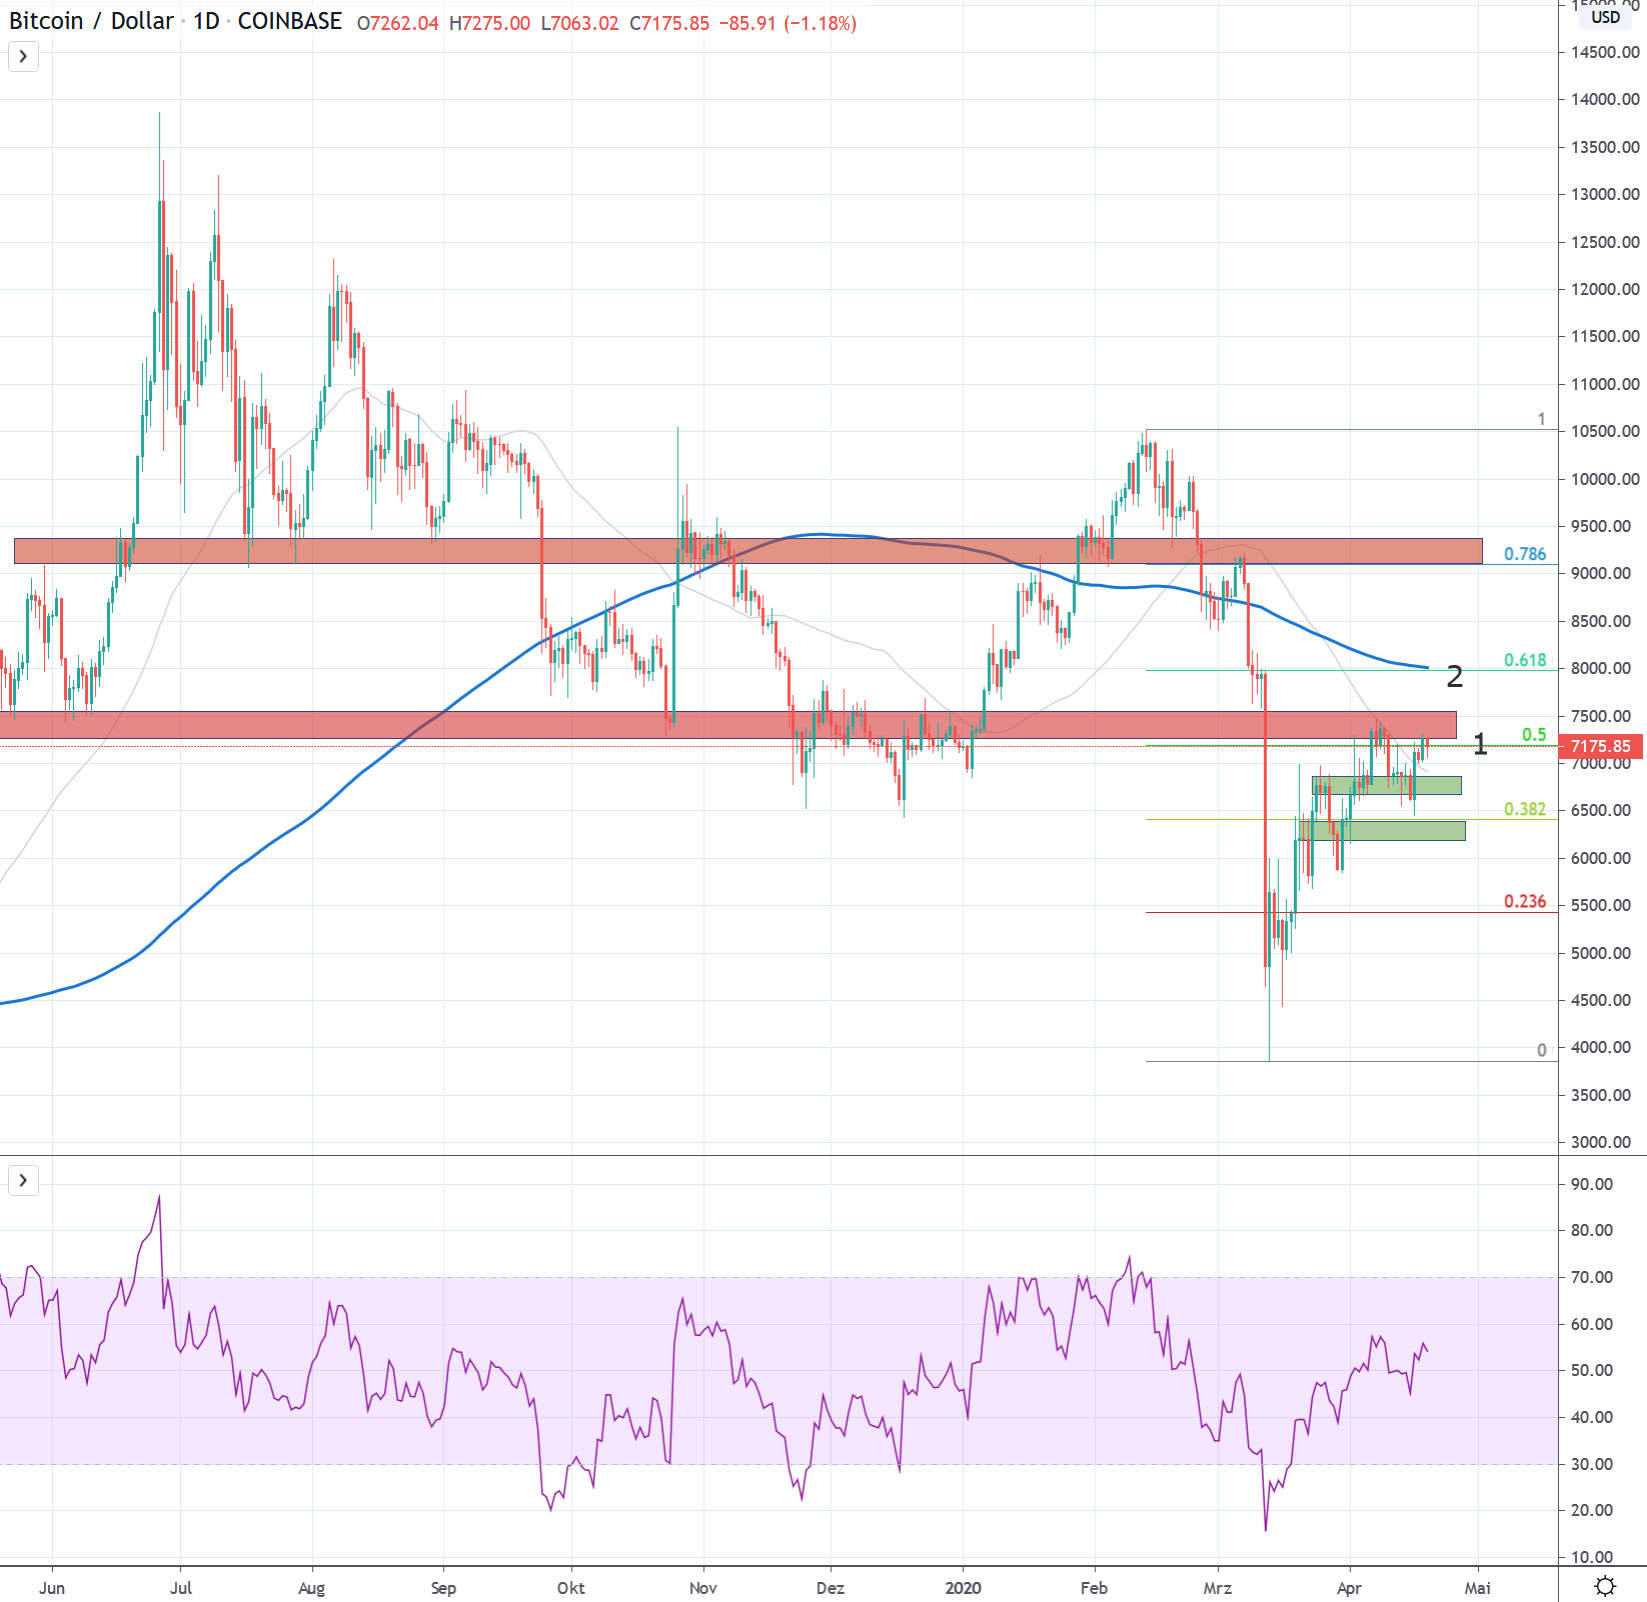
    Bitcoin managed to form a pattern of higher lows in the micro-trend after its fall about four weeks ago. This countermovement now ended for the second time in the resistance zone, which was formed by price movements between November and January 2019, as well as by earlier supports (red).

    Hence, a "normal" countermovement after the price drop is still to be expected. Although it was able to continue to build on its foundation of higher lows, it has failed to break above the USD 7,000 mark for the time being. From a Fibonacci perspective, we are just above the 0.5 point of the correction since the high in February (1).

    In the current structure, the course may soon be set in the micro-trend. If the USD 7,000 mark can be breached on a sustained basis, interesting resistance zones will follow. First, there is the USD 8,000 mark, where the 0.618 Fibonacci point and the 200-day average are located (2). This is followed by a strong resistance zone starting at USD 9,000, which was created by earlier supports.

    In order not to weaken the new positive structure, the newly created supports at 6'700 and around 6'300 USD should be respected. A drift below USD 5'900 would have to be seen as a capitulation of the young upward movement and increases the probability of a renewed visit to the USD 5200 - 5'000 zone. Consequently, a renewed testing of the USD 3,000 - 4,000 spheres would have to be attributed an increased probability

    Macro: Chronology of lower highs since the end of 2017

    Bitcoin USD
    Source: tradingview.com

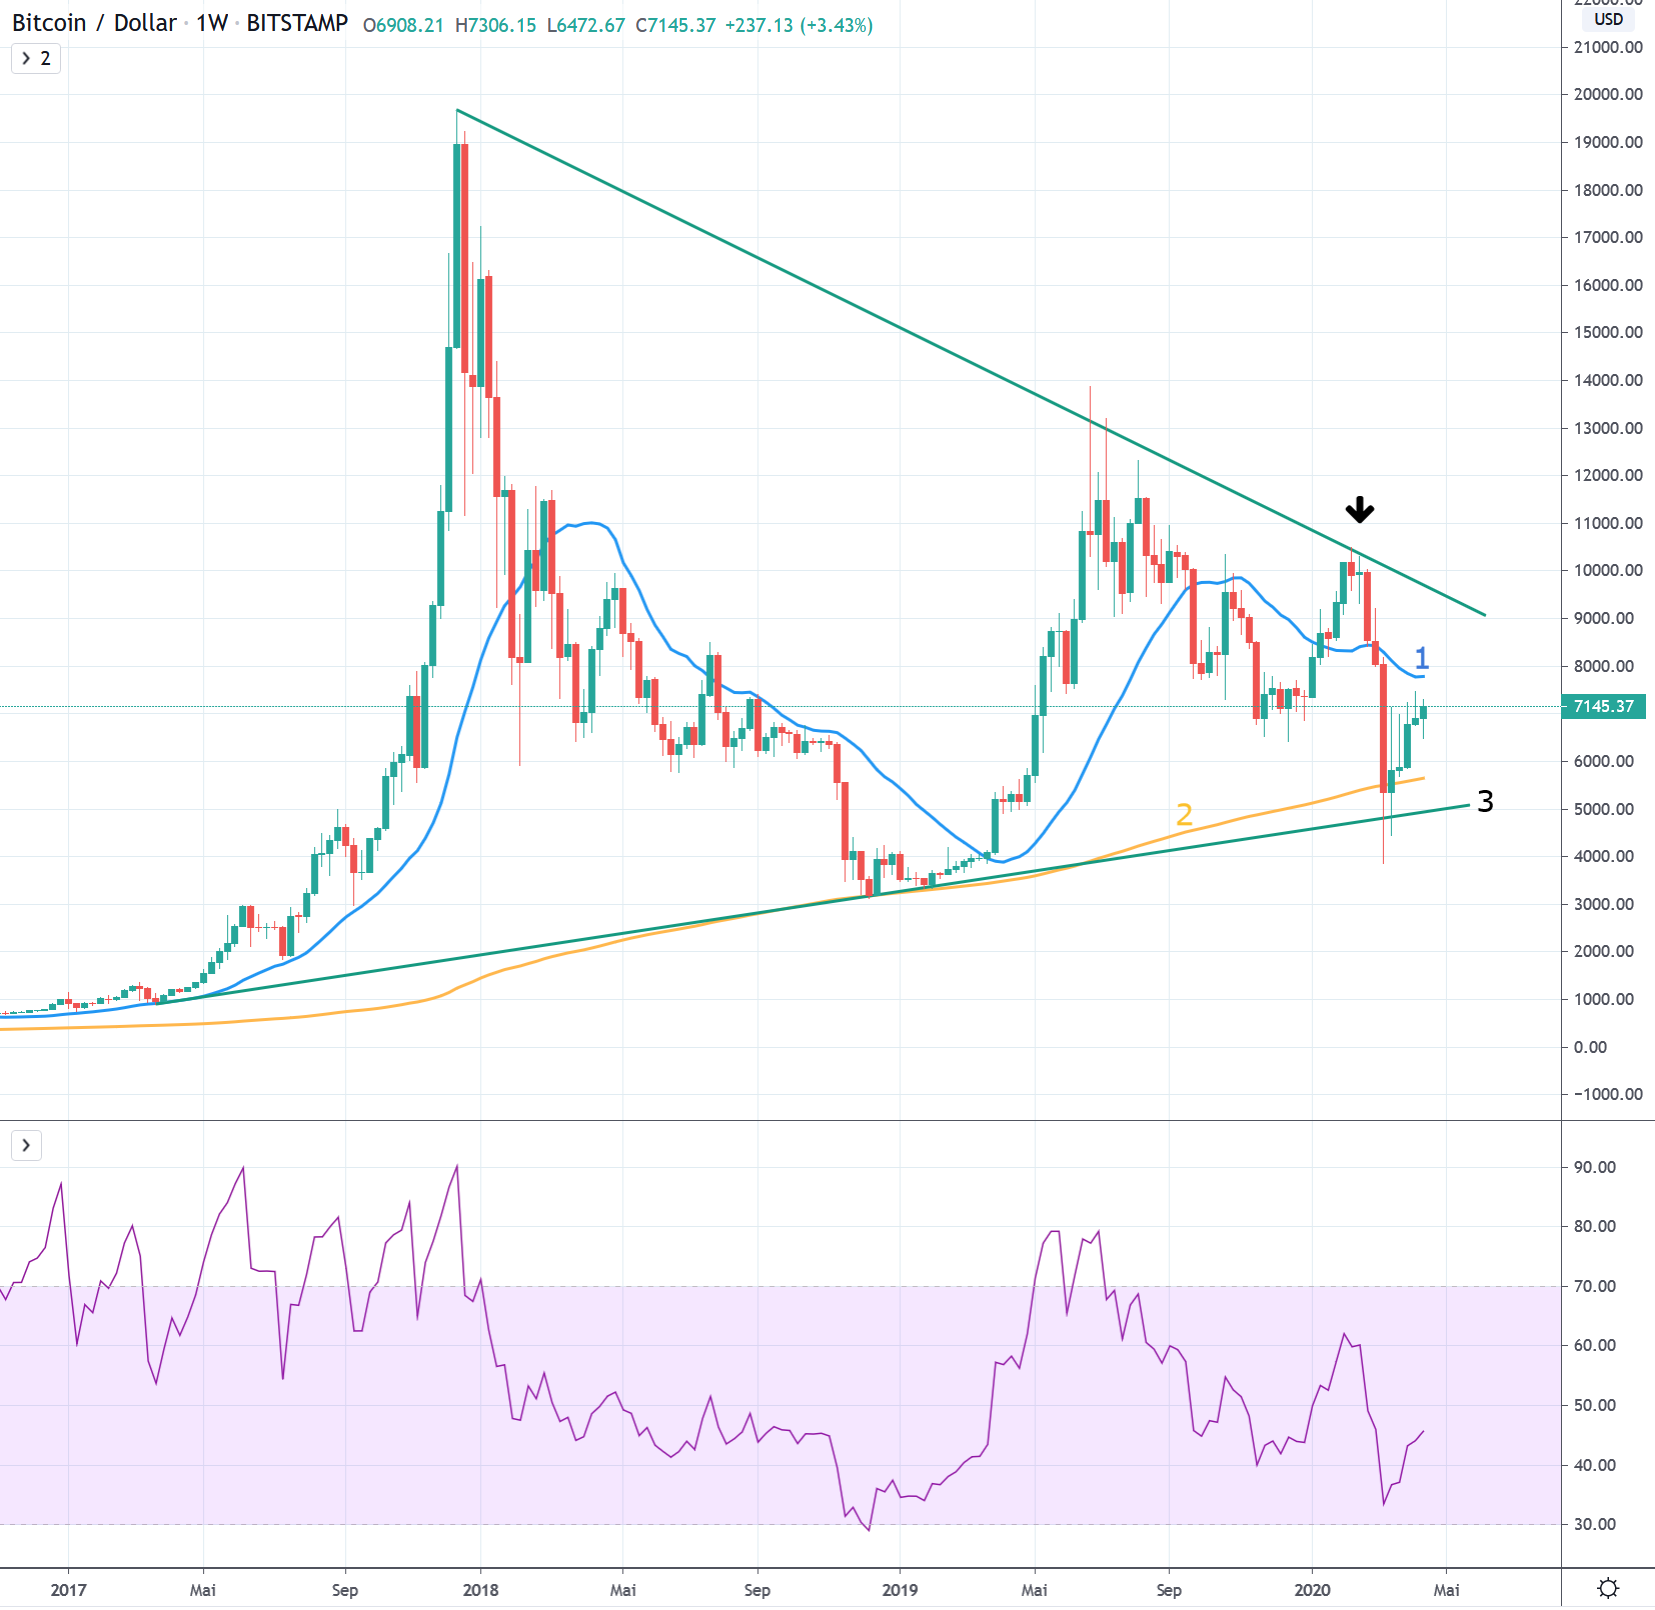
    Bitcoin has so far failed to set a higher high in the weekly interval, which would have broken the prevailing bearish trend since December 2017. In its last attempt since the beginning of the year, the upward trend in the relevant zone at around USD 10,500 failed to establish itself. The sharp price correction in mid-March is further confirmation of the prevailing downtrend.

    Bitcoin is now clearly below the 21-week average (1), which in the past often decided about bull markets or bear markets. The 200-week average (2), which has never been broken since its inception, and the trend line (3) of the lower bandwidth of the uptrend since March 2017 are also being tested. They will serve as further indications of how distressed Bitcoin is at present.

    The macro picture remains dominated by lower highs since December 2017 in the downtrend. Bitcoin must create a new basis for itself. If the USD 5,000 mark does not hold, between USD 3,000 and USD 3,500 support is expected from the bottoming out of early 2018.

    The negative macro picture can only be broken in the medium term if the trend of lower highs since 2017 is sustainably overcome.

    Share. Facebook Twitter LinkedIn Email Telegram WhatsApp

    About the author

    Editorial Office CVJ.CH

      The CVJ editorial staff consists of a team of Blockchain experts and informs daily and independently about the most exciting news.

      Related Articles

      Admiral Paparo confirmed to the US Senate: INDOPACOM operates an active Bitcoin node and is conducting operational tests to protect military networks.

      US military operates Bitcoin node in the Indo-Pacific

      Bitcoin fails again at the 80'000 USD mark, profit-taking weighs on ETH, SOL and XRP despite Strategy purchase and ceasefire.

      Bitcoin price climbs to 80’000 USD – profit-taking hits ETH, SOL and XRP

      Satzlänge: 32.7% der Sätze enthält mehr als 20 Wörter, was mehr als das empfohlene Maximum von 25% ist. Du solltest versuchen, die Sätze zu kürzen. Bindewörter: Keiner der Sätze beinhaltet Bindewörter. Verwende welche. Gute Ergebnisse (5) Passiv: Du verwendest nicht zu viel Passiv. Das ist großartig! Abgeschlossene Sätze: Es gibt keine sich wiederholenden Satzanfänge. Das ist großartig! Verwendung von Zwischenüberschriften: Gut gemacht! Absatzlänge: Es gibt keine Absätze, die zu lang sind. Gut gemacht! Wortkomplexität: Du nutzt nicht zu viele komplexe Worte, was deinen Text leicht zu lesen macht. Gute Arbeit!

      New documentary seeks to unveil the mystery behind Satoshi Nakamoto

      The US Senate has unanimously passed a prediction market ban for members and staff. The trigger is a series of insider trading scandals.
      1. May 2026

      US Senate bans members from trading on prediction markets

      Robinhood misses Q1 2026: crypto revenue halved to 134 million USD, stock falls 11 percent. Schwab and Coinbase intensify competition.
      30. April 2026

      Robinhood misses Q1 estimates: Crypto revenue cut in half

      Canada announces national crypto ATM ban. Roughly 4,000 machines are affected as Ottawa targets fraud and money laundering.
      29. April 2026

      Canada bans crypto ATMs

      twitter image button instagram image button linkedin image button youtube image button

      About Crypto Valley Journal
      About Crypto Valley Journal

      On the pulse of the movement

      • Academy
      • Contact
      • Advertising
      • About us
      • Partner
      • Imprint
      • Privacy
      • Disclaimer
      Search

      Type above and press Enter to search. Press Esc to cancel.