
Inhalt
- 1 Rotation Analysis
- 2 Altcoin Futures Basis Analysis
- 3 Top Ten Comparison
- 4 Volatility and Correlation Comparison
- 5 ETHBTC 4h Technical Chart Analysis
- 6 Market Cap Overview
- Glossary
1. Rotation Analysis
Recovery and stabilisation
The overall financial markets, including cryptocurrencies, have shown short-term stabilisation and a decent recovery. To date, it looks like the markets have absorbed the global shock.
An altcoin rally was led by BSV +29% and BCH +18%. Both coins are now at levels seen just before the crisis began. BTC had a nice bull run up to the 7,400 short-term resistance level. The next resistance is between 7,800 and 7,900.
Overall faith has returned, but the economic status remains stressed, and, therefore, markets are very vulnerable.
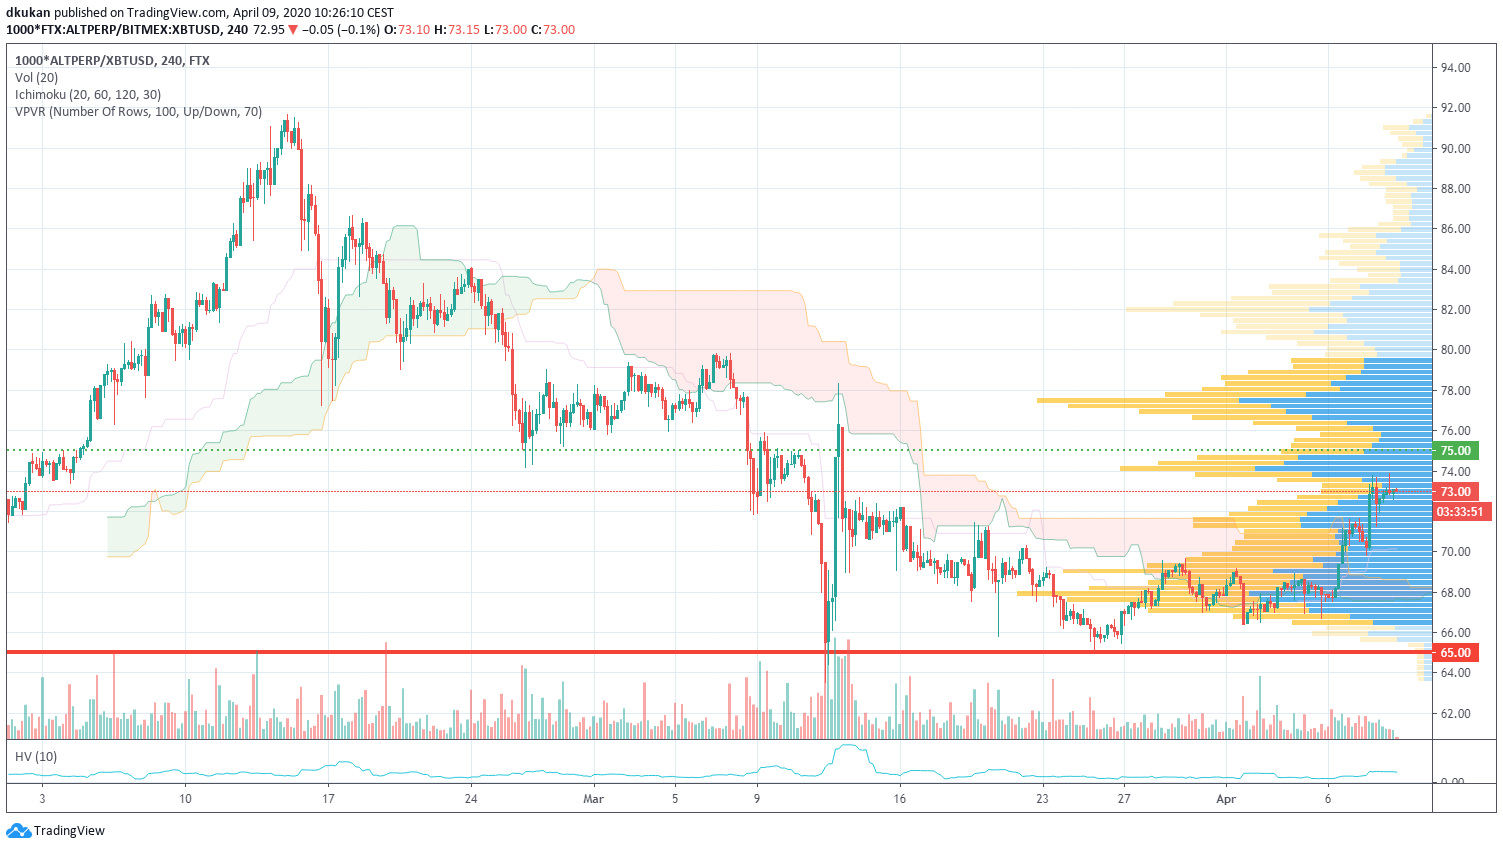
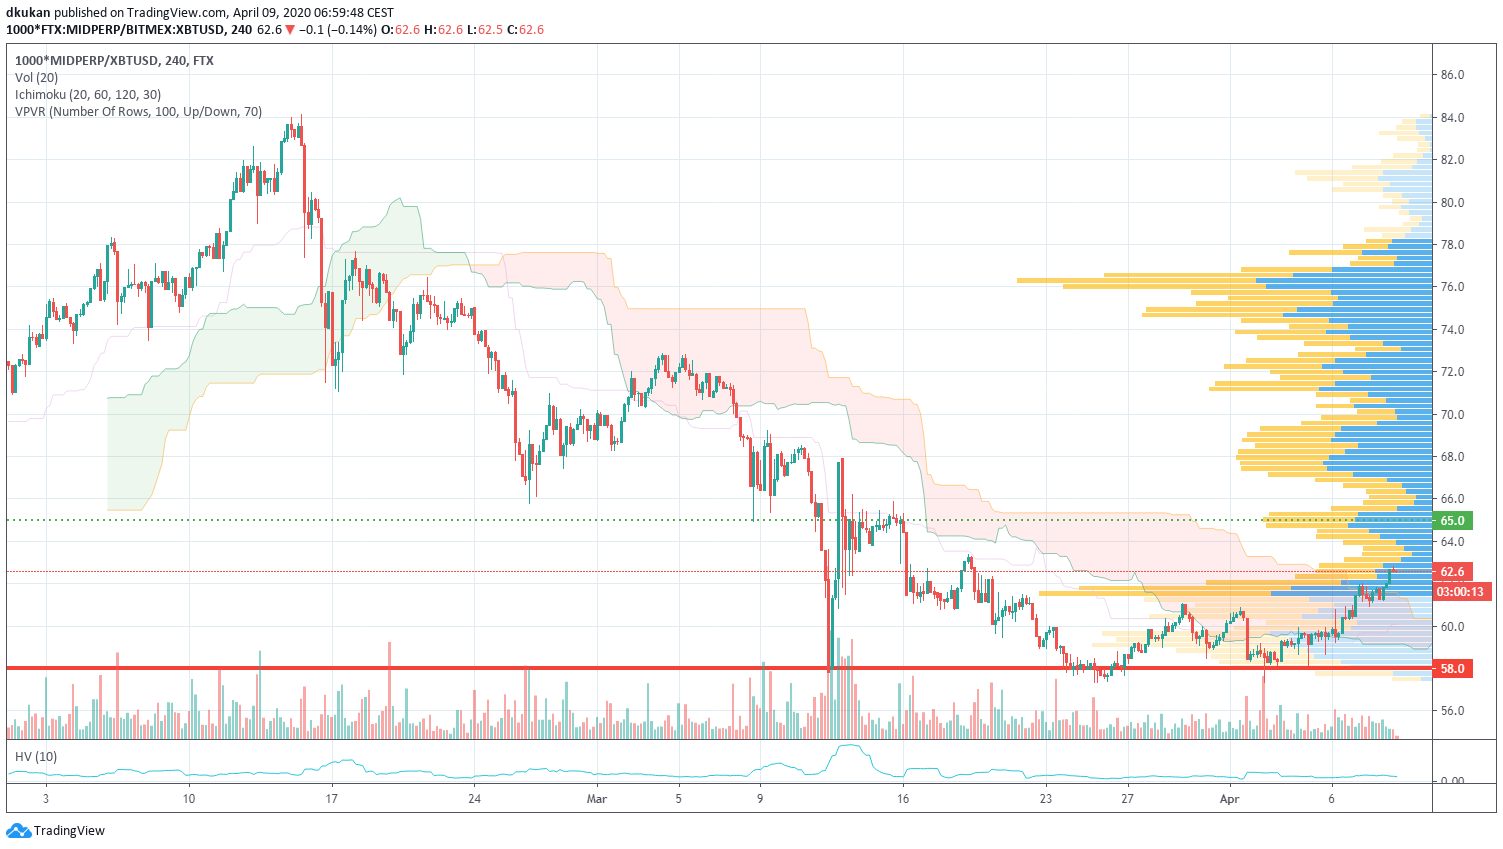
In the charts below, you can see the technical analysis for the Alt/Mid/Shit Indices. Attached you will also find our short-term view on support and resistance levels for all three indices:
Alt: Support 65.00 / Resistance 75.00 / Alt (4h)
Mid: Support 58.00 / Resistance 65.00 / Mid (4h)
Shit: Support 69.50 / Resistance 78.00 / Shit (4h)
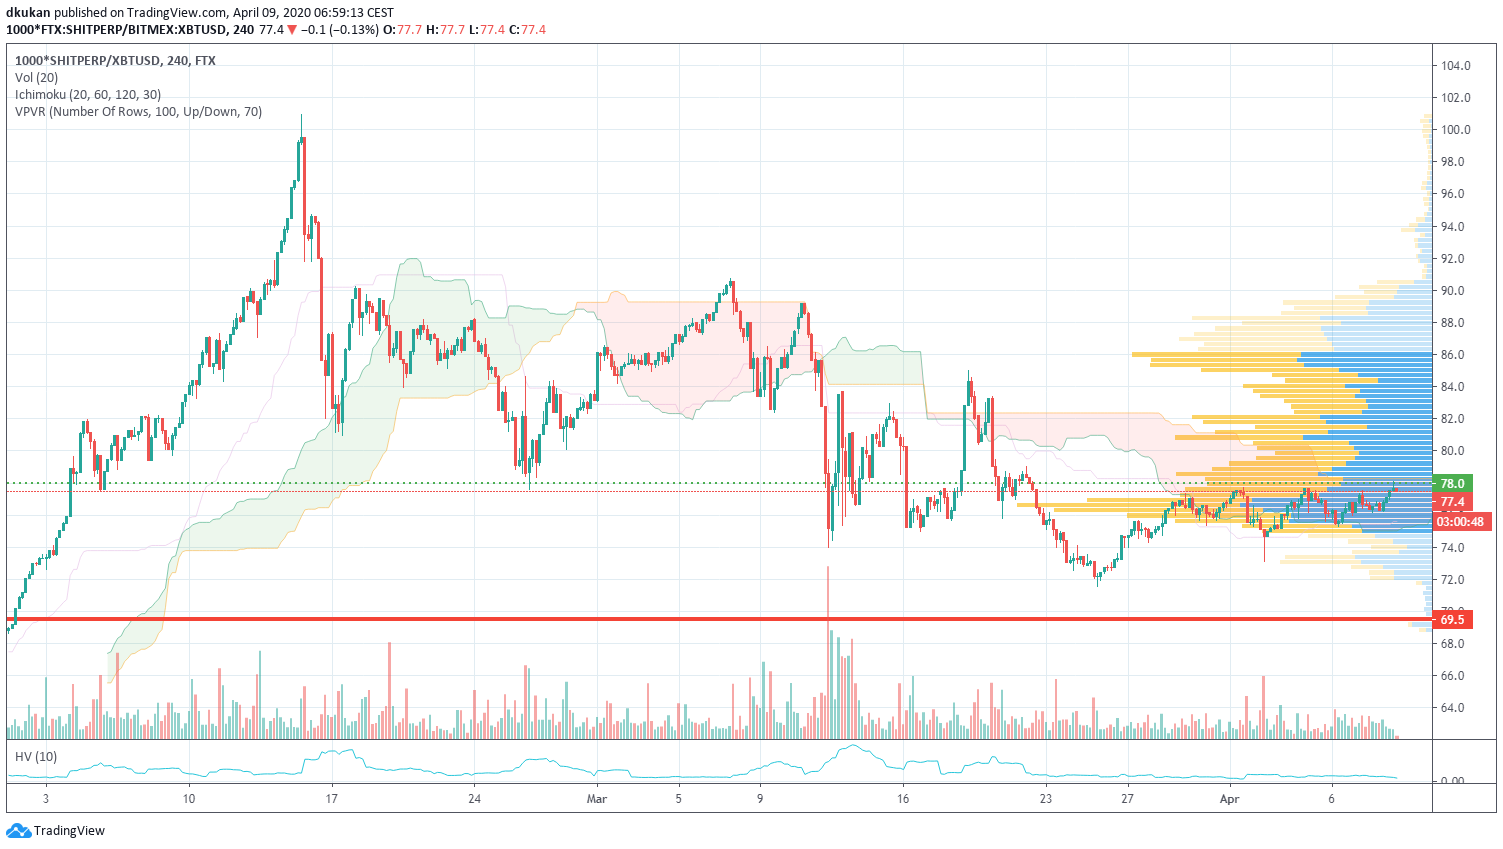
Alt, Mid, and Shit Indices moved towards the resistance levels. Small adjustments within the Shit Index have occurred due to FTX. The DGD coin has been removed from the index as it has been delisted from many exchanges.
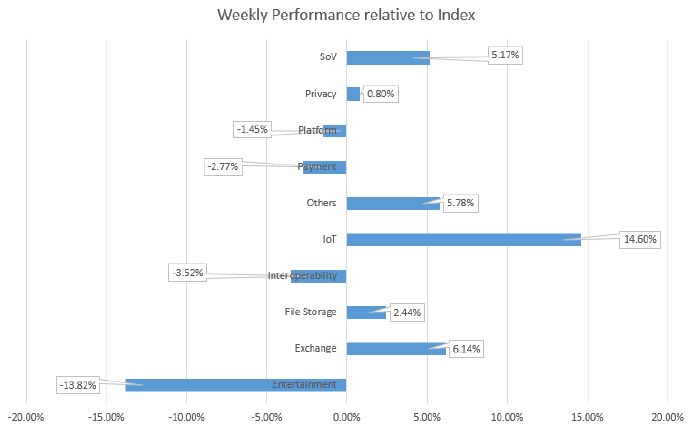
The sector winners are IoT, SoV, and Exchange. Losing sectors are Entertainment, Interoperability, Payment, and Platform.
Link (in the Internet of Things sector) performed +40%. The new coins OKB +49% and BTG +33% have been among the best performing coins since the last index rebalancing.
Losing coins were LEO -8% and NULS -3%.
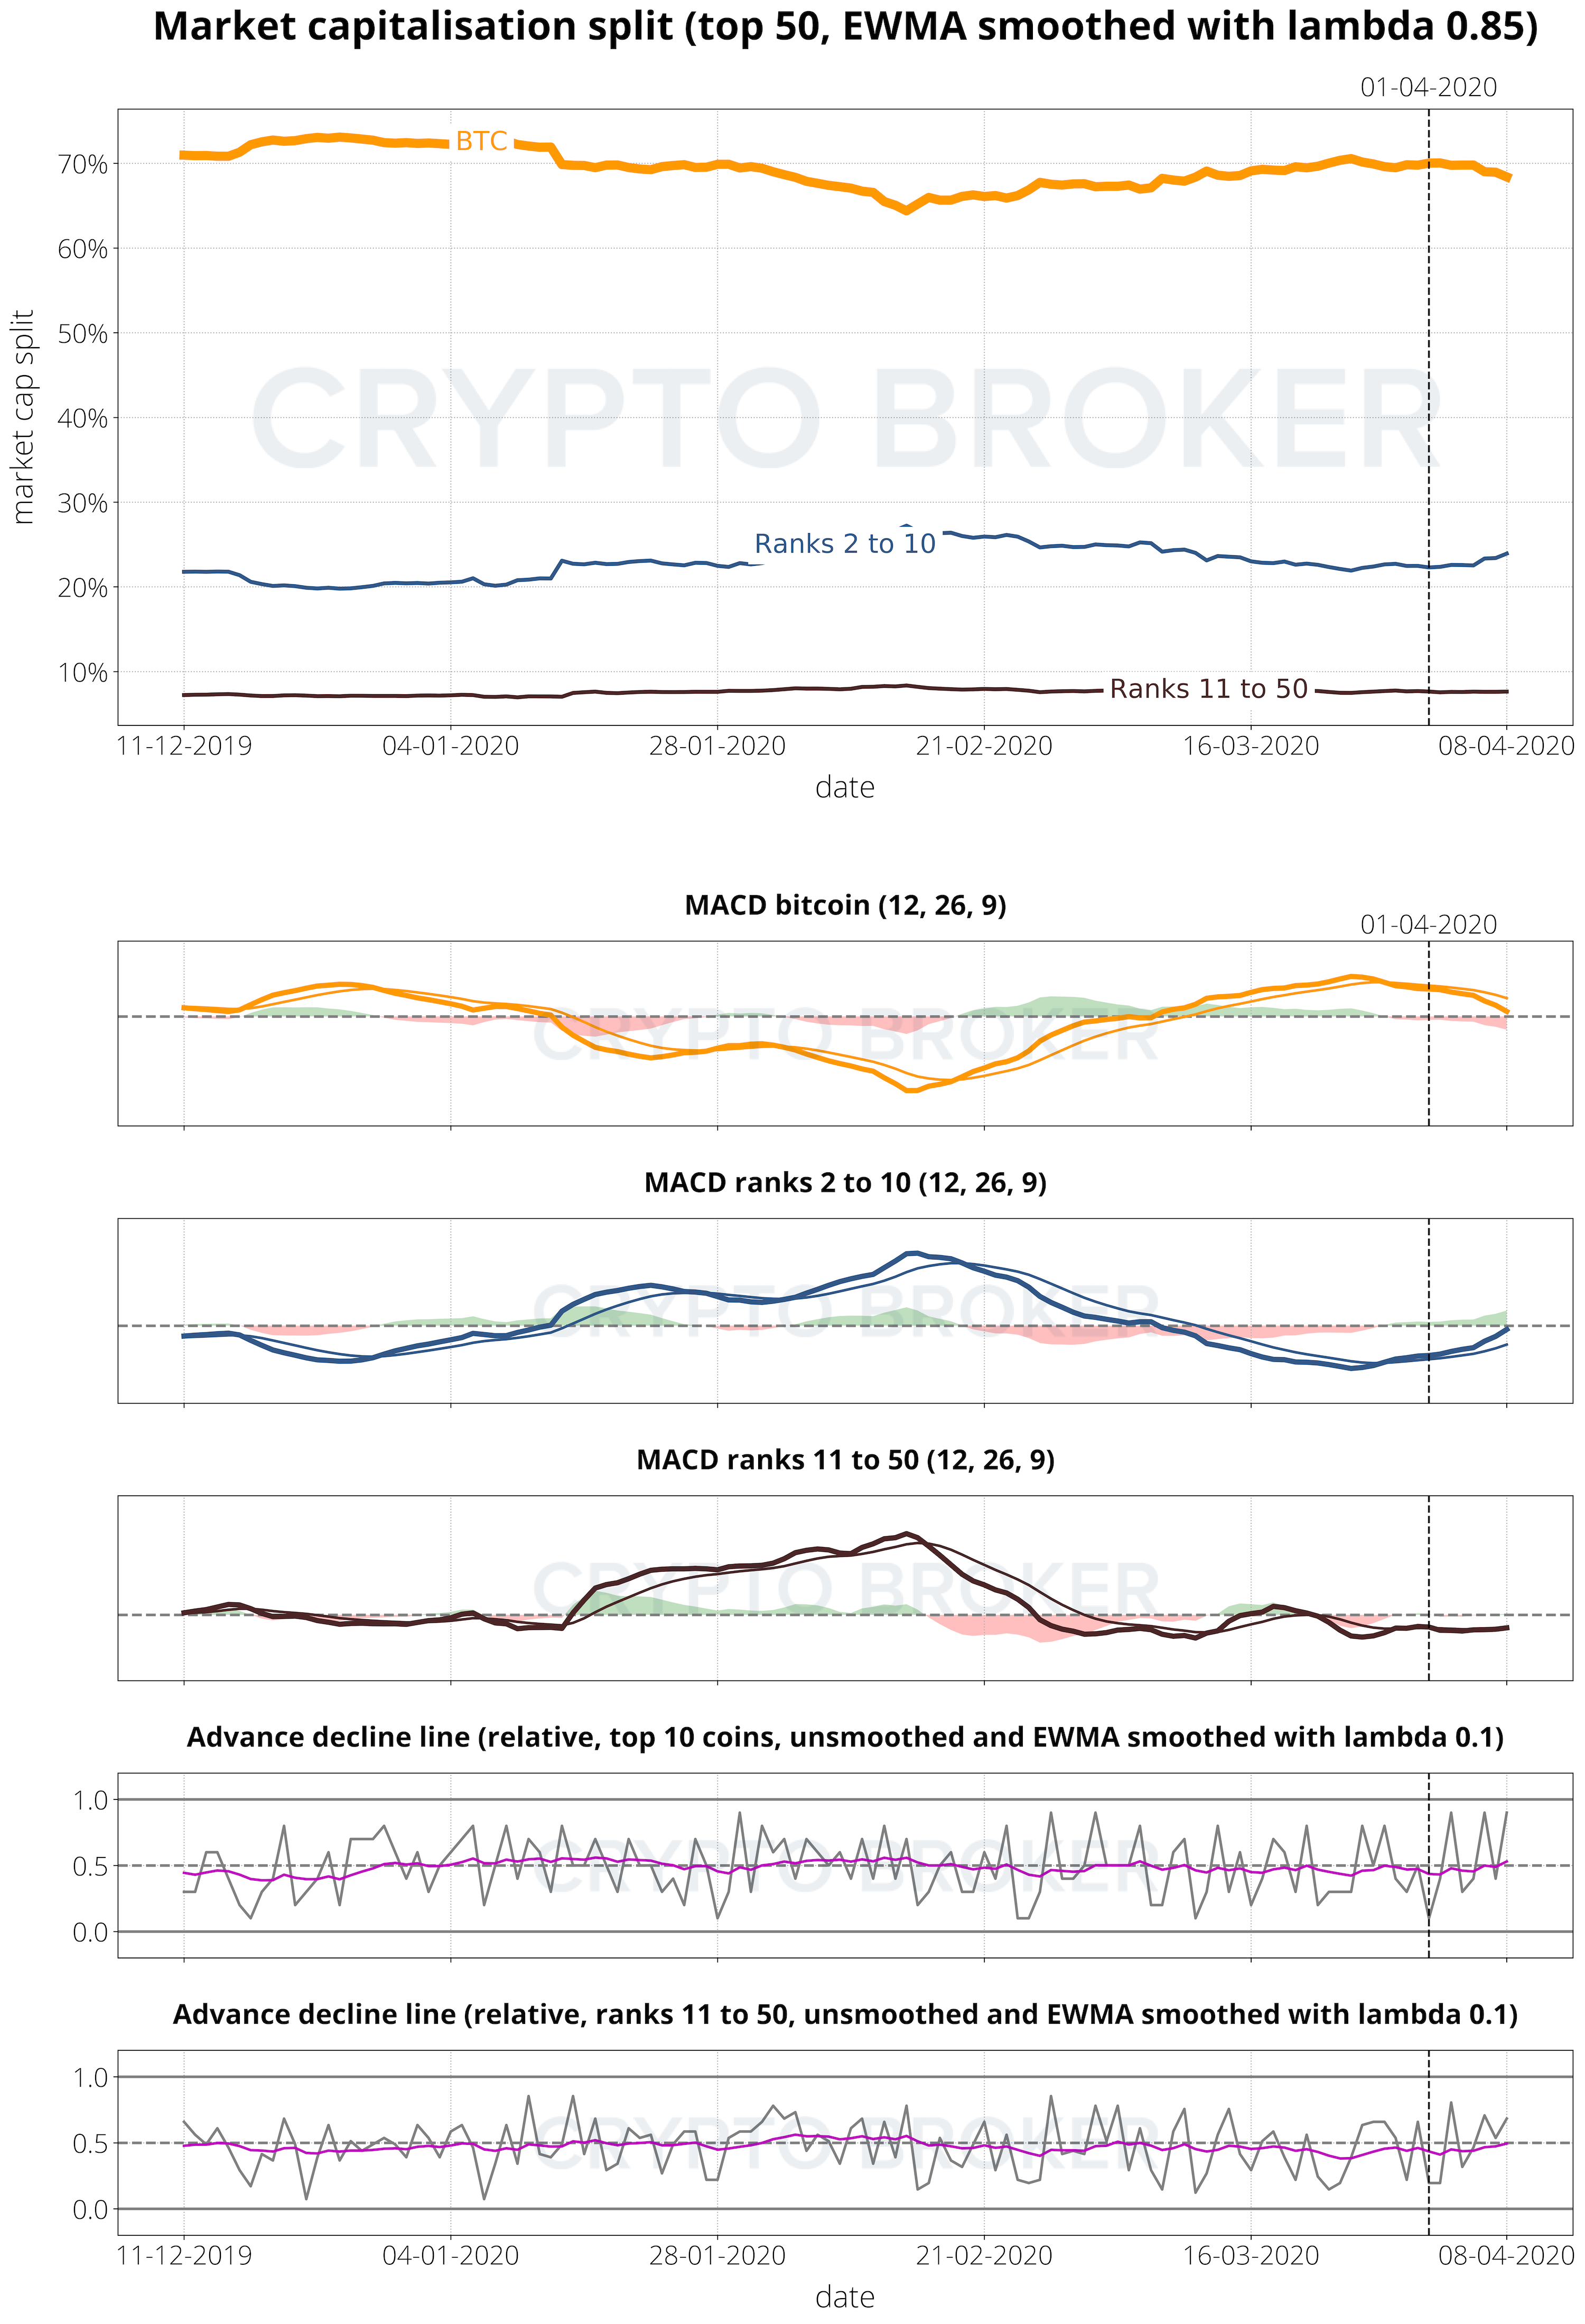
MACDs have changed for all coins. BTC moved from overbought towards the neutral zone. Coins ranked between 2 and 10 also moved from an oversold situation to a neutral one. All other coins remain neutral.
We have definitively experienced some attempts at crypto decoupling, but, generally speaking, cryptocurrencies have moved along the traditional market recovery path.
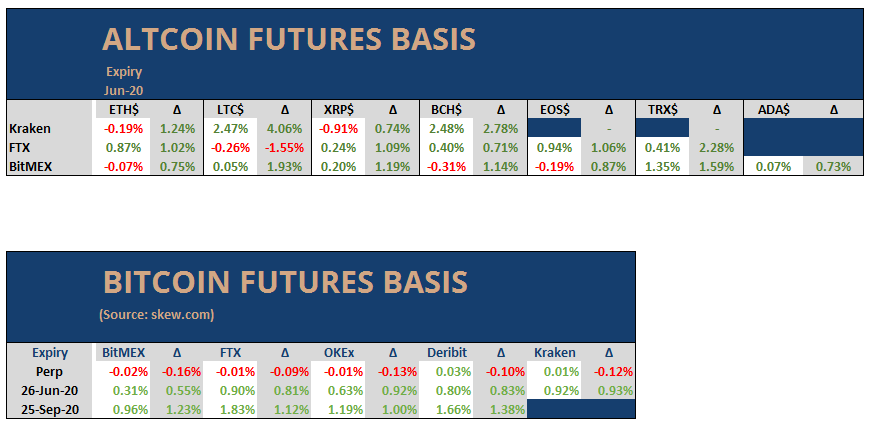
2 Altcoin Futures Basis Analysis
The situation for BTC and ETH futures is slowly changing towards contango again. BTC and ETH June 2020 futures are hovering around 0.5%. Other altcoins are also in slight contango. As far as the longer-term contract is concerned, the September 2020 contract is trading between 1% and 1.5%. This results in a pretty linear (or flat) curve from spot to September 2020. There is not much positioning that can be read or predicted from the future basis right now, and I believe it reflects the current state of the market very accurately, i.e. "no strong opinion".
Implied volatility remained at the same levels, and the term structure flattened some more. One month at the money BTC options are trading at 89%; two and three months are at 96%. ETH at the money options are trading between 105% and 115%.
ETH Futures experienced an increase in traded volume, whereas the overall open interest has been stable. Liquidations in both coins remained neutral.
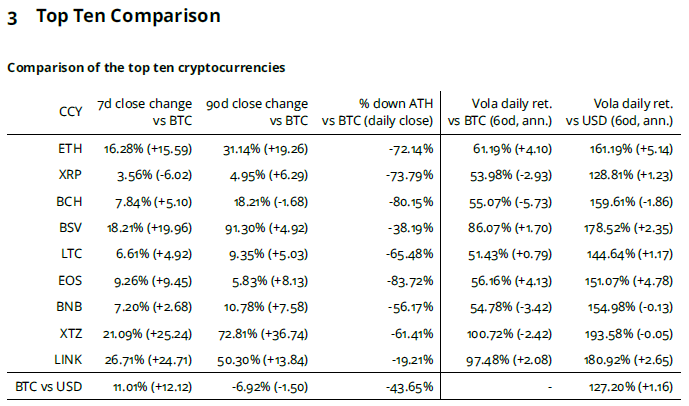
3 Top Ten Comparison
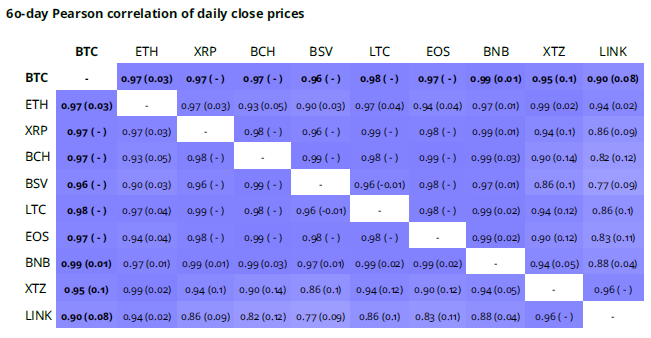
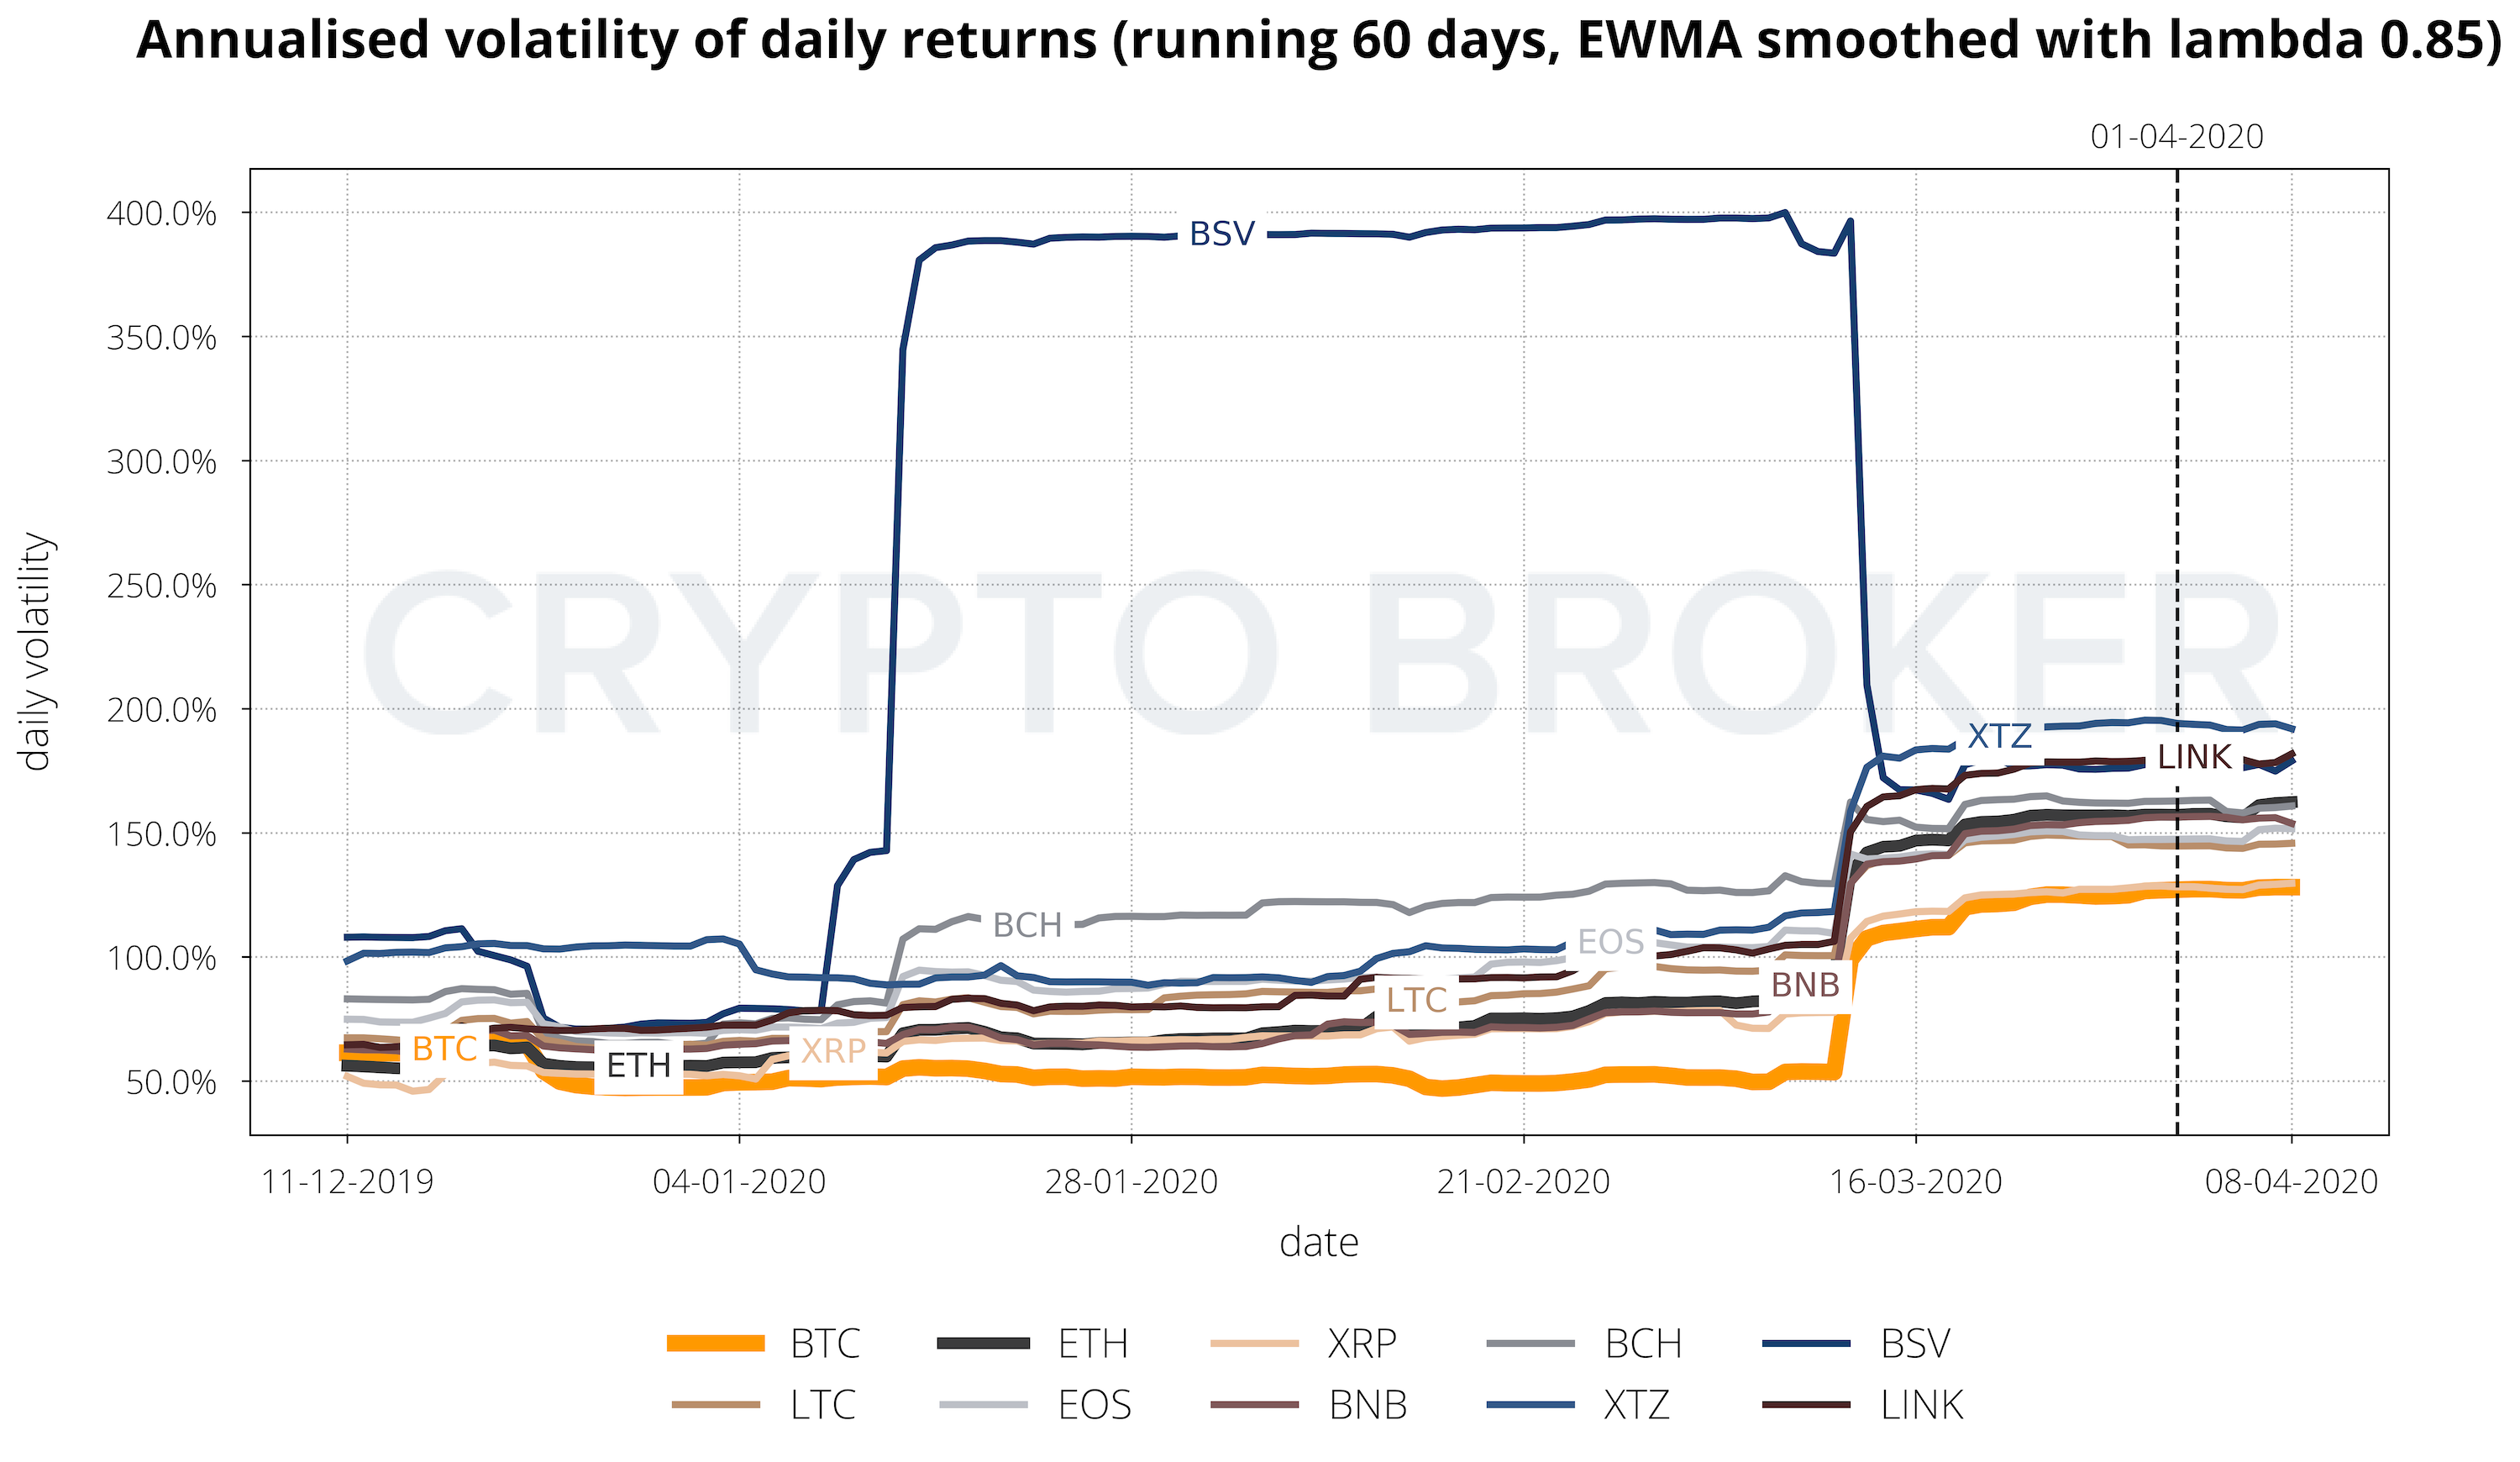
4 Volatility and Correlation Comparison

5 ETHBTC 4h Technical Chart Analysis
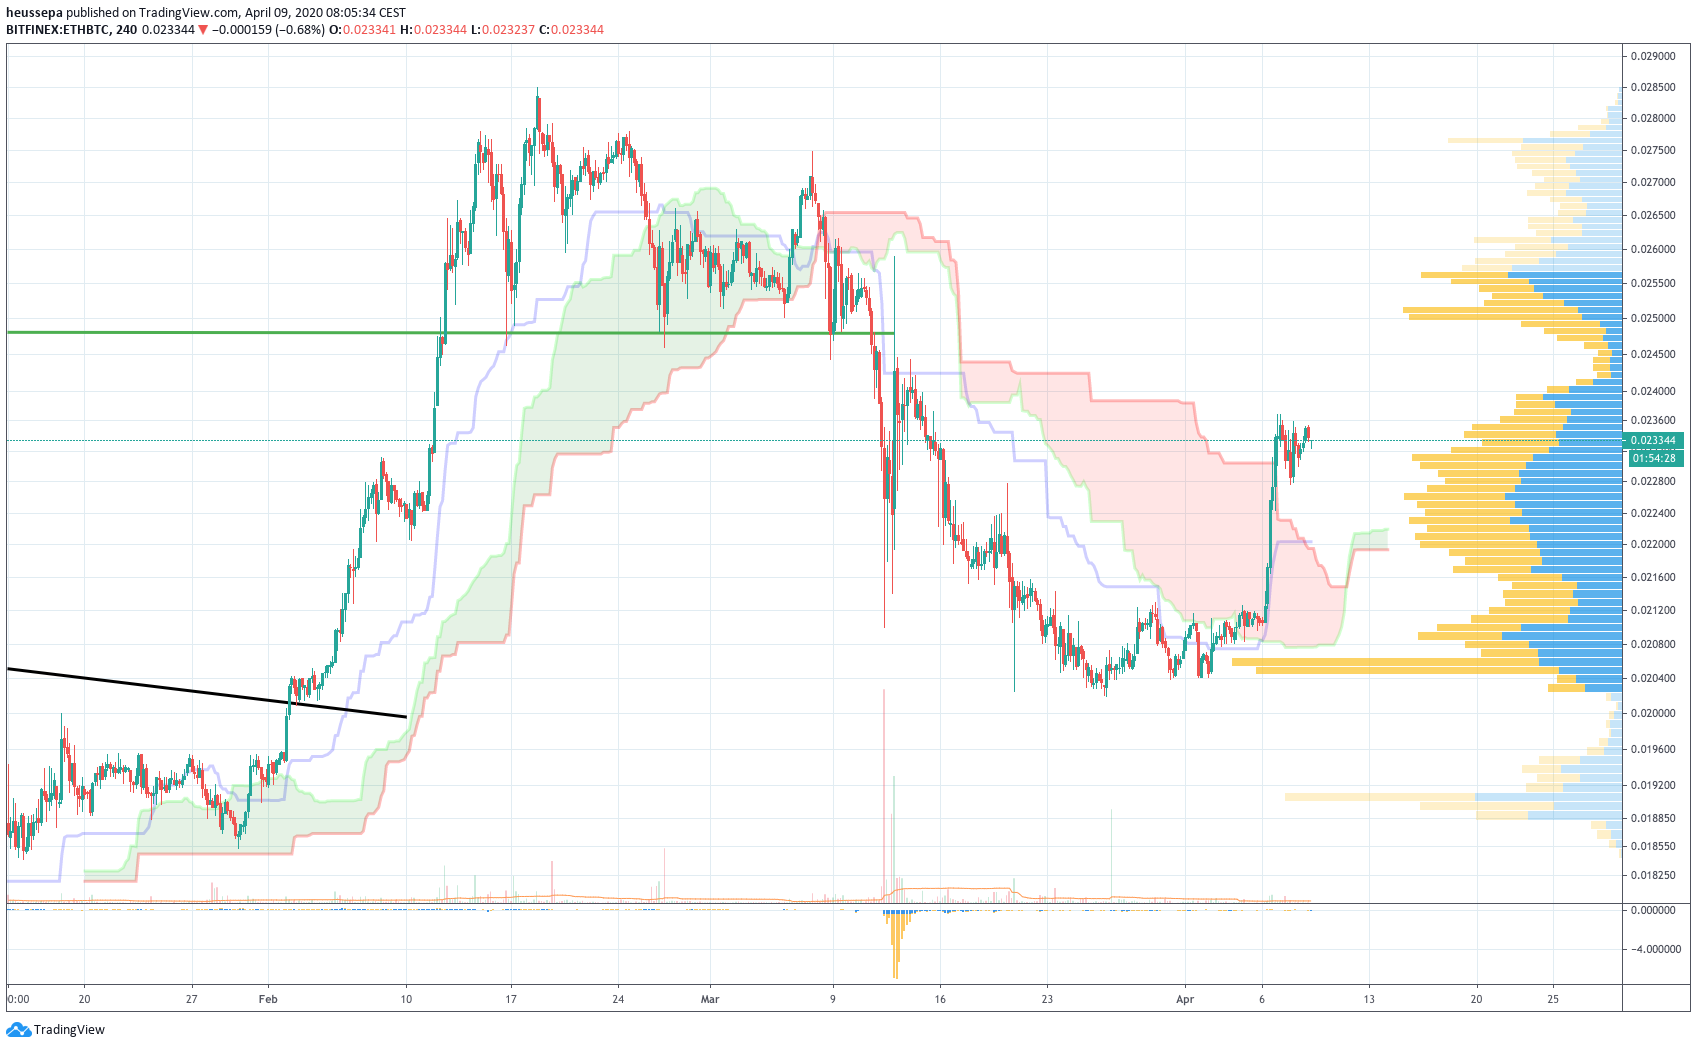
ETHBTC can be a beast
It did not take long after last week's Rotation Report for the pair to start a vertical ascent. You really had to be quick or have the breakout trade already entered into your trading system to buy when we went through the 0.02150 level. The price raced through the entire cloud with no stop in between.
Around 0.02360, we ran into some resistance, and over the past few days we have consolidated around the 0.0230 level. The tide has even shifted on the daily chart: we managed to break into the Ichimoku cloud.
On the back of this, I am currently only looking for long setups. Place your bids between 0.0230 and 0.0220. Additionally, have your break out order in if we post new highs (above 0.02370).
But please remember the above: ETHBTC can be a beast. It is very well possible that we will see an erratic move down before we attack the last major high of 0.02850. Adjust your risk capital accordingly when trading this pair.
View the charts: ETHBTC 4h & ETHBTC daily
6 Market Cap Overview
Glossary
Advance Decline Line - the Advance Decline Line shows the ratio of coins for which the market cap increased relative to the market cap of BTC for each day.
ATH - all time high (maximum lookback period of 730€ days).
Data Source - tables and charts are based on daily close prices provided by Coinmarketcap.
EWMA - exponentially weighted moving average.
MACD - moving average convergence/divergence is a popular technical indicator to identify trends in the underlying instrument. It consists of the MACD and signal line, and the area shown in the background. The MACD line (strong) is the difference of two exponential moving averages, which are defined by the first and second parameter of the indicator. The signal line (weak) is the exponential moving average of the MACD line defined by the third parameter. The area in the background illustrates the difference between the MACD line and the signal line.
Pearson Correlation - quantifies the linear relationship between two variables.
Spearman Correlation - quantifies the monotonic relationship between two variables. As such, the Spearman Correlation is based on the ranked values of each variable and is used to detect non-linear relationships between the two.
About the author
Patrick Heusser is Head of Trading at Crypto Broker AG. Prior to joining the company, Patrick worked as an Interest Rate Trader at UBS and held various positions in the IRCC (interest rate, commodity and foreign exchange trading) in London, New York, Singapore and Zurich. Patrick is an expert in trading and risk management. He also gained experience in other areas, such as building start-up companies. Patrick has a degree in banking from a business school. He has also taken various courses in technical chart analysis.
Related Articles


