
Technical Analysis
Good Morning!
Let's take look at the charts leaving our emotions out of it...
Bitcoin BTC$ (4h)
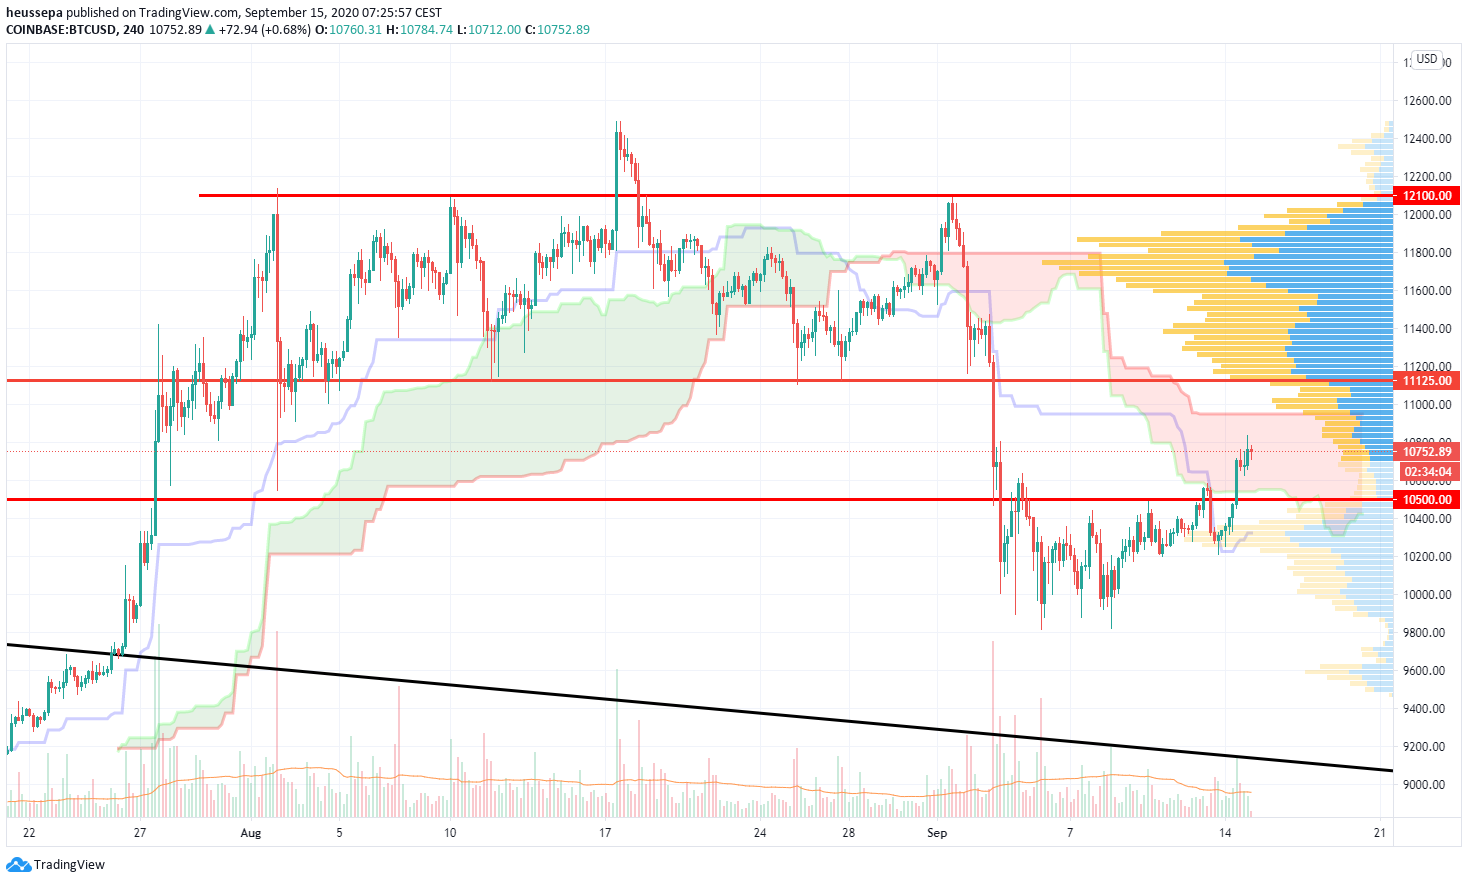
So far so good. The 10.5k level needed a second attempt before we could start trading higher. Many people are looking to short the market in the 11k region, which I too see as the next big resistance.
The push to the upside came from spot buying pressure across the various exchanges that have a good fiat onramp (e.g. Coinbase, Kraken, and Bitstamp). The future basis in the perpetual or term has not really moved or showed any signs of traders going crazy on leverage.
The new range to trade in is 10.5k - 11.2k.
Ethereum ETH$ (4h)
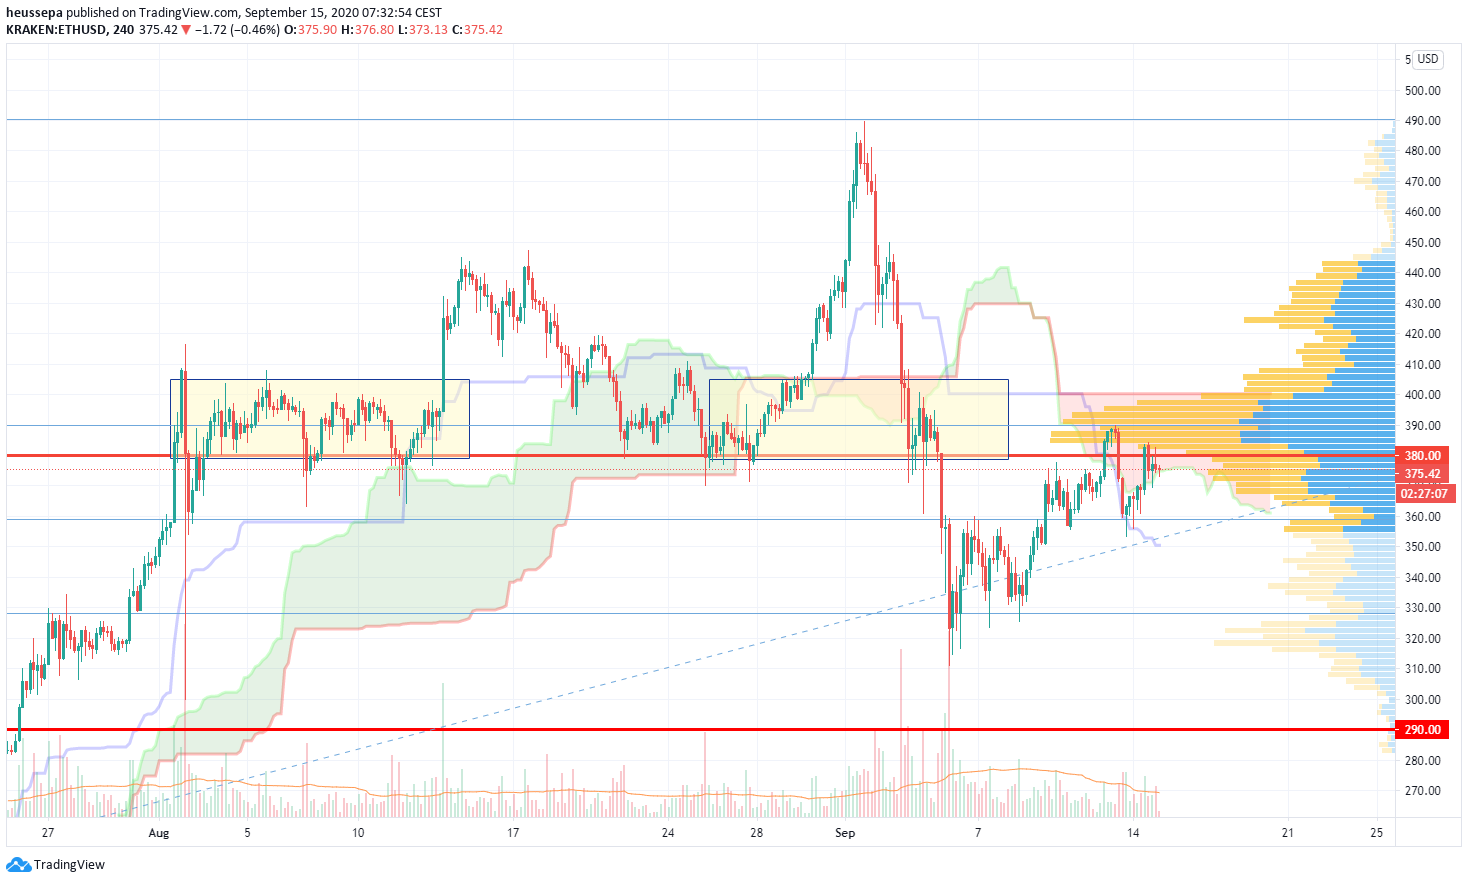
It took some time but we managed to break the $360 level. We also retested it later on as support. $380 is still the one to push through and prove that we can hold the price above it.
The large liquidity pool around the $390 level will most likely serve as a price magnet, and I think it is just a matter of time until we start trading in that region.
Until then, the range is $360-380, and on the wider longer term outlook $330-380, but with a tendency to break higher.
Ethereum/Bitcoin ETHBTC (4h)
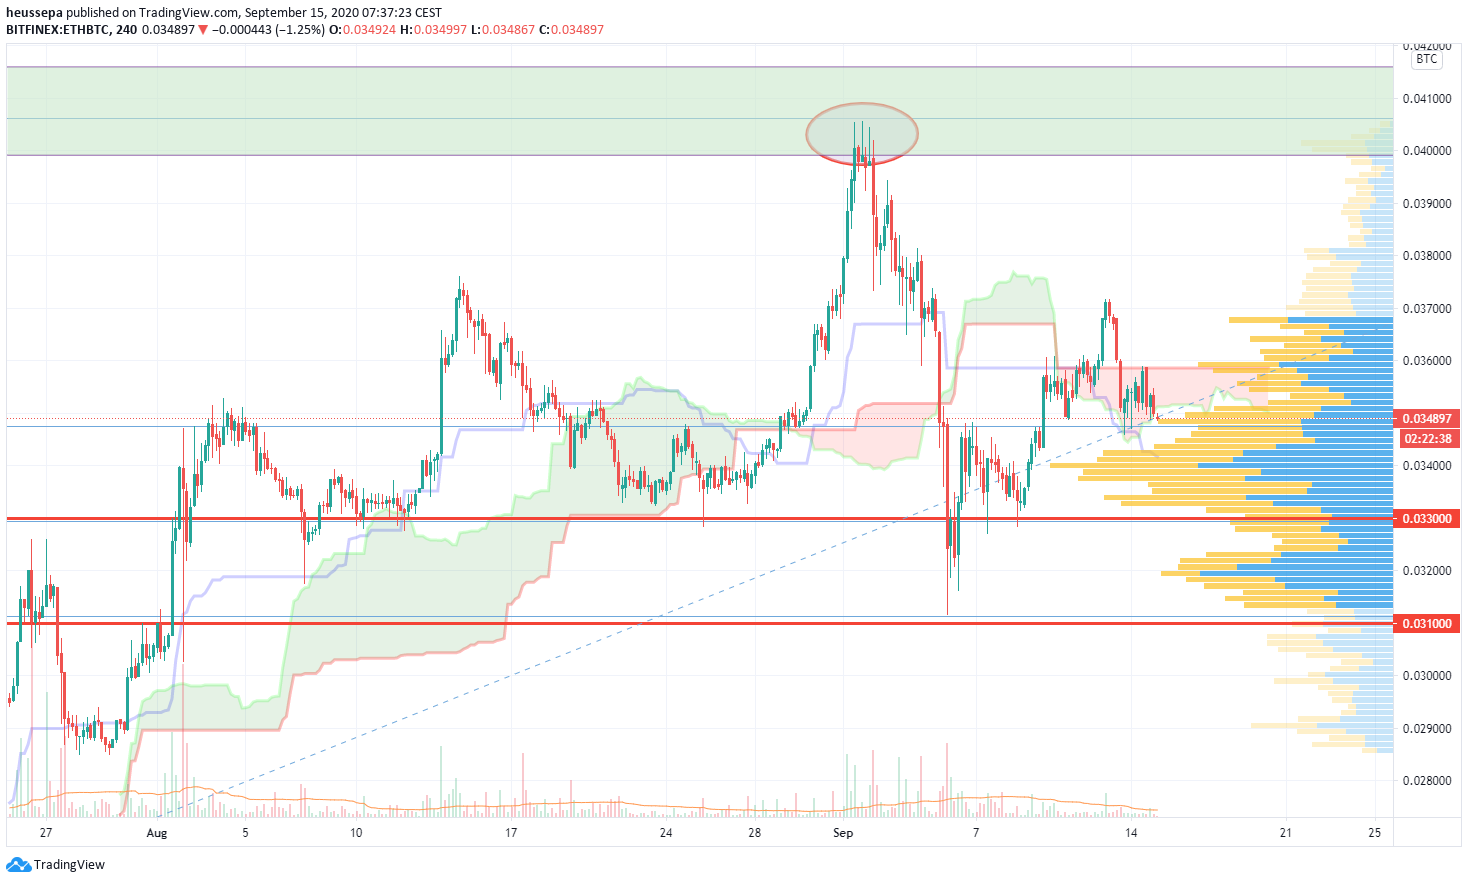
This pair played hard ball with me, but it did finally manage to return to a more neutral zone. I reduced my long position and will wait until the picture becomes more clear.
The 0.0330 level is key for me in terms of what position I will get into. Above it, I will look for long setups, and below it, I will look to go short.
Technical Analysis DeFi Coins
ATOM$ (4h) - Cosmos
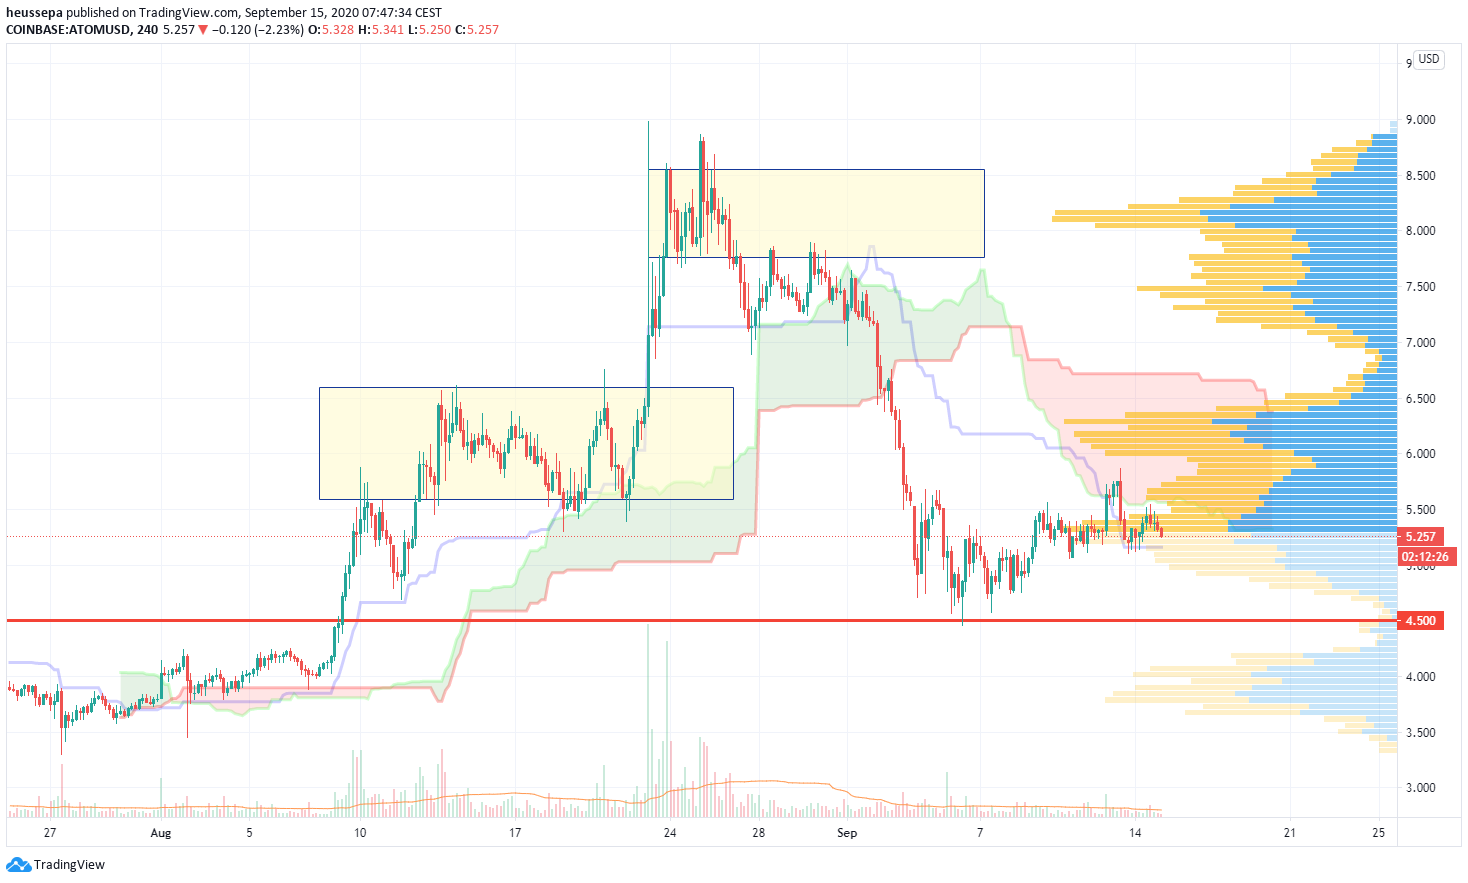
The current price action and recovery is rather disappointing compared to the rest of the DeFi space. The darling of interoperable blockchains is currently DOT (Polkadot), but more on that later...
$4.50 is key for the bulls: there is really nothing more that can be said right now.
DOT$ (4h) - Polkadot

Due to the lack of data I did not chart this one. But it makes sense to slowly but surely start focusing on it.
I do not want to see the price below $3.70. In the short term $5.20 could provide some support (upper band of the Ichimoku cloud). If we fail to hold that level, however, we might go back down to the next liquidity pool at around $4.70.
On the topside, I see $6.40 as a reasonable target, where I am guessing that some supply will come in.
BAND$ (4h) - Band Protocol
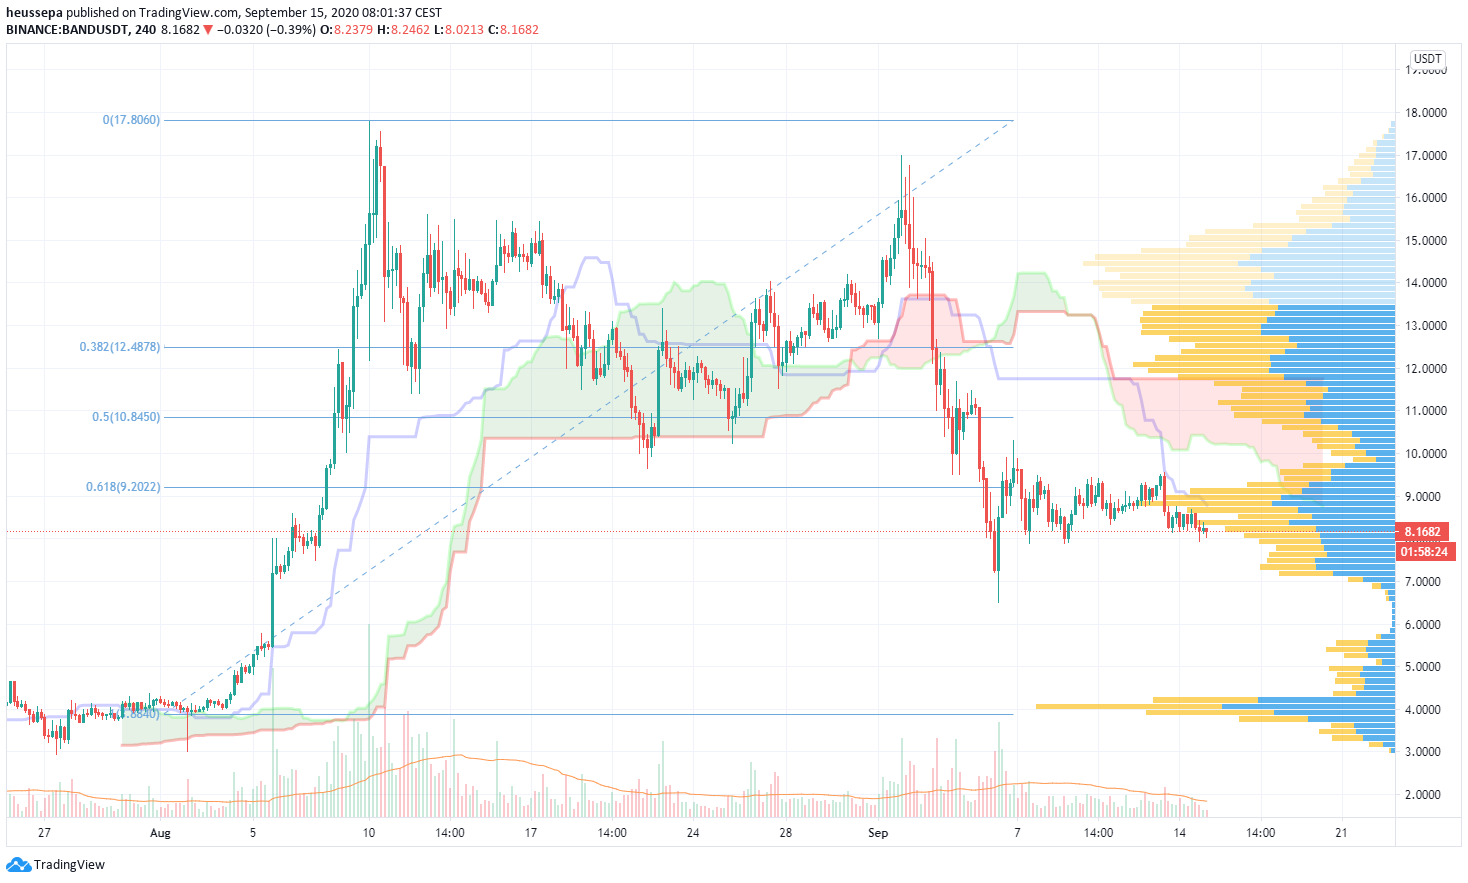
It has been a pretty disappointing recovery so far. But it looks like the current correlation to other DeFi sector coins is not that high. The oracles (LINK as well) are not impressed by the recovery of some of the other coins.
LINK$ (4h) - Chainlink
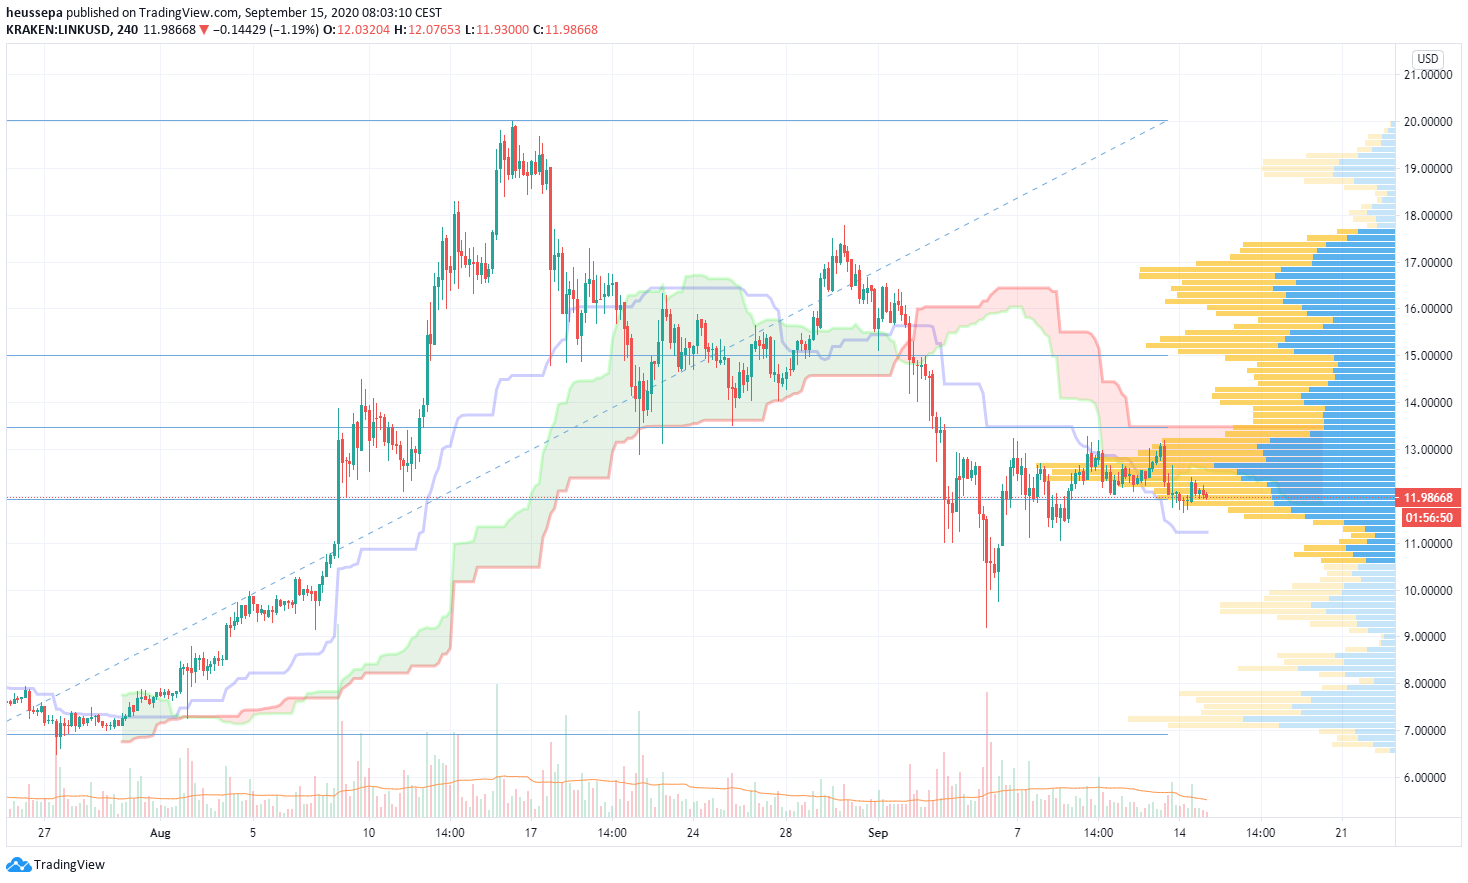
Not much to add here... We are seeing sideways consolidation with no real indication as to where this puppy wants to go.
LEND$ (4h) – Aave

This one showed some nice strength and recovery. Some redistribution is taking place between $0.65-0.70. If we can continue to hold that level, the Ichimoku cloud will turn bullish, and the price will be above the upper band. This is the constellation I need to see before I add to my longs.
YFI$ (4h) - yearn.finance

This is THE hottest coin on the block right now. The volatility of this asset is insane, but it caught my attention the first time it traded above the price of BTC$.
I did not fully grasp the concept behind it until it was too late, and "pow" we were at $39k. My plan was to establish a long position by hoping that we would correct from that level, and luckily we did. I was able to get into a nice position on the way down.
I see $22k as the support zone, which will also be the level where I need to revise my long position. But until then, in the medium term, I am looking for $50k or even $75k.

