
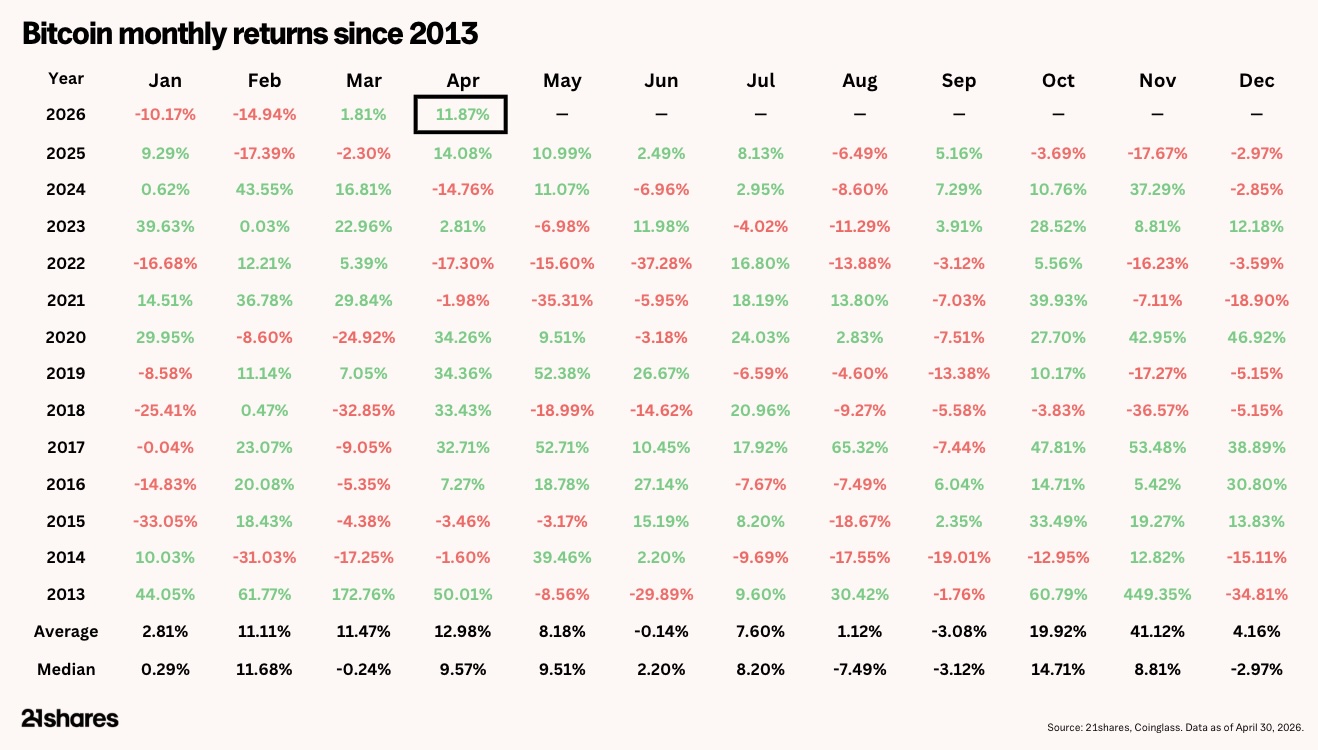
April delivered Bitcoin's strongest monthly performance in over a year. The asset rallied as the geopolitical backdrop shifted from conflict to de-escalation. Importantly, the move tested the $78k resistance level. Specifically, patient capital flows, an improving geopolitical picture, and a risk-on rally across equities drove the action.
Yet despite the momentum, this still looks like a bear-market rally rather than a confirmed regime change. The current level has held as resistance. Meanwhile, the macro backdrop has not fully cleared, and the foundation is strengthening. Trend confirmation, however, has not yet arrived.
What happened in April?
First, the AI theme came storming back. Meanwhile, a "ceasefire" was achieved in the Middle East, although the Strait of Hormuz remained closed. In addition, Kevin Warsh got back on track to be confirmed as the new Fed chair. As a result, March's equity sell-off was quickly forgotten. Strong earnings from Intel and TSMC triggered a sharp rebound in technology stocks. Anthropic's latest "Mythos" model announcement also helped.
In the Middle East, the US and Iran announced a two-week ceasefire beginning April 8. Oil fell initially on the news. However, prices recovered strongly through the second half of the month. By then, it had become clear that no lasting accommodation was forthcoming. At the time of writing, the Strait remains closed. Furthermore, the oil futures curve sits in historic backwardation. Buyers are paying record premiums for immediate delivery. Consequently, that dynamic continues to feed through into inflation expectations.
On the policy front, the DOJ dropped its investigation into Chair Powell. As a result, the path cleared for Warsh's nomination to advance. Markets, however, are pricing in zero rate cuts for the remainder of 2026. In short, the incoming chair inherits an environment with little room to ease. Specifically, energy-driven inflation reinforces the higher-for-longer backdrop that has defined the macro ceiling throughout 2026.
Reasons supporting crypto's price action
April's geopolitical tone differed from March's. Rather than further escalation, the month was defined by the first sustained discussions around resolution. Trump's odd posts were the exception. Polymarket odds for a mid-year peace deal peaked above 80% before settling back. Notably, those were the highest readings since the conflict began. In effect, markets responded to the directionality rather than waiting for the destination. As a result, they priced in a world where the situation resolves rather than deteriorates further.
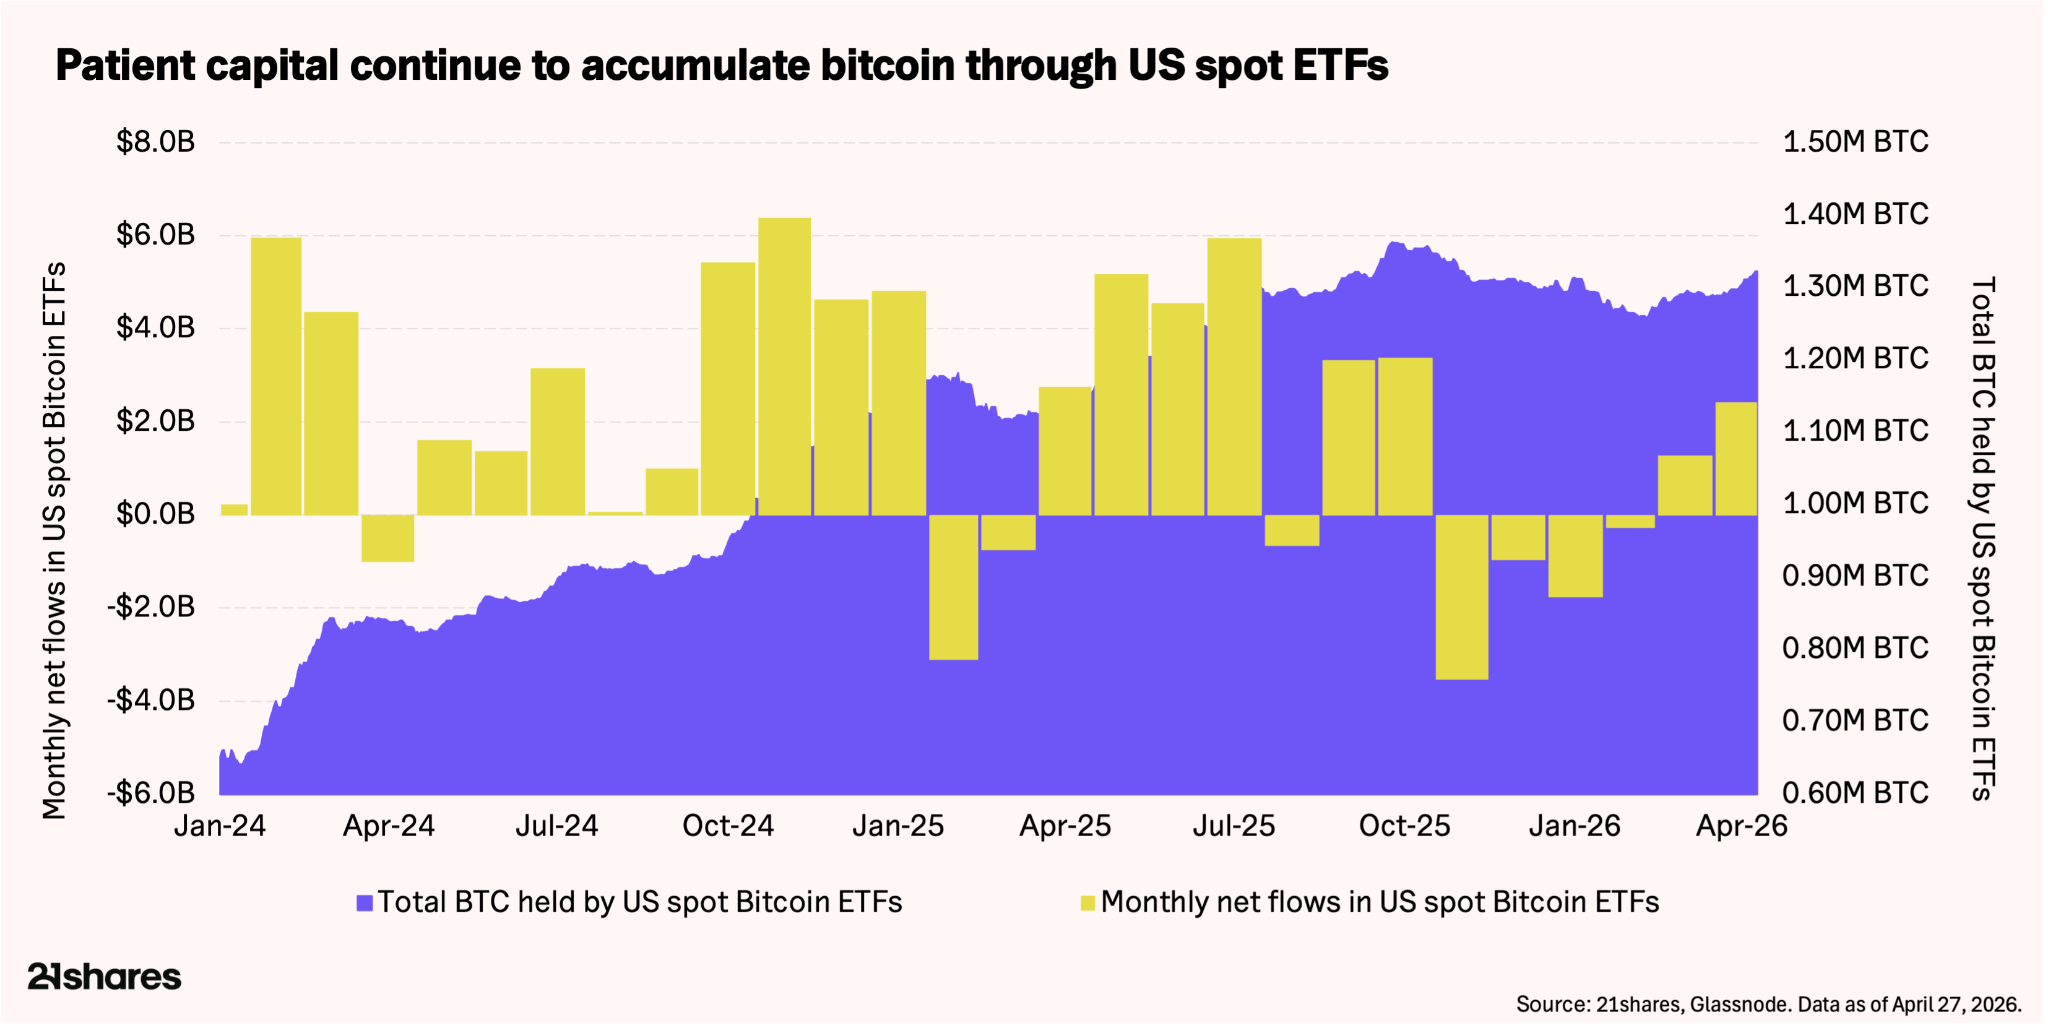
The flow picture has become the clearest signal here. Specifically, the holders that matter most treat this correction as a buying opportunity. US spot Bitcoin ETFs absorbed roughly $2.4 billion in net inflows during April. In fact, that was the strongest month in dollar terms since the October crash last year. Total ETF holdings now stand at approximately 1.31 million BTC. Furthermore, they are trending toward new highs despite prices remaining over 40% below the 2025 peak.
Corporate treasuries remain an equally powerful flywheel. Strategy made its third-largest Bitcoin purchase on record. Specifically, the firm acquired 34,164 BTC for about $2.54 billion, lifting holdings above 815,000 BTC. Increasingly, Strategy funds these purchases through preferred instruments like STRC. In fact, STRC has seen over $2.1 billion in offerings since launch. In short, this is large-scale demand that prior cycles simply did not have.
Early risk appetite is returning, but remains limited
Behind both, the institutional product pipeline keeps widening. Goldman Sachs filed for a Bitcoin Premium Income ETF. Meanwhile, Morgan Stanley rolled spot crypto to about 16,000 advisors. In addition, BlackRock's yield-focused Bitcoin ETF is expected imminently. As a result, the market structure looks fundamentally different from prior cycles. Stable hands dominate. Reflexive unwinds have eased. Moreover, the base of institutional buyers with multi-year horizons keeps widening. Indeed, patient capital is building the floor on which confirmation will eventually stand.
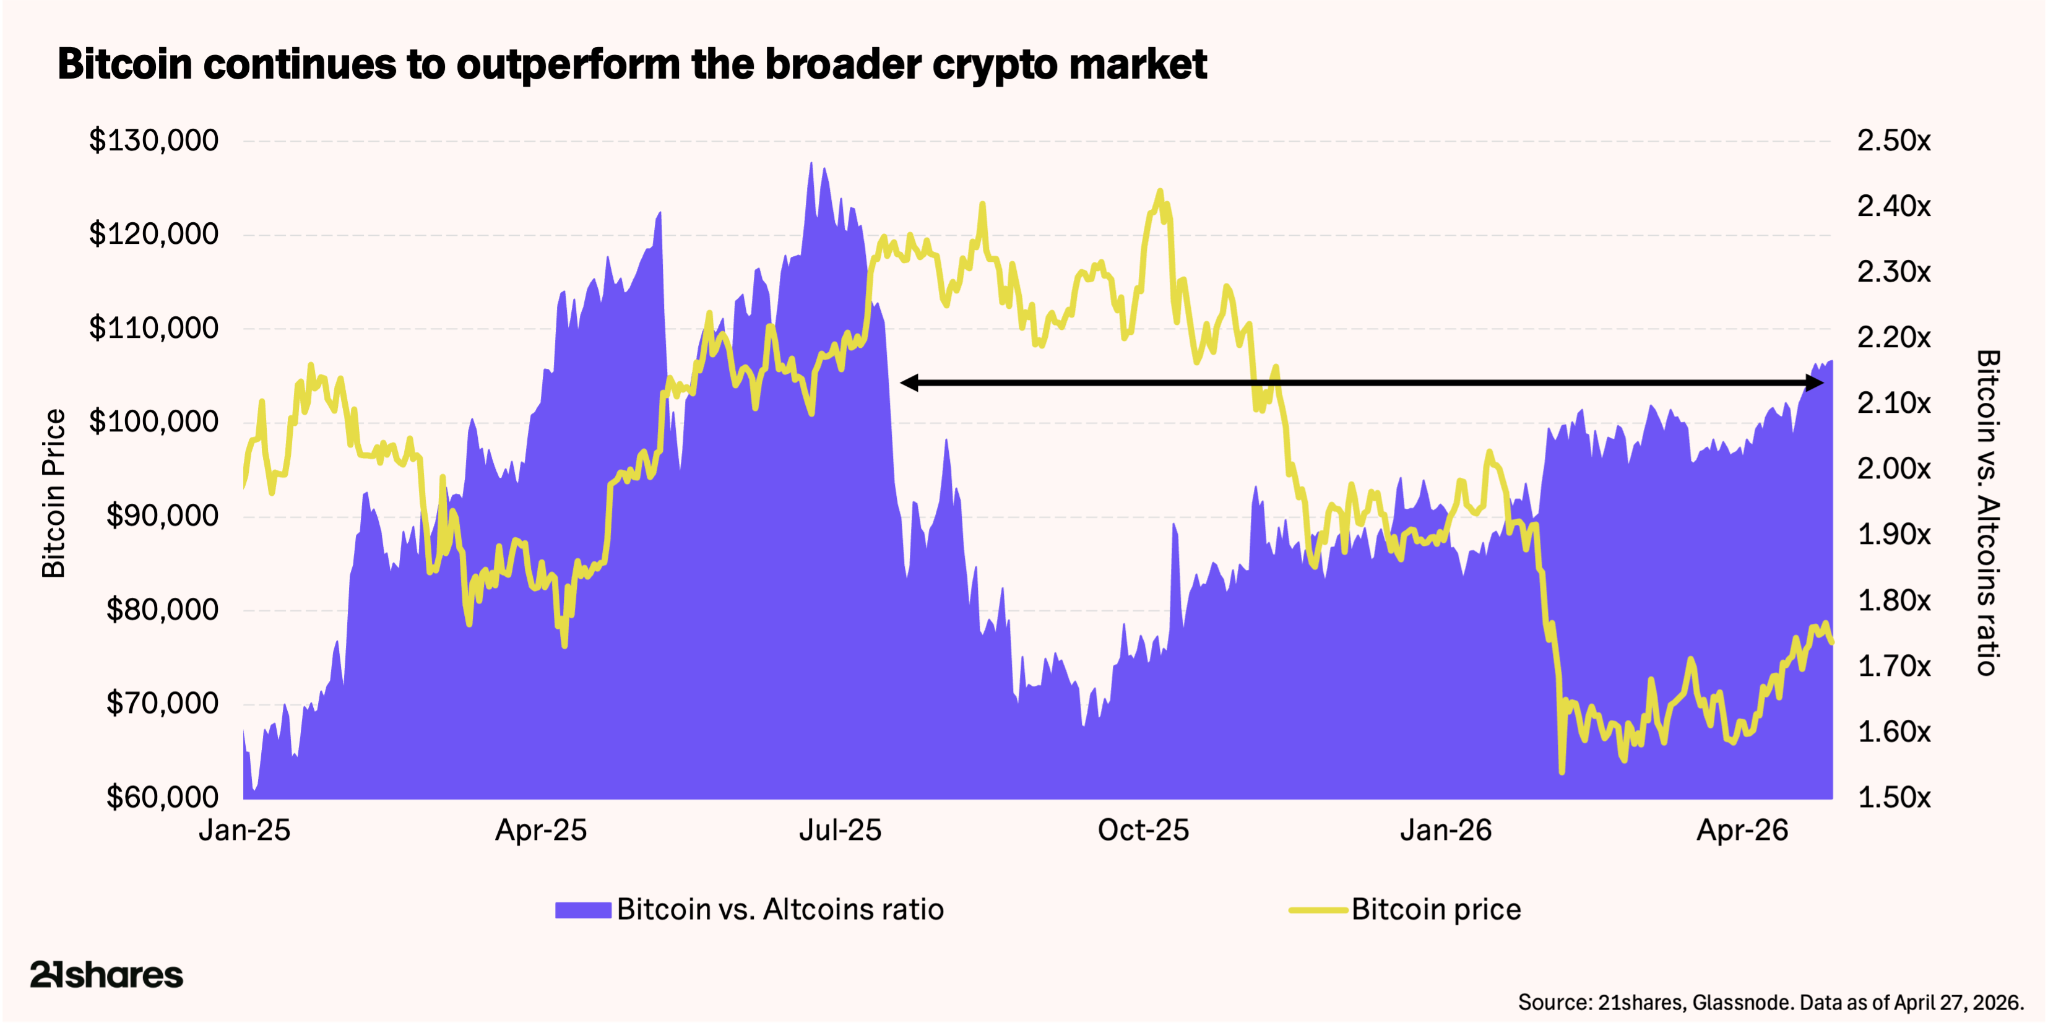
The first two dynamics help explain a third. Capital is moving up the risk curve, but slowly and selectively. Notably, the BTC vs. altcoin market cap ratio climbed to about 2.17x, its highest since mid-2025. Bitcoin and Ethereum (also up around 10% on the month) continue to absorb the lion's share of flows. Meanwhile, the broader altcoin market struggles. In short, this reinforces the "quality over breadth" theme.
This is a classic hallmark of early rotation. In prior cycles, capital has moved up the risk curve in stages, with Bitcoin followed by large-caps. Indeed, we appear to be in the opening phase of that sequence. Geopolitical uncertainty remains. Furthermore, the institutional flywheel is structurally geared toward Bitcoin. As a result, the largest and most liquid asset continues to benefit disproportionately.


Key fundamentals and items to watch
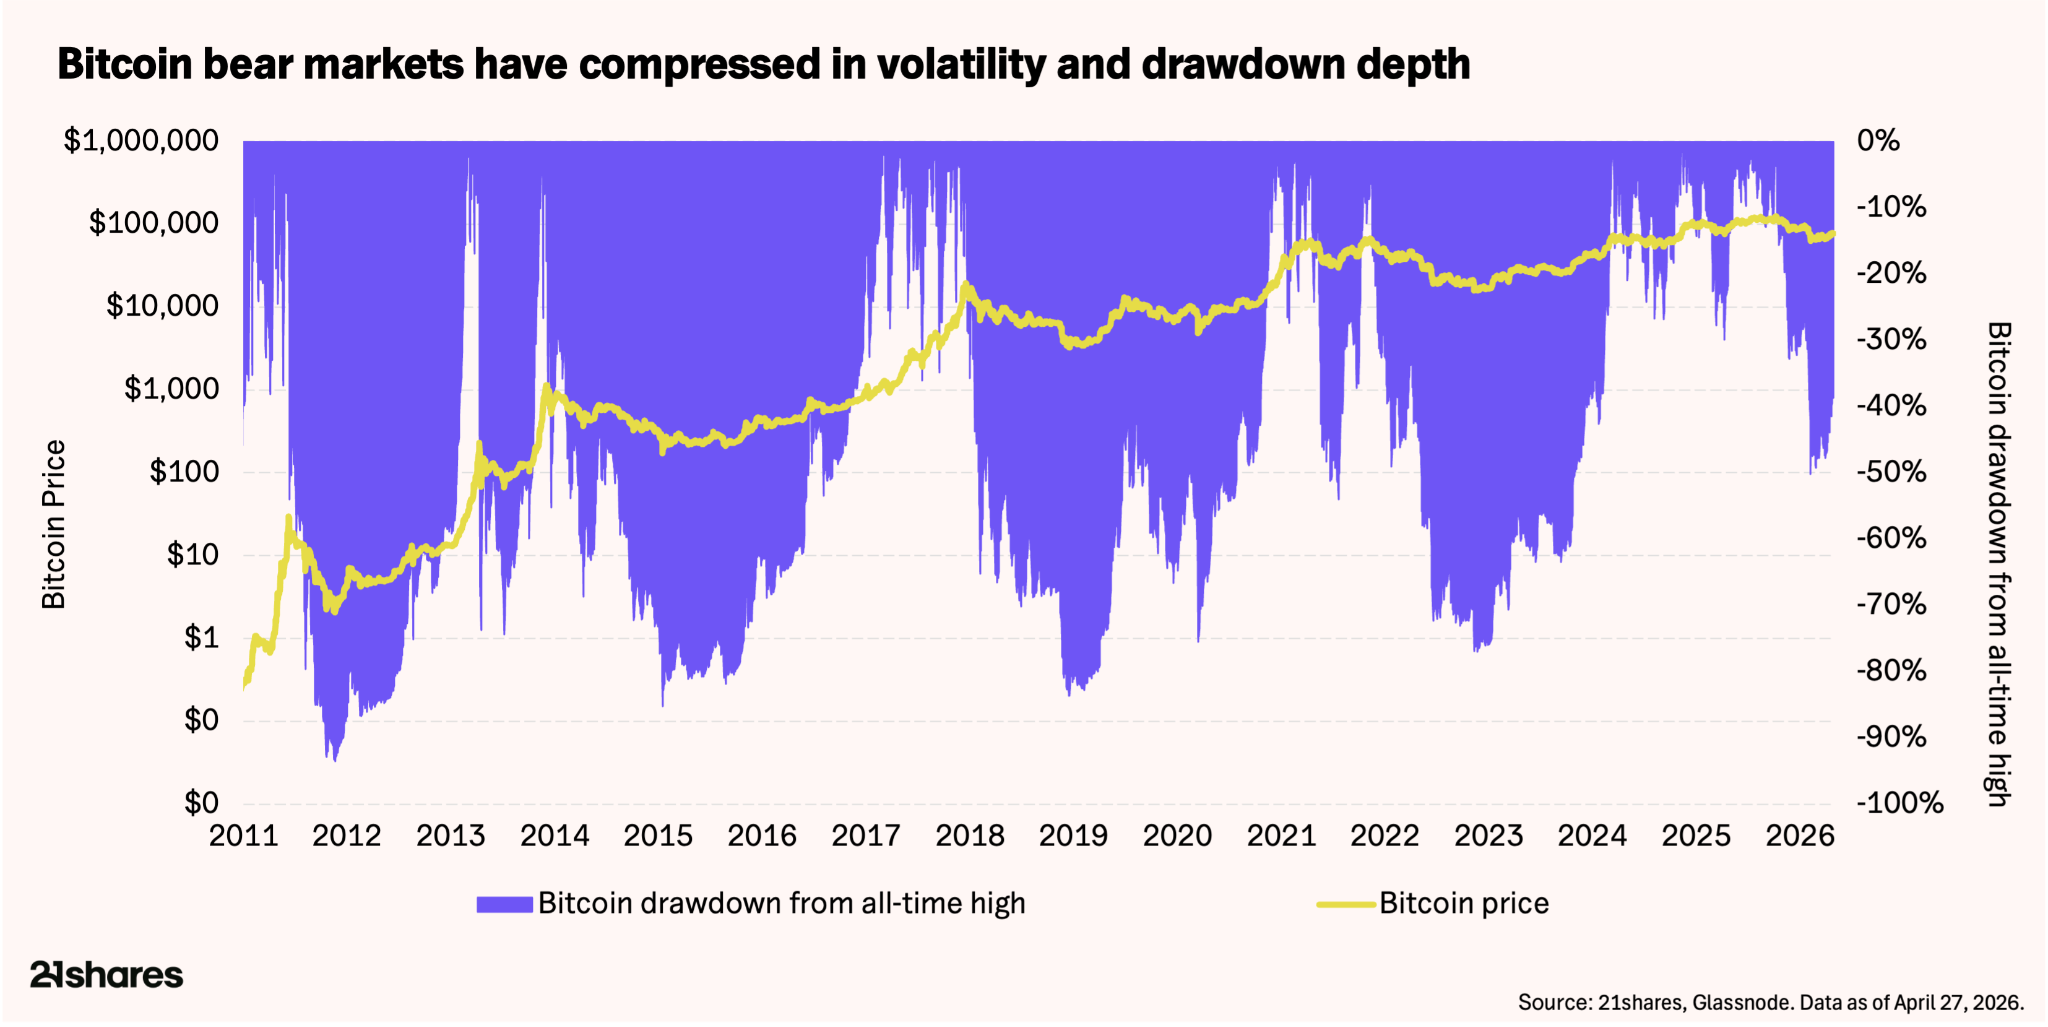
Each successive cycle has seen shallower drawdowns. The current maximum decline from the October 2025 high sits at about 50%. By comparison, the prior-cycle average was roughly 82%. In short, patient capital is compressing the severity of corrections in ways prior cycles could not. Still, patience may be warranted. We are roughly six or seven months into the current drawdown. Meanwhile, prior cycles have typically taken around a year from peak to trough. Whether patient capital compresses the duration as well as the depth remains an open question. In the meantime, significant sidelined capital is likely waiting for confirmation before redeploying.
April marked the halfway point between the April 2024 halving and the next expected reduction. For miners, the picture is mixed but not alarming. The hash ribbon indicator re-entered capitulation territory in late March. Specifically, the 30-day hashrate MA slipped below the 60-day. In short, this suggests renewed stress among less-efficient operators. Notably, elevated energy costs from the Strait disruption are driving the squeeze. For context, energy represents over 90% of miner OPEX. Daily revenue (about $33.5 million) sits roughly 24% below its trailing yearly average. However, it remains well above levels historically associated with forced capitulation.


