Close Menu
Crypto Valley Journal
    Facebook X (Twitter) Instagram
    Crypto Valley Journal
    • Hot Topics
      • News
      • Minds
    • Focus
      • Background
      • Blockchain
      • Legal & Compliance
      • Non-Fungible Token (NFTs)
    • Investing
      • Markets
      • Financial Products
      • Decentralized Finance (DeFi)
      • Exchange overview
    • Education
      • Basics
      • Glossary
      • Politicians on crypto
    • Statistics
      • Bitcoin-ETF-Flows
      • Ethereum-ETF-Flows
      • Crypto market data
      • On-chain data
    • Academy
      • Overview
      • Part 1: Blockchain
      • Part 2: Money
      • Part 3: Bitcoin
      • Part 4: Cryptocurrencies
      • Part 5: Decentralized Finance
      • Part 6: Investing
    • English
      • Deutsch
    Crypto Valley Journal
    You are at:Home»Markets»Market Review»Monthly Rotationreport
    rotationreport

    Monthly Rotationreport

    By Patrick Heusser on 10. September 2020 Market Review

    Monthly Rotationreport from Patrick Heusser, Crypto Finance AG

    Content

    • 1 Rotation Analysis
    • 2 Altcoin Futures Basis Analysis
    • 3 Top Ten Comparison
    • 4 Volatility and Correlation Comparison
    • 5 ETHBTC 4h Technical Chart Analysis
    • 6 Market Cap Overview
    • Glossary

    1. Rotation Analysis

    Market correction

    Altcoins have been trading in a wide range: approx. 15% between 60 and 70. We have therefore revised the support and resistance levels. Ethereum (ETH) was on a roller coaster ride in terms of price movement: USD 320 and USD 480. The MID Index and Shit Index experienced a similar market environment, as the DeFi space began to correct and consolidate. The MID Index eventually began trading in a narrow bandwidth, with good potential to break the resistance level of 82.50. The SHIT Index has shown strength during the course of the market correction that began in September; it has recovered very quickly.

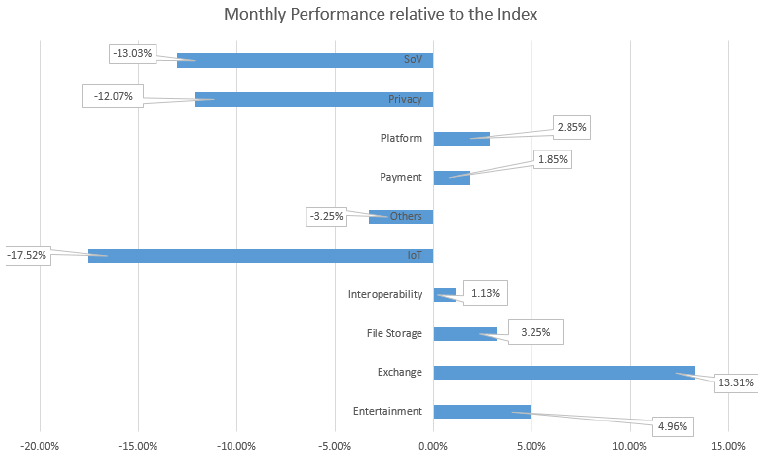
    During the last 30 days, there has been quite a shift in sector performances. Platform and Interoperability are still among the winners, but Exchange, Entertainment, and File Storage outperformed all of the sectors. The ongoing DeFi hype is serving to create many new interesting projects. This has led to the relevant coins being traded on decentralised platforms and finally being listed on centralised exchanges.

    Attached you will find our short-term view on support and resistance levels for all three indices:

    Alt: Support 63.50 / Resistance 70.00 / Alt (4h)
    Mid: Support 77.40 / Resistance 82.50 / Mid (4h)
    Shit: Support 104.00 / Resistance 122.00 / Shit (4h)

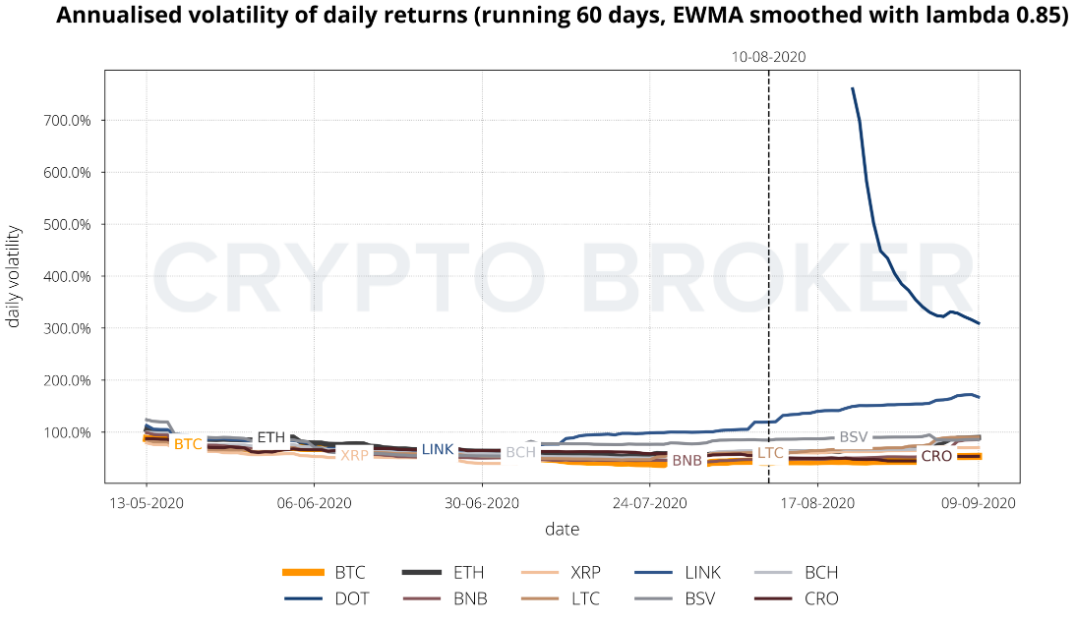
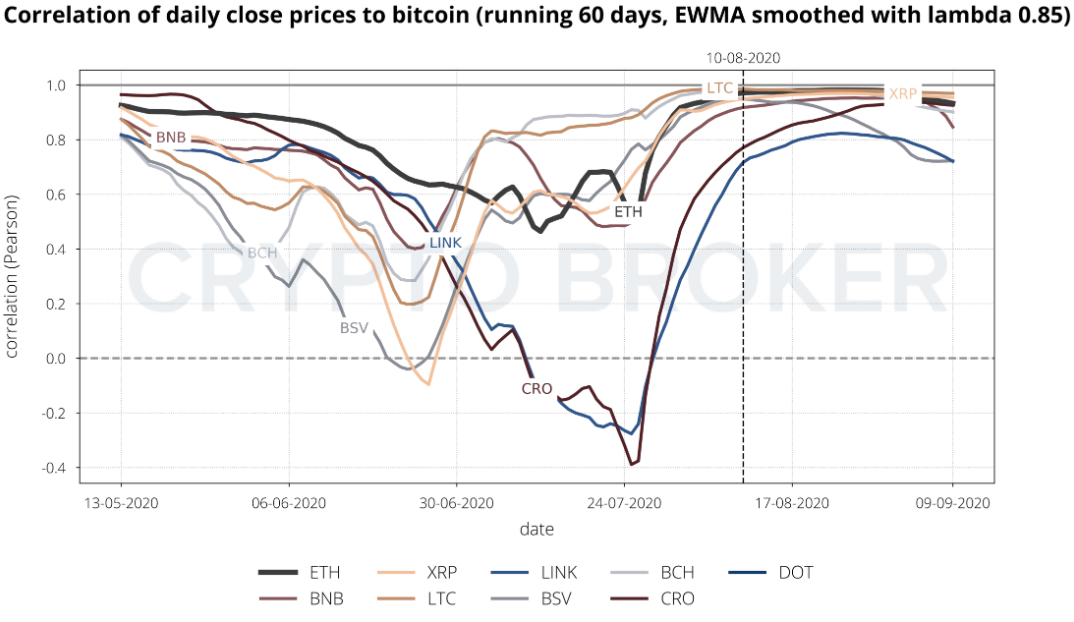
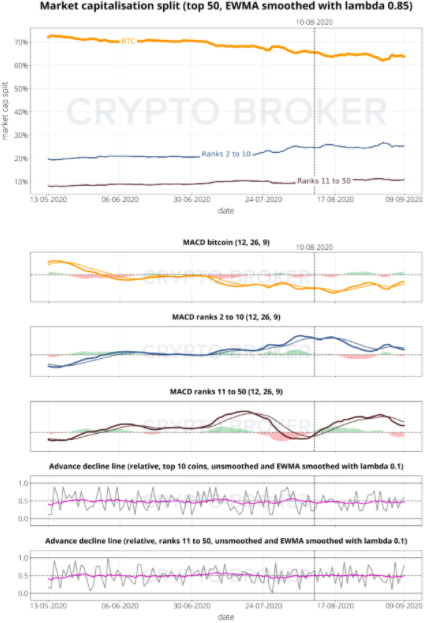
    In general, trading volume has been high, but also very volatile due to the current market situation. The volume peaked during the market correction at the beginning of September. The MACDs for Bitcoin (BTC) have not changed greatly and remain in an oversold zone. It has been another month of smaller coins being in favorr, but due to the market corrections they shifted from overbought to the neutral zone. Coins ranked between 2 and 50 remain overbought. Correlation has smoothed out a bit, but this very much depends on the sector in question and on which coins are specifically being compared to each other.

    Figure 1: Sector Rotation

    2. Altcoin Futures Basis Analysis

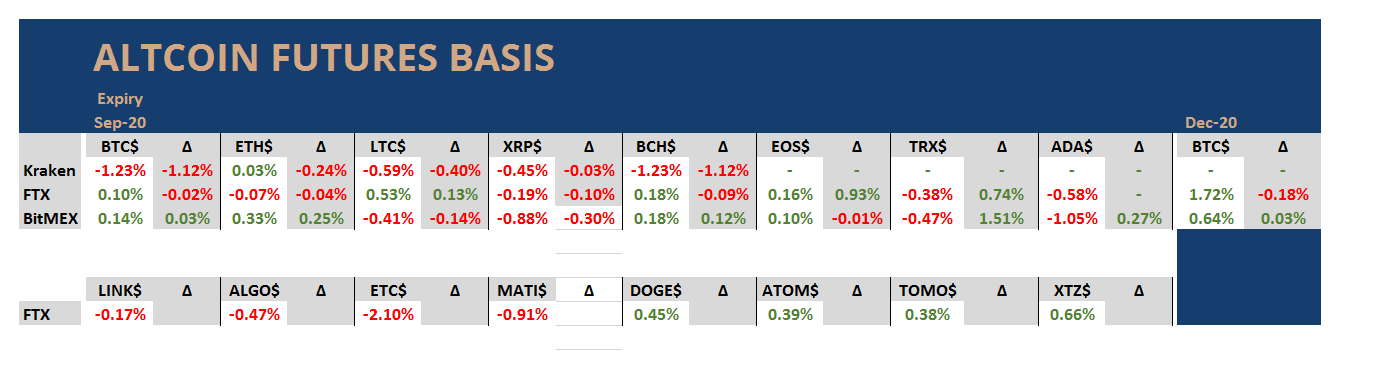
    The overall situation for term futures has changed from contango to neutral; we are sometimes even seeing backwardation depending on the market situation. The September expiry is coming up soon, and the premium has nearly evaporated. Longer term futures are still trading with a slight premium between 1% and 1.5%.

    Altcoin term futures moved in a similar fashion, and gave up a rich premium; some of them are clearly trading in backwardation.

    The market correction that began in September has changed the picture quickly, and the overstretched situation has been eased for the moment. As the market showed strong support and resilience over the last couple of days, there is a very good chance that the premiums will build easily again.

    Figure 2: Altcoin Futures Basis Overview

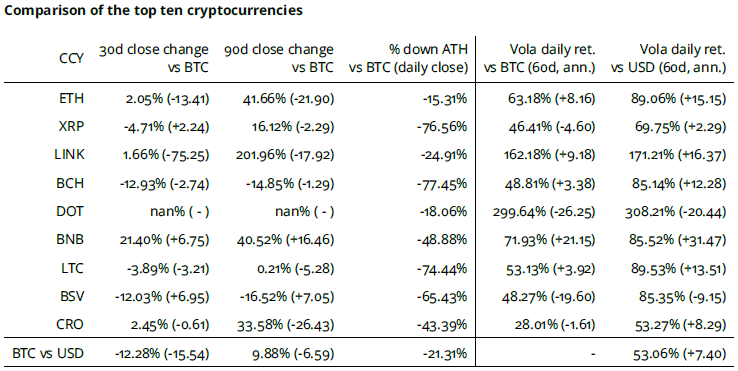
    3. Top Ten Comparison

    Table 1: Datasource: Coinmarketcap; change to last week in parentheses
    Table 2: Datasource: Coinmarketcap; change to last week in parentheses

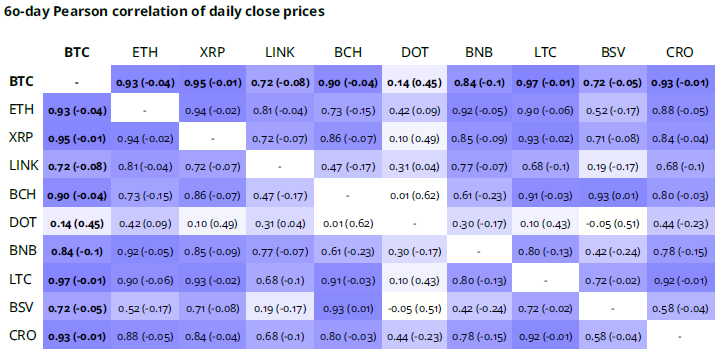
    4. Volatility and Correlation Comparison

    Figure 3: Volatility Comparison; Datasource: Coinmarketcap
    Figure 4: Correlation Comparison; Datasource: Coinmarketcap

    5.  ETHBTC 4h Technical Chart Analysis

    Figure 5: Datasource: Bitfinex; Chartsystem: Tradingview

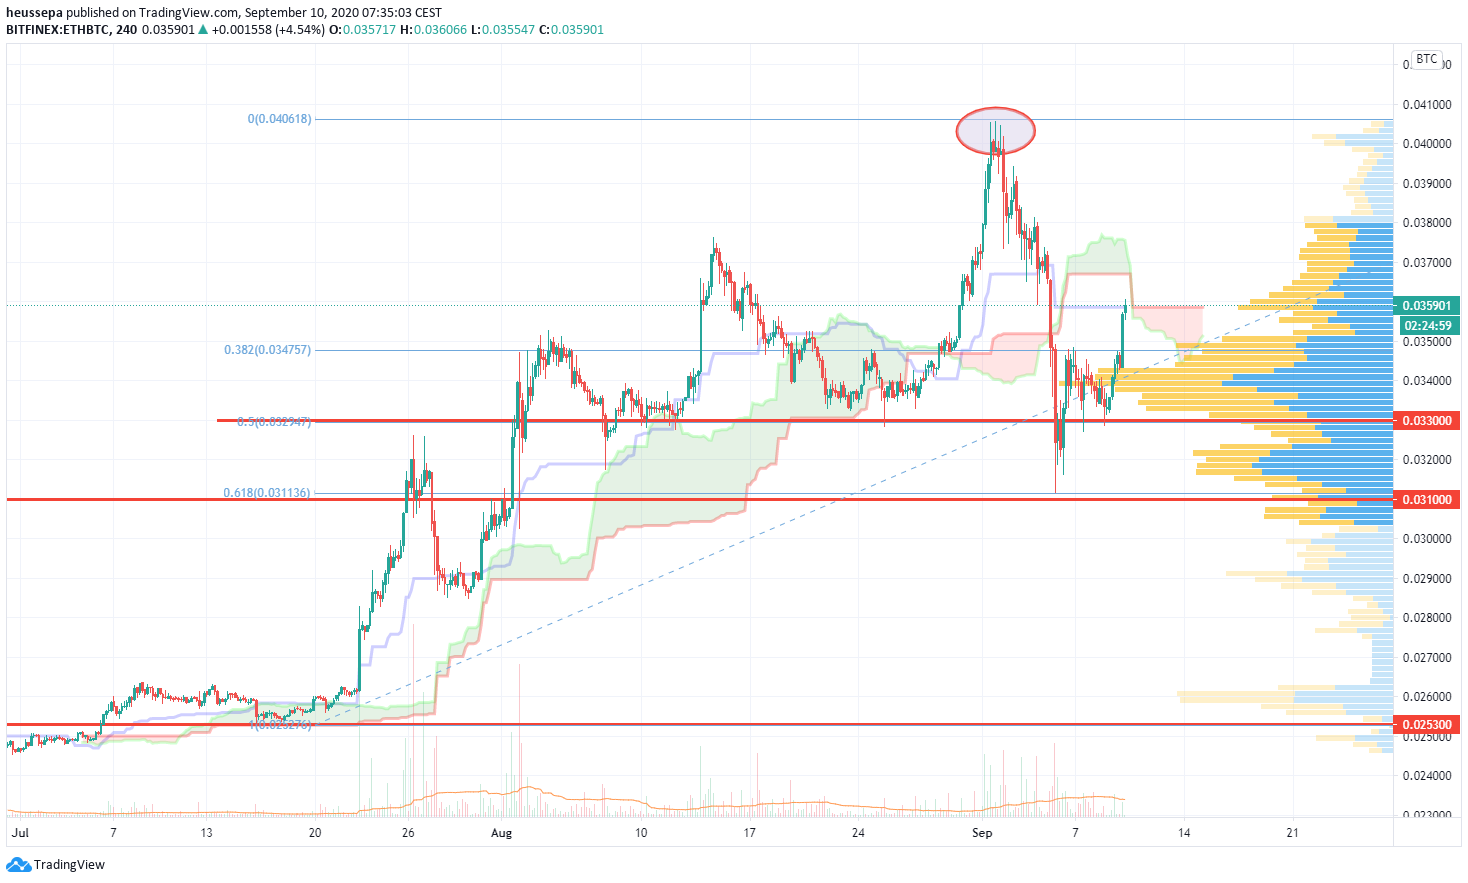
    ETHBTC is a good DeFi health barometer

    So, we had our first parabola break in the DeFi sector. The ETHBTC chart shows this very nicely (red circle). The market tanked as quickly as it had gone up just days before. The 0.031 and 0.033 levels worked well as support during the fire sale.

    In my view, the 0.033 level needs to hold on a daily closing, otherwise we will be due for a bigger correction to the downside. To get a better view of the upside target, we need to zoom out and look at the daily chart. Currently, we are sitting on top of a very large liquidity pool. The topside resistance looks to be between 0.040-0.042. If we can push through this level, there is a liquidity vacuum up until 0.055, which would be my most likely target.

    It looks like it is a long way up, but during the beginning of the DeFi hype, we saw the brutal force that DeFi has exerted on ETH. I recommend you keep an eye on the ETHBTC levels and regularly check your Twitter feed. If you see the combo of breaking through the resistance and a lot of chatter about DeFi, then fasten your seatbelts!

    View the charts: ETHBTC 4h | ETHBTC daily

    6. Market Cap Overview

    Figure 6: Market Cap Overview; Datasource: Coinmarketcap

    Glossary

    Advance Decline Line - the Advance Decline Line shows the ratio of coins for which the market cap increased relative to the market cap of BTC for each day.
    ATH - all time high (maximum lookback period of 730€ days).
    Data Source - tables and charts are based on daily close prices provided by Coinmarketcap.
    EWMA - exponentially weighted moving average.
    MACD - moving average convergence/divergence is a popular technical indicator to identify trends in the underlying instrument. It consists of the MACD and signal line, and the area shown in the background. The MACD line (strong) is the difference of two exponential moving averages, which are defined by the first and second parameter of the indicator. The signal line (weak) is the exponential moving average of the MACD line defined by the third parameter. The area in the background illustrates the difference between the MACD line and the signal line.
    Pearson Correlation - quantifies the linear relationship between two variables.
    Spearman Correlation - quantifies the monotonic relationship between two variables. As such, the Spearman Correlation is based on the ranked values of each variable and is used to detect non-linear relationships between the two.


    Copyright © 2021 | Crypto Broker AG | Alle Rechte vorbehalten.
    Diese Publikation und ihr Inhalt, einschliesslich aller Namen, Logos, Designs und Marken sowie aller damit verbundenen Immaterialgüter- und sonstigen Rechte sind Eigentum der Crypto Broker AG oder Dritter. Sie dürfen ohne deren vorherige Zustimmung nicht vervielfältig oder weiterverwendet werden.

    Haftungsausschluss
    Alle Angaben in dieser Publikation erfolgen ausschliesslich zu allgemeinen Informationszwecken. Die in dieser Publikation zur Verfügung gestellten Informationen stellen keine Anlageberatung dar und sind auch nicht als solche beabsichtigt. Diese Publikation stellt kein Angebot und keine Empfehlung oder Aufforderung für eine Anlage in ein Finanzinstrument einschliesslich Kryptowährungen und dergleichen dar und ist auch nicht als solches Angebot, Empfehlung oder Aufforderung beabsichtigt. Diese Publikation ist nicht für Werbezwecke bestimmt, sondern dient nur der allgemeinen Information. Die in der Publikation enthaltenen Inhalte stellen die persönliche Meinung der jeweiligen Autoren dar und sind nicht als Entscheidungsgrundlage geeignet oder beabsichtigt. Alle Beschreibungen, Beispiele und Berechnungen in dieser Publikation dienen nur der Veranschaulichung. Obwohl bei der Erstellung dieser Publikation mit üblicher Sorgfalt darauf geachtet wurde, dass die Angaben zum Zeitpunkt der Veröffentlichung zutreffend und nicht irreführend sind, übernimmt die Crypto Broker AG keinerlei Gewähr oder Garantie, weder ausdrücklich noch stillschweigend, in Bezug auf die darin enthaltenen Informationen, deren Marktfähigkeit oder Eignung für einen bestimmten Verwendungsweck oder hinsichtlich ihrer Genauigkeit, Richtigkeit, Qualität, Vollständigkeit oder Aktualität. Die Crypto Broker AG schliesst jede Haftung und Verantwortlichkeit für die Verwendung der in der Publikation enthaltenen Informationen, auch durch Dritte, im Zusammenhang mit Handels- oder anderweitigen Aktivitäten aus und ebenso für allfällige Fehler oder Unvollständigkeiten, welche in dieser Publikation enthalten sind.

    Risikohinweis
    Anlagen und Investitionen, insbesondere in Kryptowährungen, sind grundsätzlich mit Risiko verbunden. Der Totalverlust des eingesetzten Kapitals kann nicht ausgeschlossen werden. Kryptowährungen sind sehr volatil und können daher in kurzer Zeit extremen Kursschwanken ausgesetzt sein. Eine Nutzung der Informationen aus dieser Publikation erfolgt ausschliesslich und einzig auf eigenes Risiko des Nutzers. Ein Nutzer sollte sich in jedem Fall vor einer Anlage- und Investitionsentscheidung über die damit verbundenen Risiken im Klaren sein und sich bei Bedarf geeignet beraten lassen.

    Share. Facebook Twitter LinkedIn Email Telegram WhatsApp

    About the author

    Patrick Heusser
    • Website

    Wenn er nicht an den Crypto Broker Trading Desk gefesselt ist - mit 24/7 Trading verfügbar für unsere Kunden - liefert Patrick Heusser aktuelle Kommentare zu den aufstrebenden Crypto Märkten, sowohl für unsere Kunden als auch für die Finanzpresse. Bevor er zu Crypto Broker stiess war Patrick als Zinshändler bei der UBS tätig und hatte verschiedene Positionen in der IRCC (Interest Rate, Commodity, and Currency) Trading Division in London, New York, Singapur und Zürich inne. Patrick ist Experte für Trading und Risikomanagement und verfügt über Erfahrung in der Führung von Startup Projekten.

    Related Articles

    Bitcoin fails again at the 80'000 USD mark, profit-taking weighs on ETH, SOL and XRP despite Strategy purchase and ceasefire.

    Bitcoin price climbs to 80’000 USD – profit-taking hits ETH, SOL and XRP

    Bitcoin slips below $88,000: government shutdown and Fed meeting weigh on crypto market

    Bitcoin slips below $88,000: government shutdown and Fed meeting weigh on crypto market

    Bitcoin-Preis stürzt unter 90'000 USD und Altcoins auf Mehrjahrestiefs

    Bitcoin price plunges below 90’000 USD and altcoins hit multi-year lows

    Canada announces national crypto ATM ban. Roughly 4,000 machines are affected as Ottawa targets fraud and money laundering.
    29. April 2026

    Canada bans crypto ATMs

    OKX, BlackRock and Standard Chartered launch a joint framework that makes tokenized RWAs usable as margin collateral under G-SIB custody.
    29. April 2026

    OKX, BlackRock and Standard Chartered use tokenized treasuries as collateral

    Hoskinson calls support of the CLARITY Act by Garlinghouse and the XRP community insanity and accuses Ripple of harming the industry.
    28. April 2026

    XRP vs. Cardano: Hoskinson calls CLARITY Act support “insanity”

    twitter image button instagram image button linkedin image button youtube image button

    About Crypto Valley Journal
    About Crypto Valley Journal

    On the pulse of the movement

    • Academy
    • Contact
    • Advertising
    • About us
    • Partner
    • Imprint
    • Privacy
    • Disclaimer
    Search

    Type above and press Enter to search. Press Esc to cancel.