
A summarizing review of what has been happening at the crypto markets. A look at trending sectors, liquidity, volatility, spreads and more. The weekly report in cooperation with market data provider Kaiko.
Markets shrugged off a hotter-than-expected U.S. CPI last week. Meanwhile, Abu Dhabi’s sovereign wealth fund revealed it had invested in Bitcoin, the SEC and Binance sought a 60-day pause in their lawsuit, and Argentine President Javier Milei’s brief support for the LIBRA token sparked controversy. This week we explore:
- Kaiko's asset liquidity ranking.
- Korea prepares for institutional traders.
- Capturing U.S. momentum with the EAGLE Index.
Liquidity Lowdown: Crypto Assets Ranking
With market depth returning to pre-FTX levels and increasing odds of altcoin spot ETFs, we’re revisiting our Asset Liquidity Ranking this week.
Regular readers might recall that we introduced this ranking after FTX's collapse to address the limitations of using market cap alone to measure a token's true value. A notable example was FTX's native token, FTT, which peaked at a market cap of nearly $10 billion yet never had the liquidity to support that valuation.
The chart below provides a high-level comparison of liquidity rank (orange) and market cap rank (blue) for each asset. Tokens positioned to the right of center have stronger liquidity relative to their market cap, while those to the left are less liquid than their valuation suggests. Notably, only a few large-cap tokens—BTC, ETH, SOL, and XRP—have liquidity rankings that closely match their market cap.
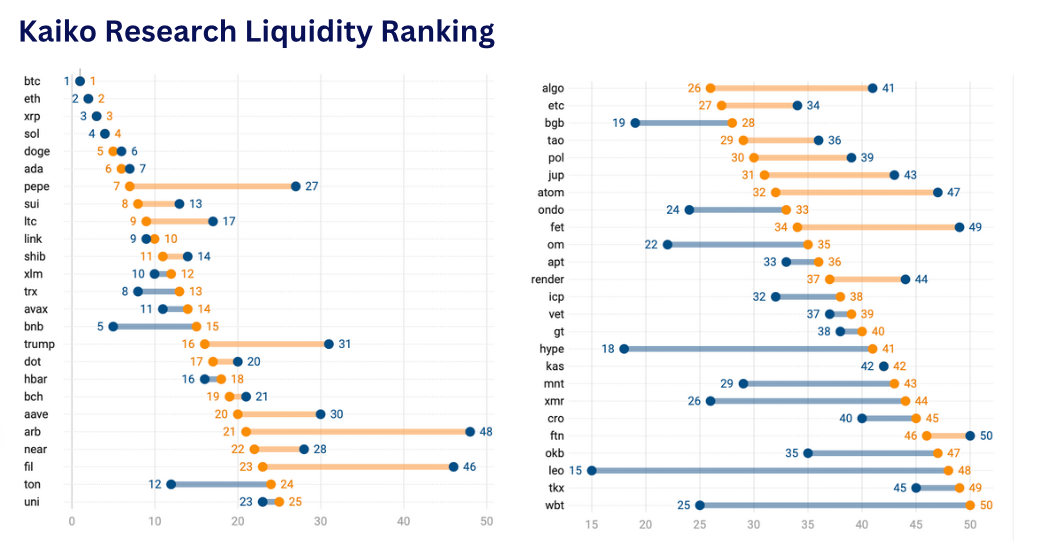
Another way to visualize this is by looking at the difference between market cap rank and liquidity rank. Outliers include Bitfinex’s token LEO, WBTC, and HYPE, which stand out as some of the most misleading assets for investors who use market cap as a proxy for liquidity. This is mainly due to the limited number of actively traded pairs, with only seven markets offering liquidity for LEO. HYPE has a significant portion of its supply locked, particularly allocations for core contributors, which reduces its available liquidity.
![]()
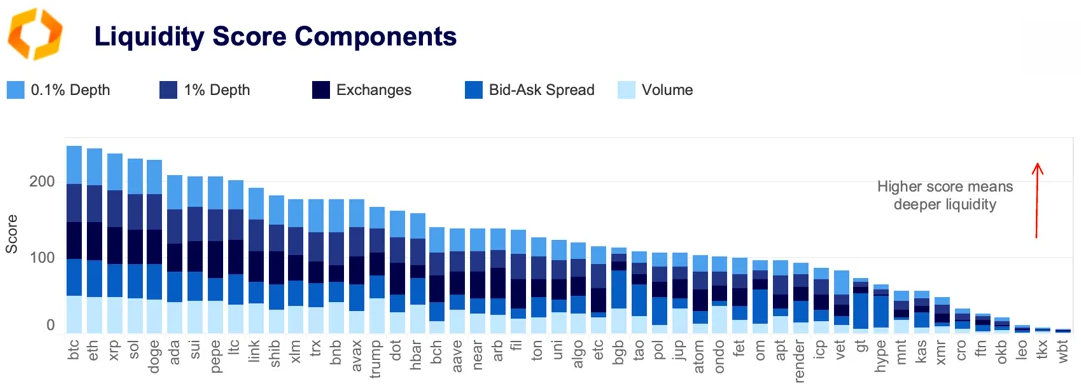
Our ranking considers five key factors: 1% and 0.1% market depth, the number of liquid exchanges, bid-ask spread, and trade volume. The chart below shows the contribution of each component to the overall score.
While these factors are generally correlated, bid-ask spreads show notable divergences. Over the past quarter, XRP, PEPE, and LINK exhibited wider spreads than their liquidity rankings suggest, while DOGE, RNDR, and exchange tokens like BGB (Bitget) and GT (Gate.io) performed better.
These discrepancies in the level of spreads are likely driven by exchange fee structures and competition among liquidity providers on each platform, particularly the presence of designated market makers.
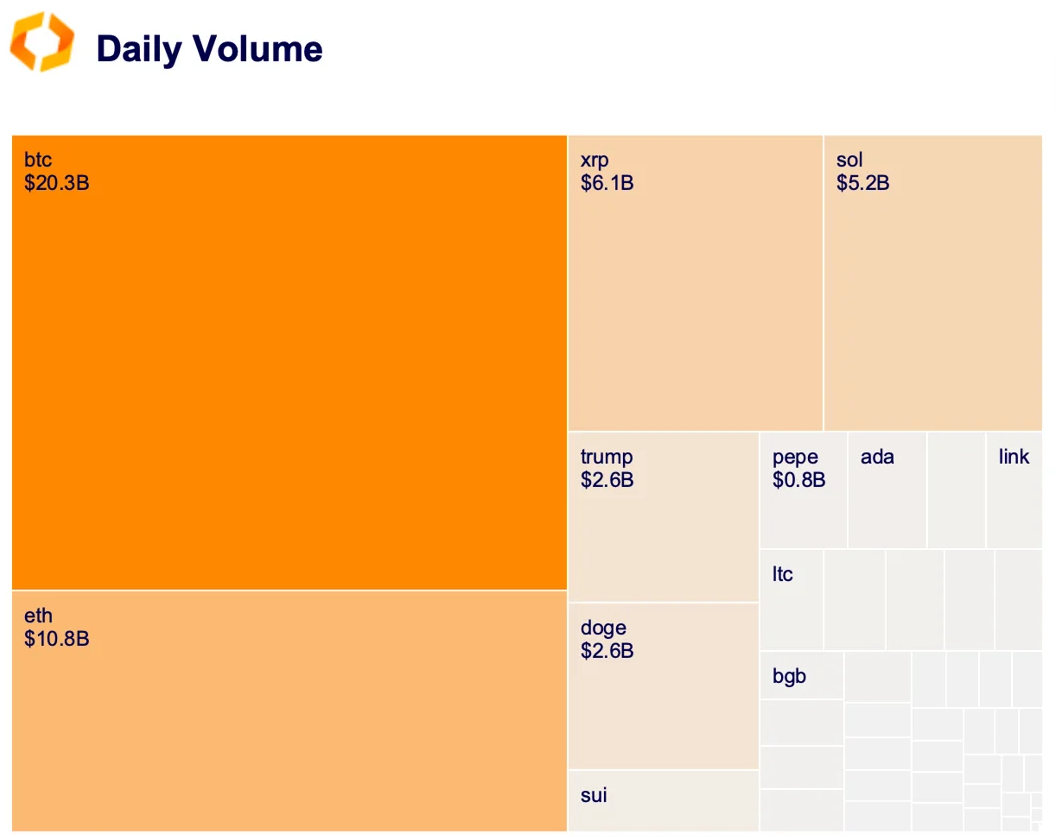
Overall, increased trading activity attracts more market makers, creating a self-reinforcing cycle. While BTC remains dominant in trade volume, SOL and XRP are gaining ground.
This trend suggests that the crypto market is becoming less concentrated, with potentially more liquidity flowing into altcoins. However, the trend is still nascent, as more than half of the top 50 tokens struggle to attract more than $200 million in average daily volume.
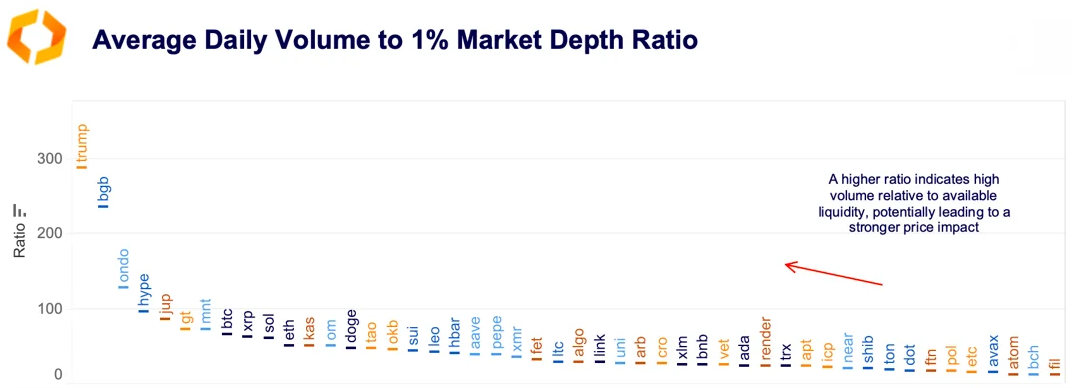
In the short term, if trading activity is too high relative to available liquidity, this could lead to price instability. The volume-to-liquidity ratio measures trading activity relative to available market depth at the 1% price level. A higher ratio suggests a greater price impact from large trades.
TRUMP’s ratio (290) for example, was exceptionally high due to market excitement after its late January launch, driving $17 billion in volume on January 20—over 30% of Bitcoin’s trade volume.
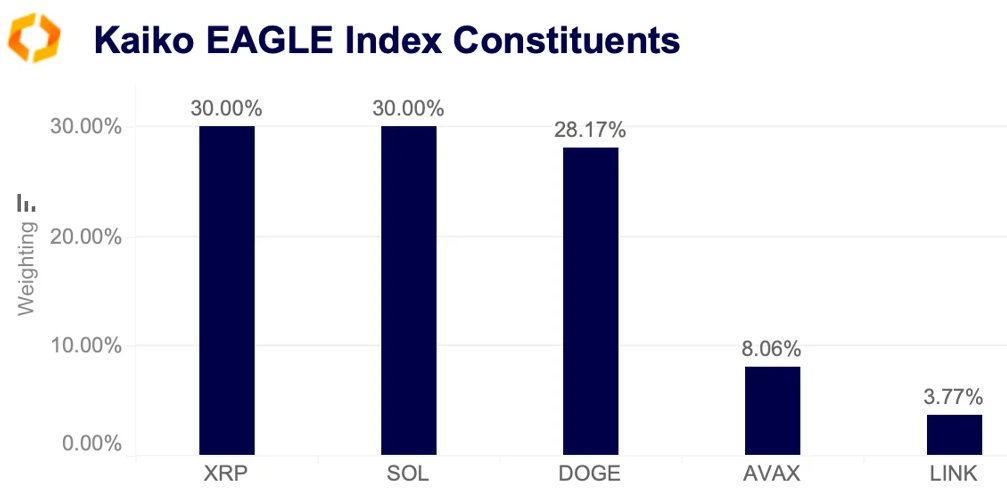
Capturing U.S.-led growth
Financial markets were buoyant in the aftermath of the U.S. election in November, particularly in crypto. BTC led the rally as it surged above $105k before Christmas. The rally extended to other assets such as XRP and SOL, with the latter reaching all-time highs while XRP dominated volumes.
With this in mind, Kaiko Indices launched the Kaiko EAGLE Index to build on U.S. momentum. The index selection was driven by an in-house regional classification and was sector-agnostic. An improved regulatory environment in the U.S. and the growing demand for crypto-related structured products are two tailwinds for the EAGLE index.
XRP eclipses rivals as demand soars
Last week, Coinbase surprised equity analysts with its fourth-quarter earnings. The post-election rally contributed to its improved revenue, which we noted ahead of time, as retail traders, in particular, returned in large numbers.
One of the more interesting data points revealed in the exchange's shareholder letter was the split of trading revenue. For the first time in recent history, XRP contributed more to Coinbase's trading-based revenue than ETH. XRP's 14% contribution during the quarter came amid a surge in trading volumes since the election, as some asset managers lined up to offer spot XRP exchange-traded funds.
The surge in XRP volume has been present across all U.S.-based exchanges since November and came just over a year after it was re-listed on most of these venues—following a partial court victory in Ripple Labs' case against the SEC.
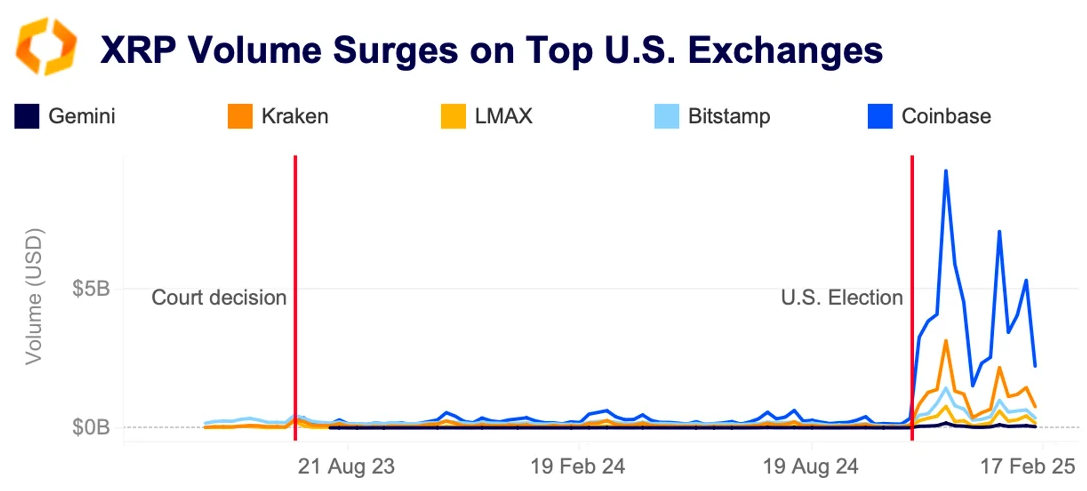
The U.S. Securities and Exchange Commission acknowledged XRP ETF filings last week. This means the clock is ticking, and the regulator has to give a final response within 240 days of acknowledgment. This provides a potential volatility trigger in the future, as approval or denial will lead to a spike in trading. For instance, in May 2024, ETH volumes surged, alongside prices, as the SEC made a U-turn in approving spot ETH ETFs.
If the anticipation of approval here plays out in a similar way, then XRP could continue to drive trading-related revenues in the near term.
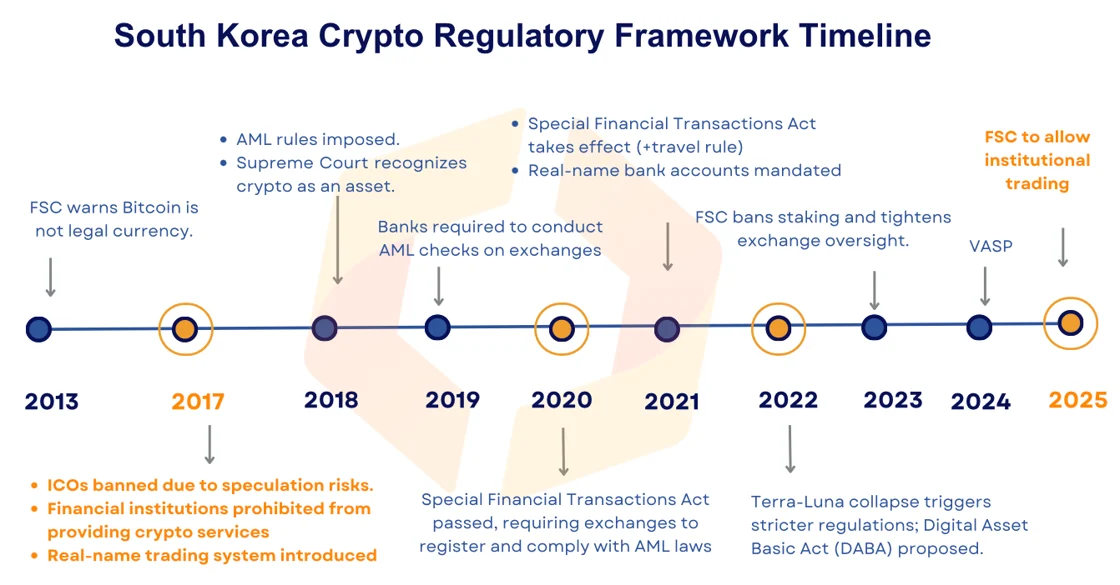
South Korea plans to lift the ban on institutional trading
South Korea is preparing to allow institutional investors—including non-profits, universities, law enforcement agencies, listed companies, and professional investors—to trade crypto in 2025.
Currently, only retail traders with verified identities can access digital assets under Korean law. The country’s strict capital controls have long shaped its crypto landscape, leading to market phenomena such as the Kimchi Premium and Gaduri Pumping Premium, which were previously analyzed by Tiger Research and Kaiko.
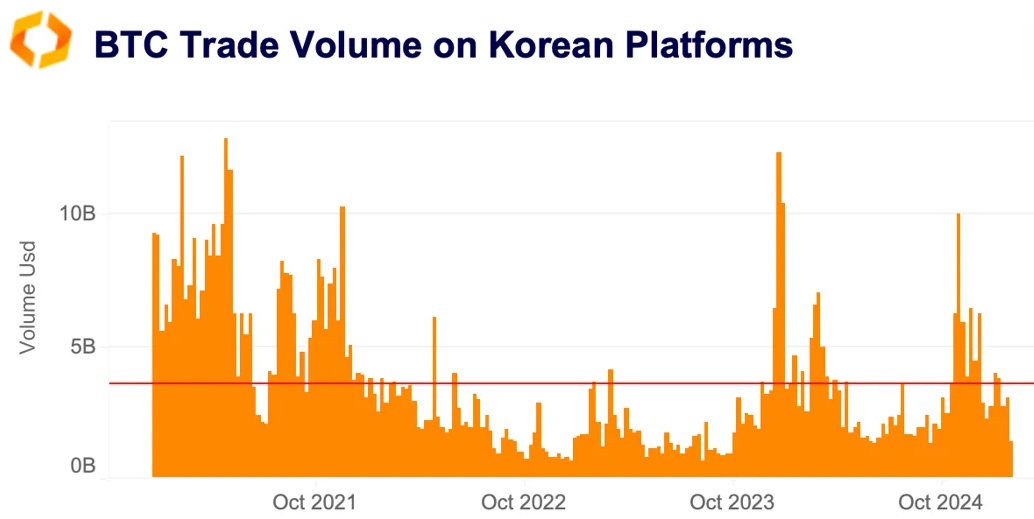
As a result, altcoins dominate trading activity, consistently accounting for over 80% of the volume. While BTC volumes in Korea have grown alongside global markets, their relative share remains low. In February, Korea’s share of global BTC trading fell to 1.6%, its lowest level since mid-2023.


Libra token collapse trigers controversy
On February 14, Argentina's President, Javier Milei, briefly promoted the Libra crypto token, which experienced a price surge before collapsing by more than 80% after launching on centralized exchanges. Approximately 82% of Libra's supply was controlled by a few wallets, fueling concerns over price manipulation. According to reports, insiders withdrew $107 million in USDC and SOL from the project, causing the token's price to drop sharply.
Milei initially described Libra as a “private project” intended to support small businesses but later deleted the post amid growing public backlash and accusations of a “rug pull.” Lawyers in Argentina have charged Milei with fraud, alleging that his actions played a central role in the token’s collapse.
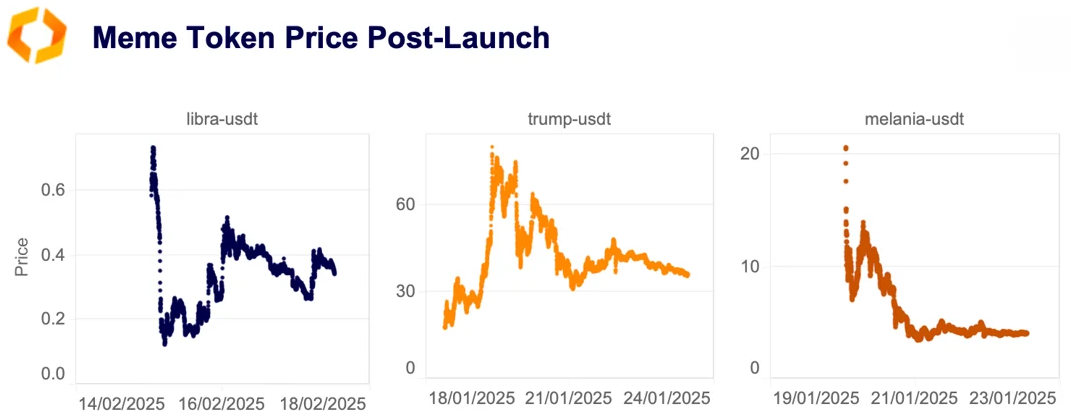
Libra’s price followed a similar pattern to that of the TRUMP and MELANIA tokens at launch, all of which failed to recover their peak prices. Interestingly, while both Libra and MELANIA peaked within hours of launching, the TRUMP token reached its all-time high a day after its release and has technically remained up since then.


