
Technical Analysis
Good Morning!
We were on another rollercoaster ride last weekend, which was mainly driven by greed and the insane amount of leverage retail traders can take on various crypto exchanges. Let me elaborate on both points quickly, and hopefully on the back of my examples, some of my previous (and future) technical analyses will make more sense.
Greed
With the $1.9 trillion stimulus package that President Biden signed, crypto traders saw their chance over the weekend to “front run” all of the stimulus check receivers. A good amount of those $1,400 checks were put to work on Coinbase to buy bitcoin (mainly) but also to purchase other available tokens.
Leverage
With the traditional banking system enjoying the weekend, those greedy retail traders were unable to send more capital in fiat to their trading venues. But luckily there is this magic function called leverage, where you can ramp up your risk position without holding much capital.
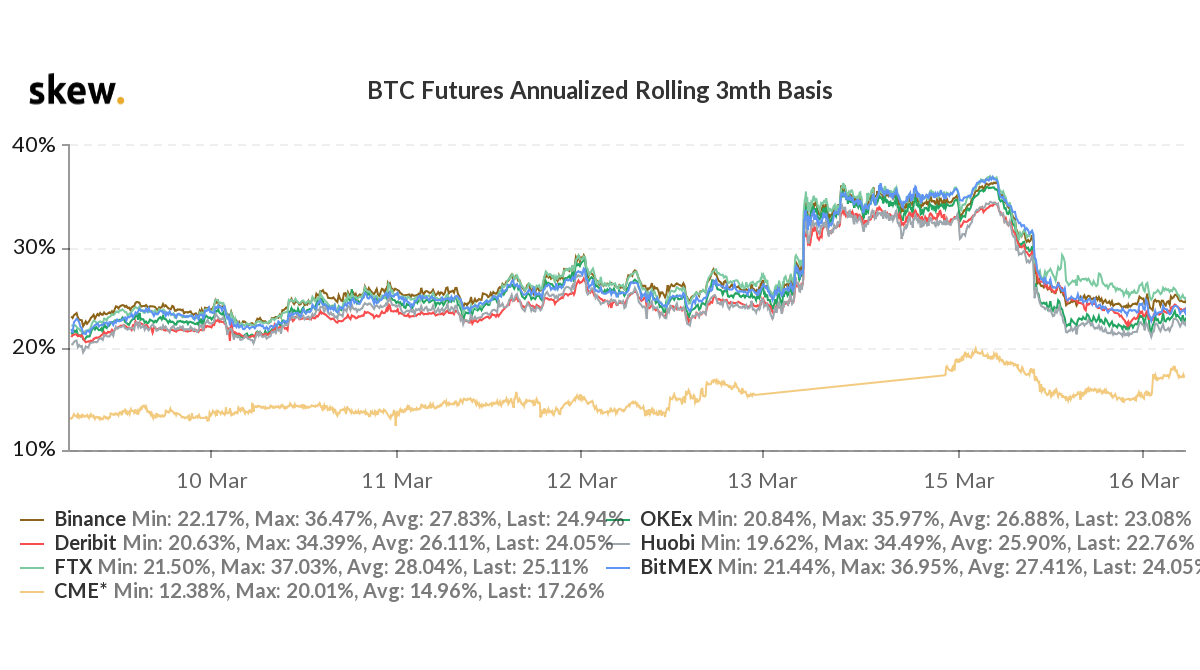
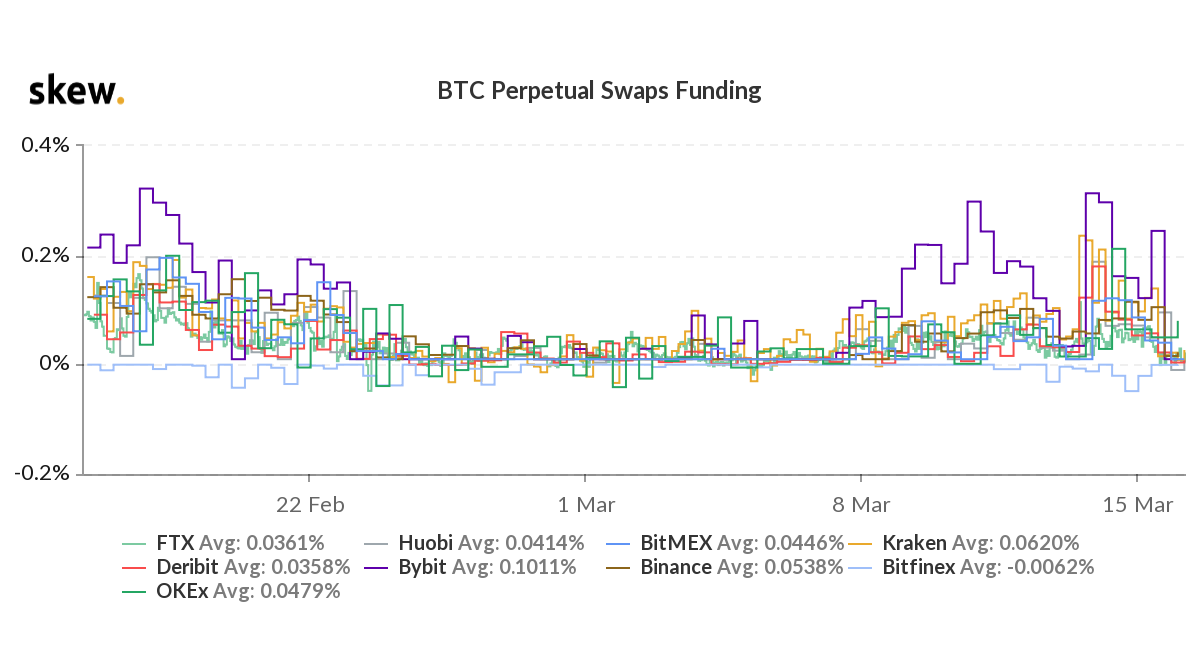
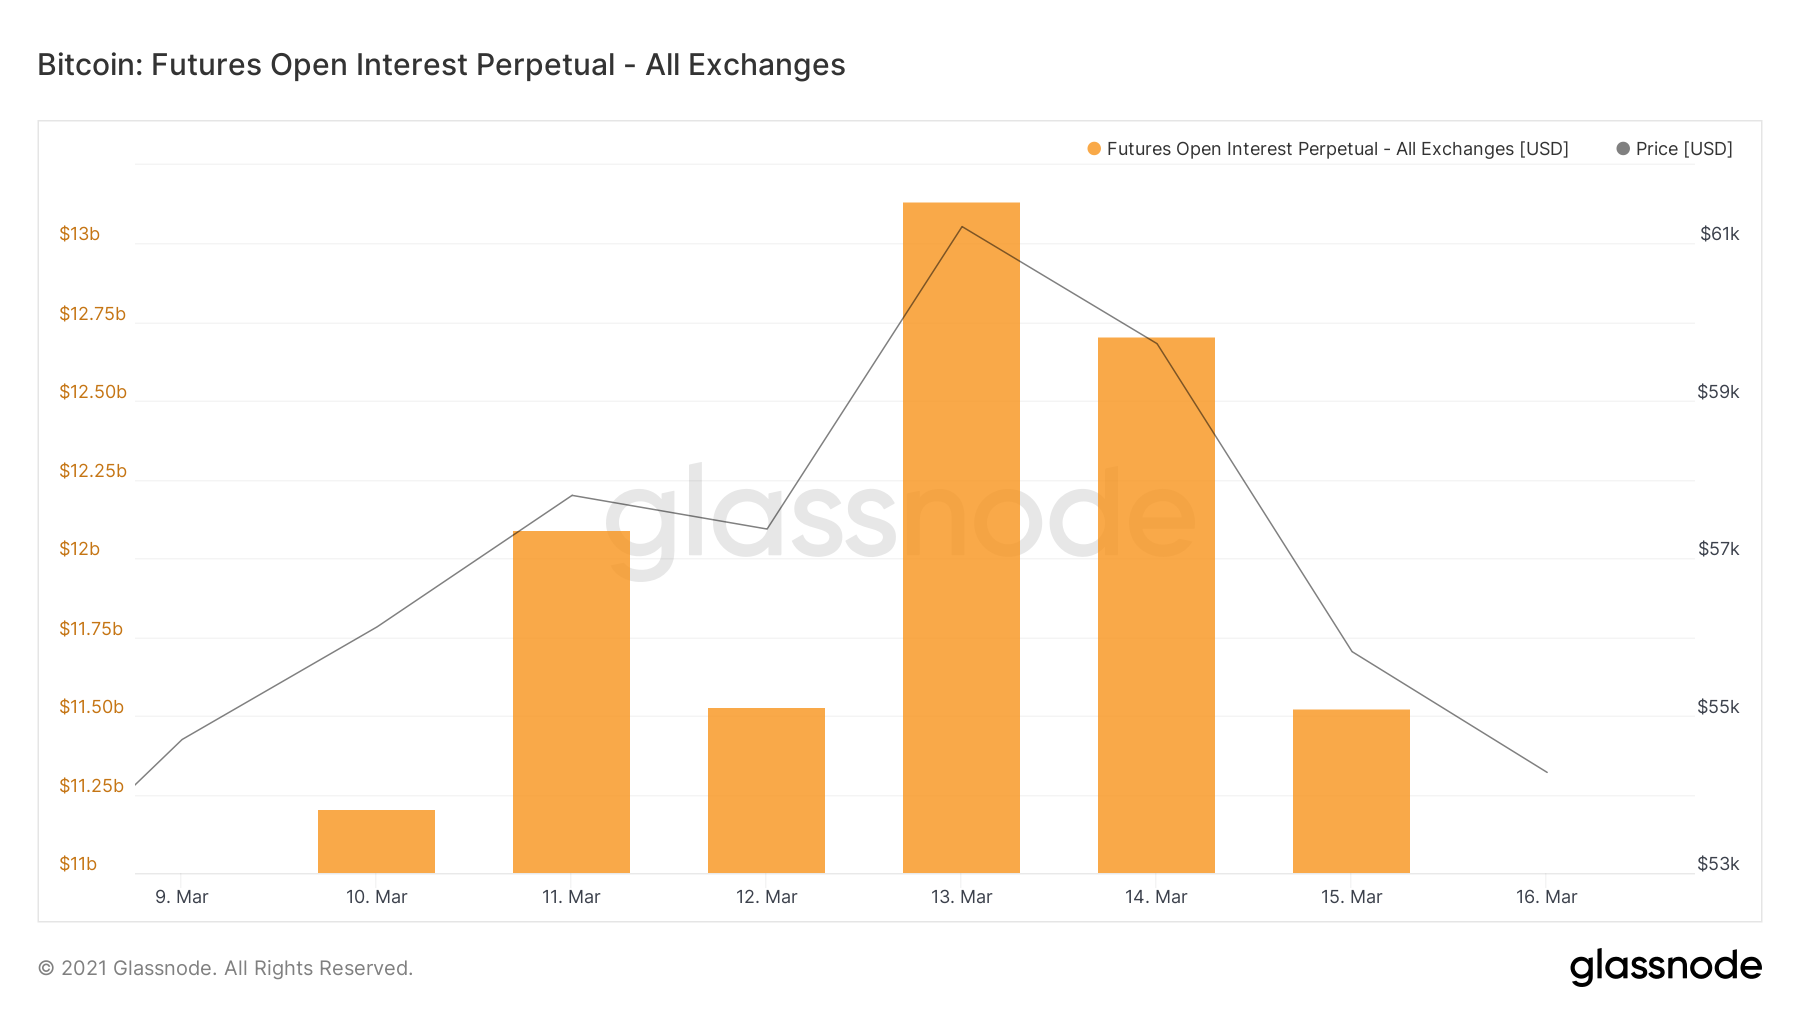
The leverage was easy to spot in the widening of the futures term basis (see "BTC Futures Annualised Rolling 3mth basis" below) and the increased funding rates in the perpetual futures contracts (see "BTC Perpetual Swaps Funding" below): both graphics have been taken from skew.com. Also, futures OI saw a nice bump over the weekend, but came straight back with all the liquidations on Monday (see "Futures Open Interest Perpetual - Exchanges" below).
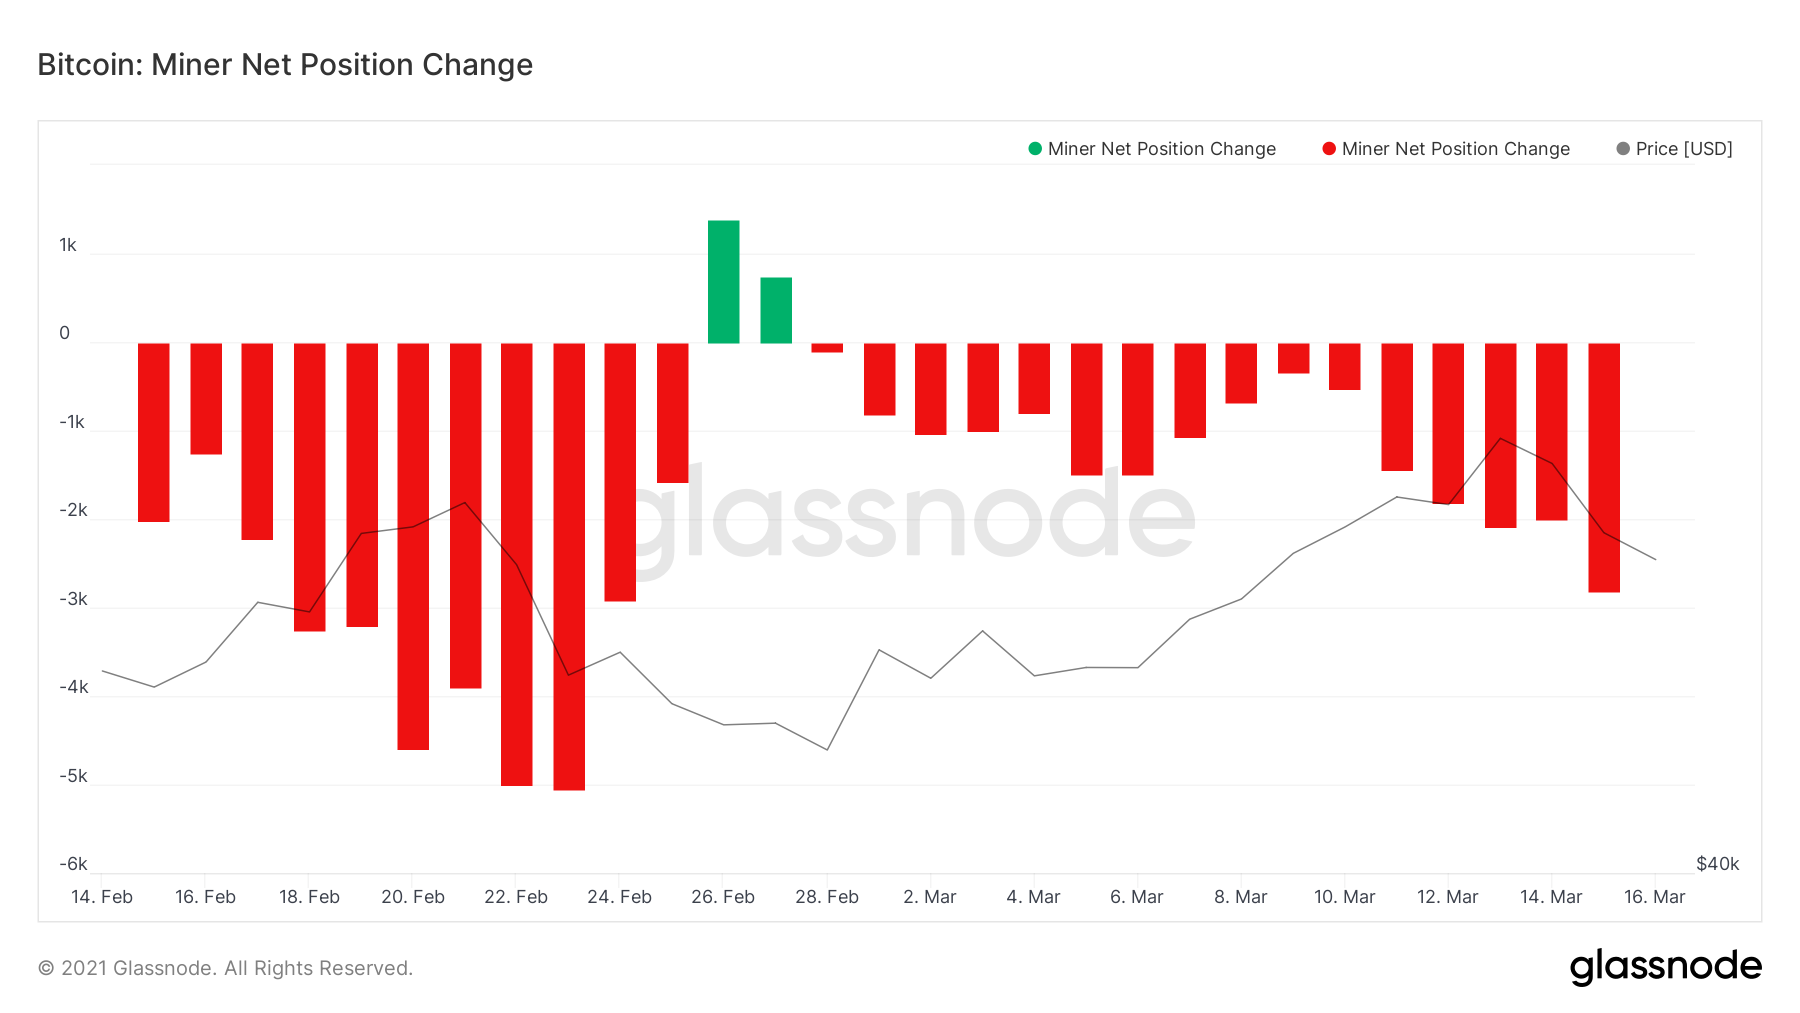
Additionally, I was watching the Bitfinex order book, which usually shows the best liquidity on weekends as well. There was a constant flow of offers coming in: mainly physical spot (which indicates that these were big players: no leverage). My guess is that miners were partially responsible for that constant offer flow (see "Miner Net Position Change" below). There was also a story making the rounds that Gemini had received 19k bitcoins into their hot wallet (but this was never confirmed, and I have not seen large trading volumes coming from that exchange).
When you see this kind of a combination on a weekend, it is only a question of when (not if) the liquidations will start rolling in. Last weekend, they did. The main venues where retail traders got hit hard were Binance and Bybit. Those venues seem to have the most overleveraged retail traders in the crypto space. We saw over $1 billion worth of liquidations within just 8h on Monday.
Now, let’s move on to the charts!
BTC$ (weekly)
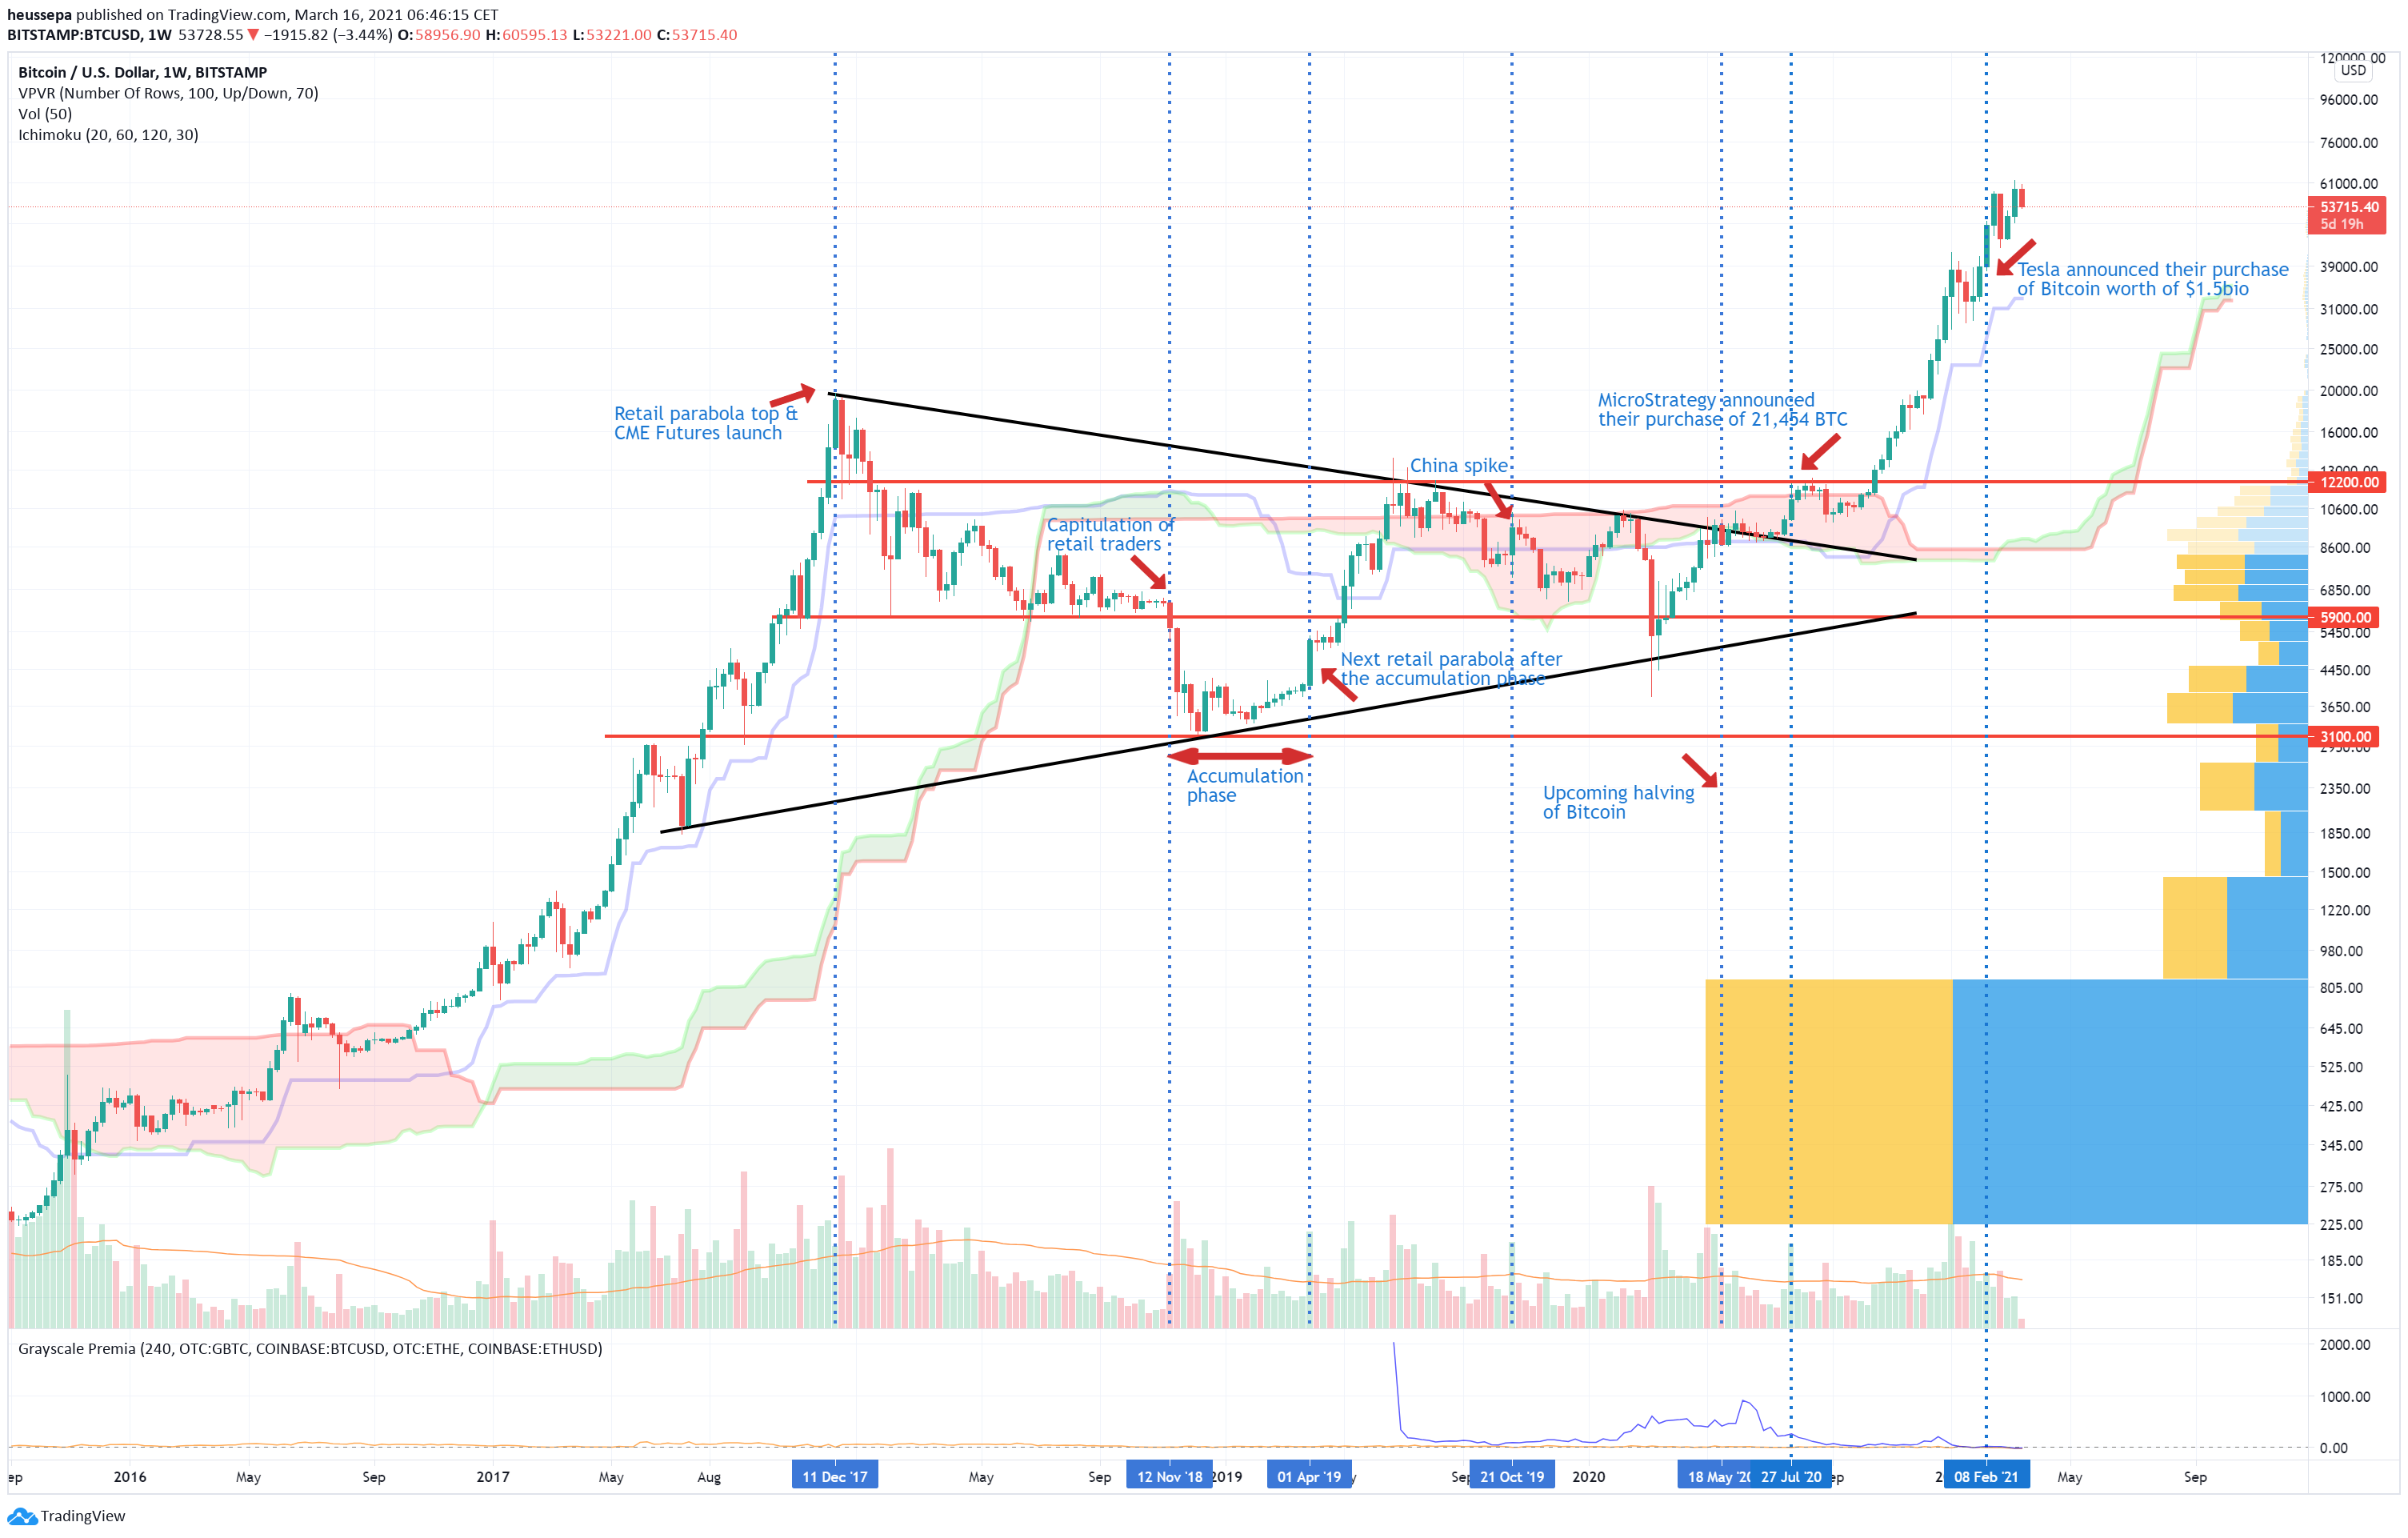
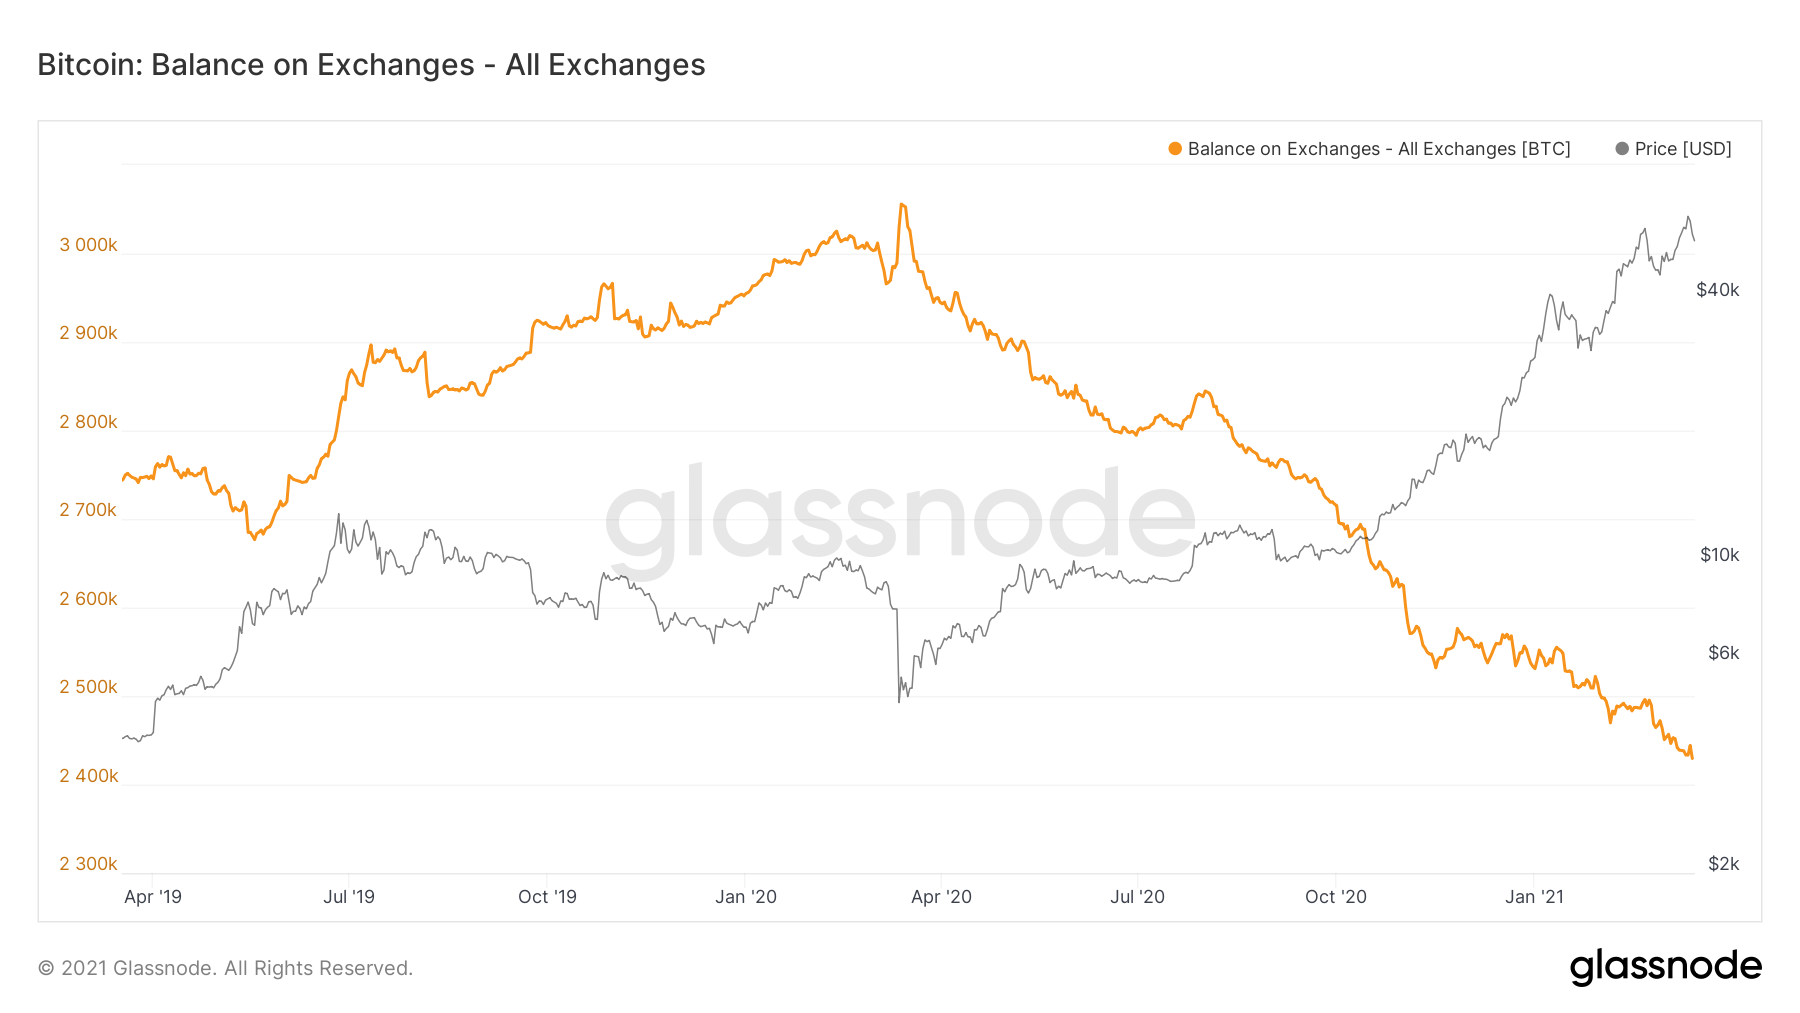
The triangle pattern, which was widely being followed by many traders, is pretty much history. We even overshot the potential target by 300%. The macro events keep coming, which gives the BTC$ price a consistently biddish tone. In addition to that we are still seeing a rather buy and hold flow from an on-chain perspective, which adds to the upward price pressure (see image from GlassnodeStudio of coins on exchange).
BTC$ (daily)
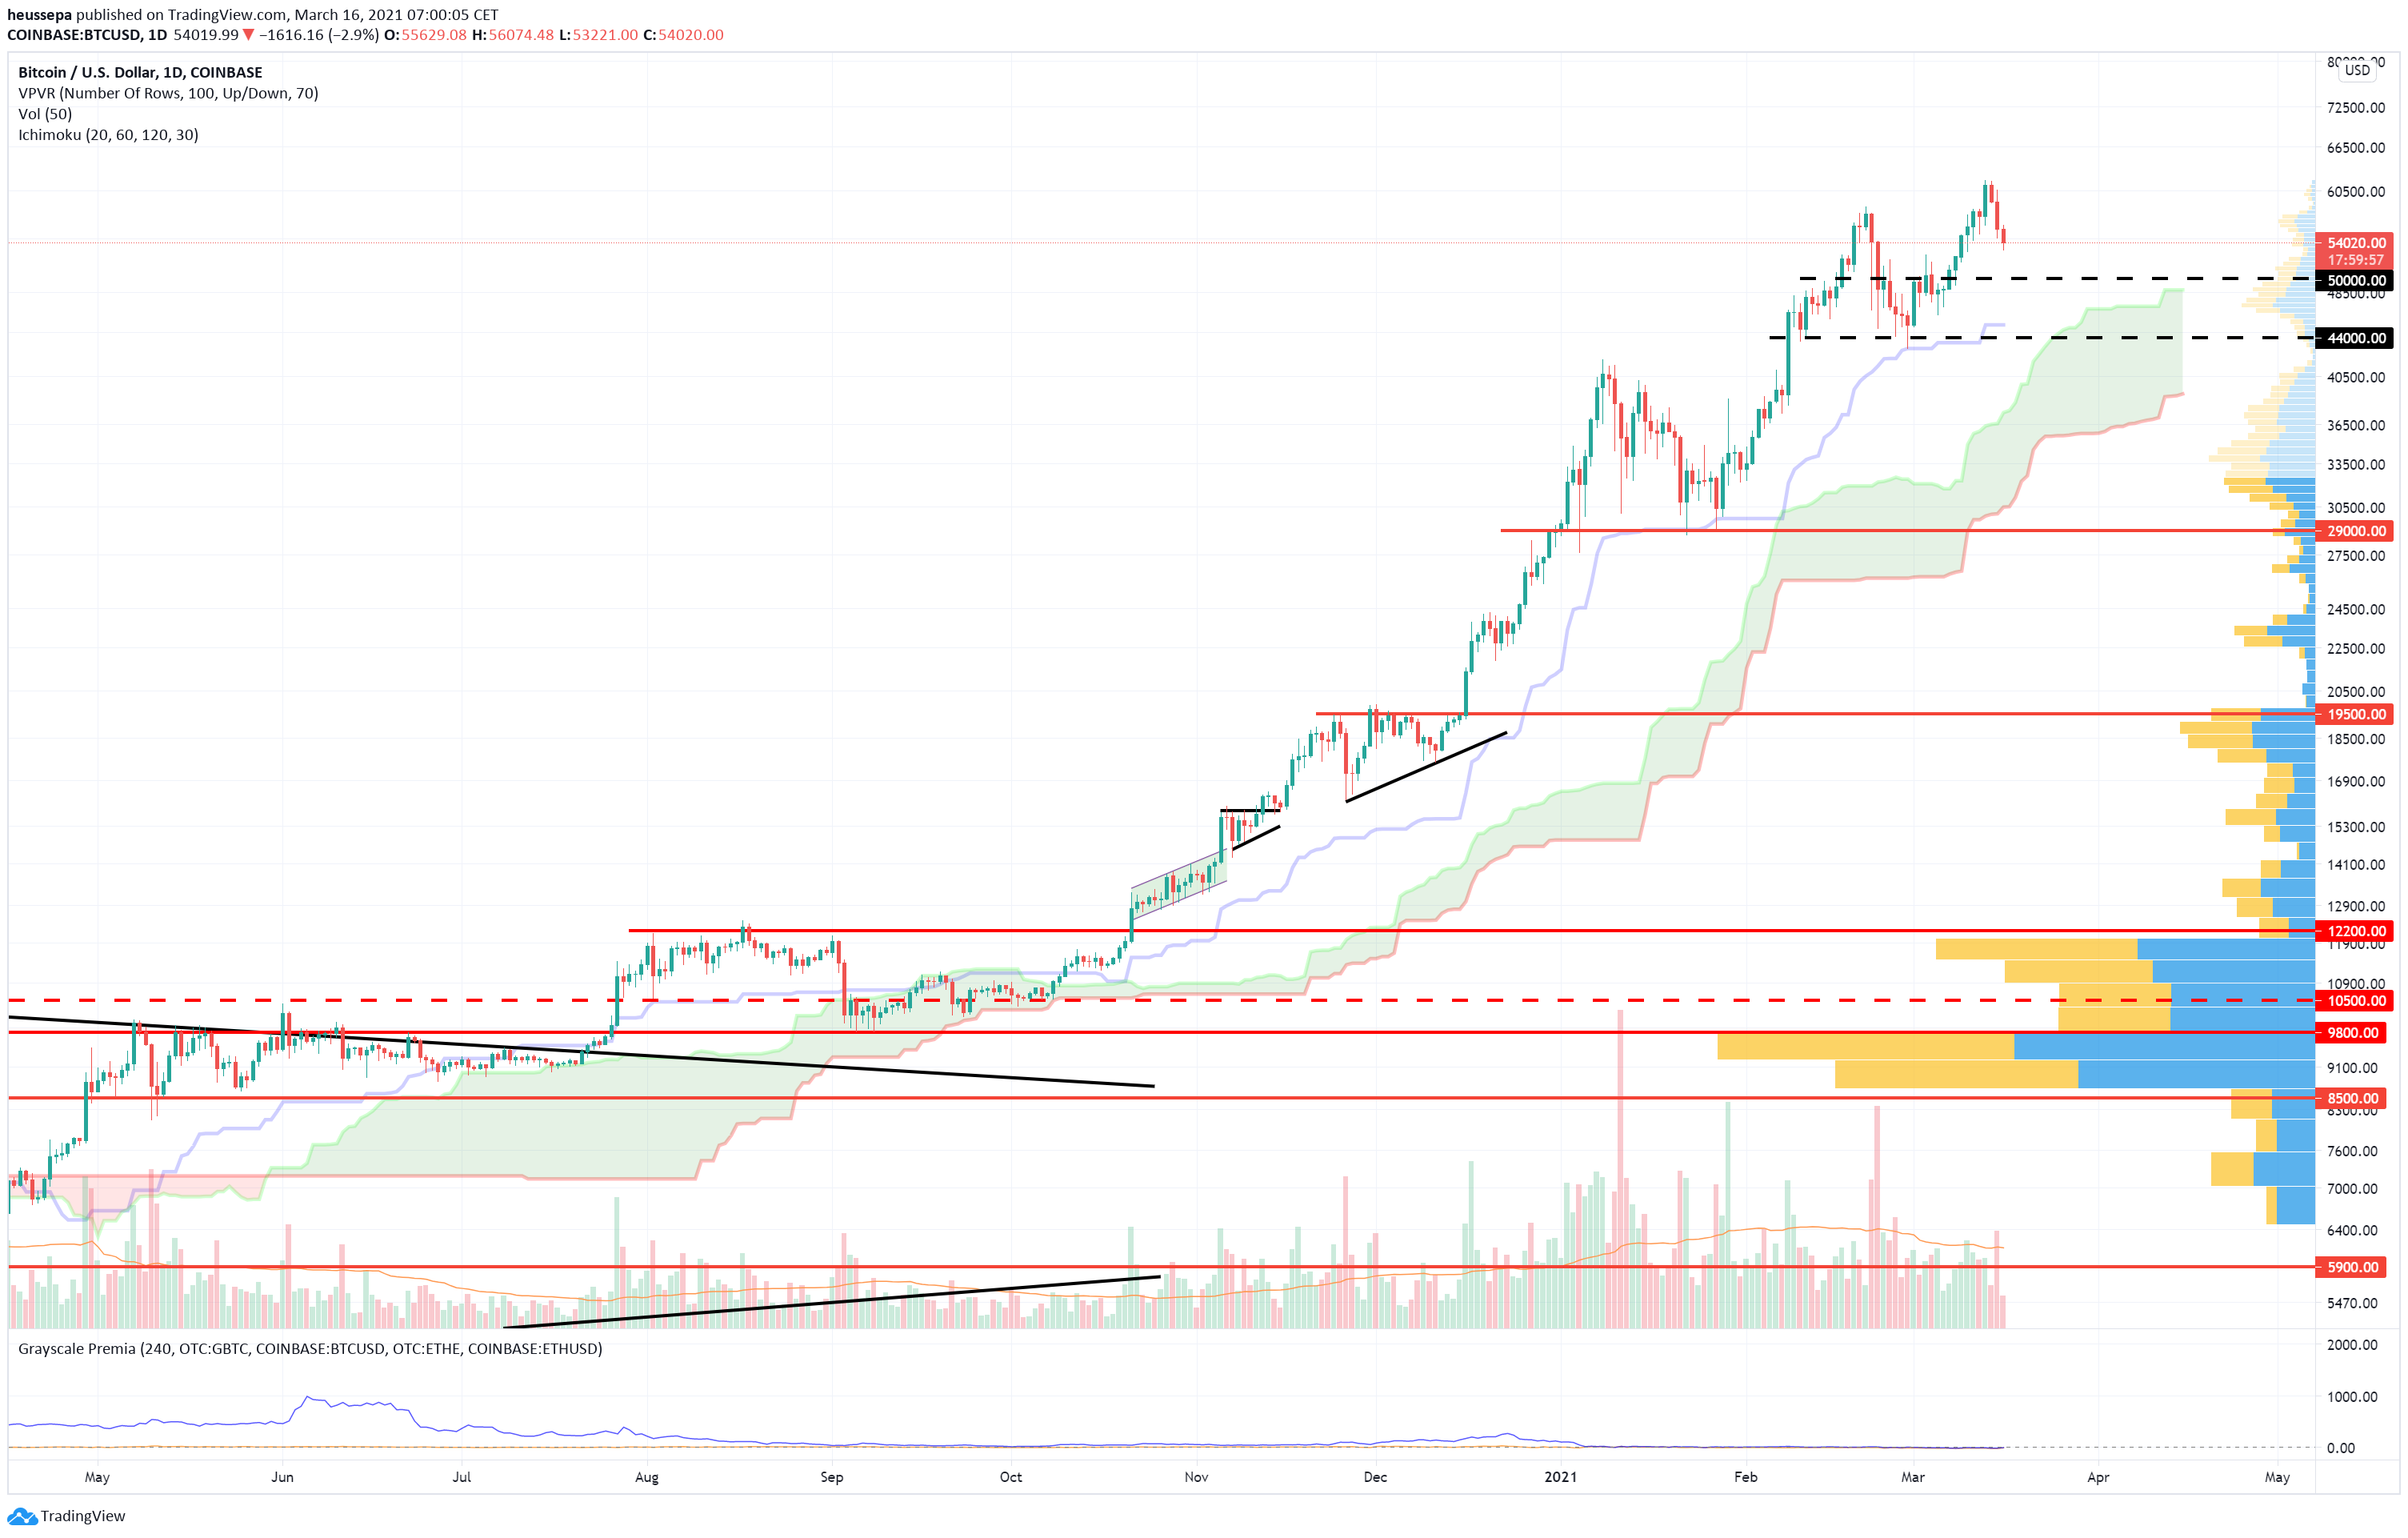
When I look at the daily chart, I begin to see some signs of exhaustion. For example, I follow the simple wave structure of higher highs and higher lows. That bullish structure is still in place, but the impulses (the new higher highs and the new higher lows) are getting shorter.
Additionally, we have seen a change in the steepness of the Ichimoku cloud, with prices edging closer to the cloud. The baseline (blue line) is the first line of defence. We touched it recently when we came off of the local top at around $58k. In combination, I watch that base line if it starts to move into the cloud or prices are pushing through it (the line and into the cloud).
Currently the situation is not alarming, and even a dip down into the old range of $44-$50k would not destroy the bullish setup.
BTC$ (4h)
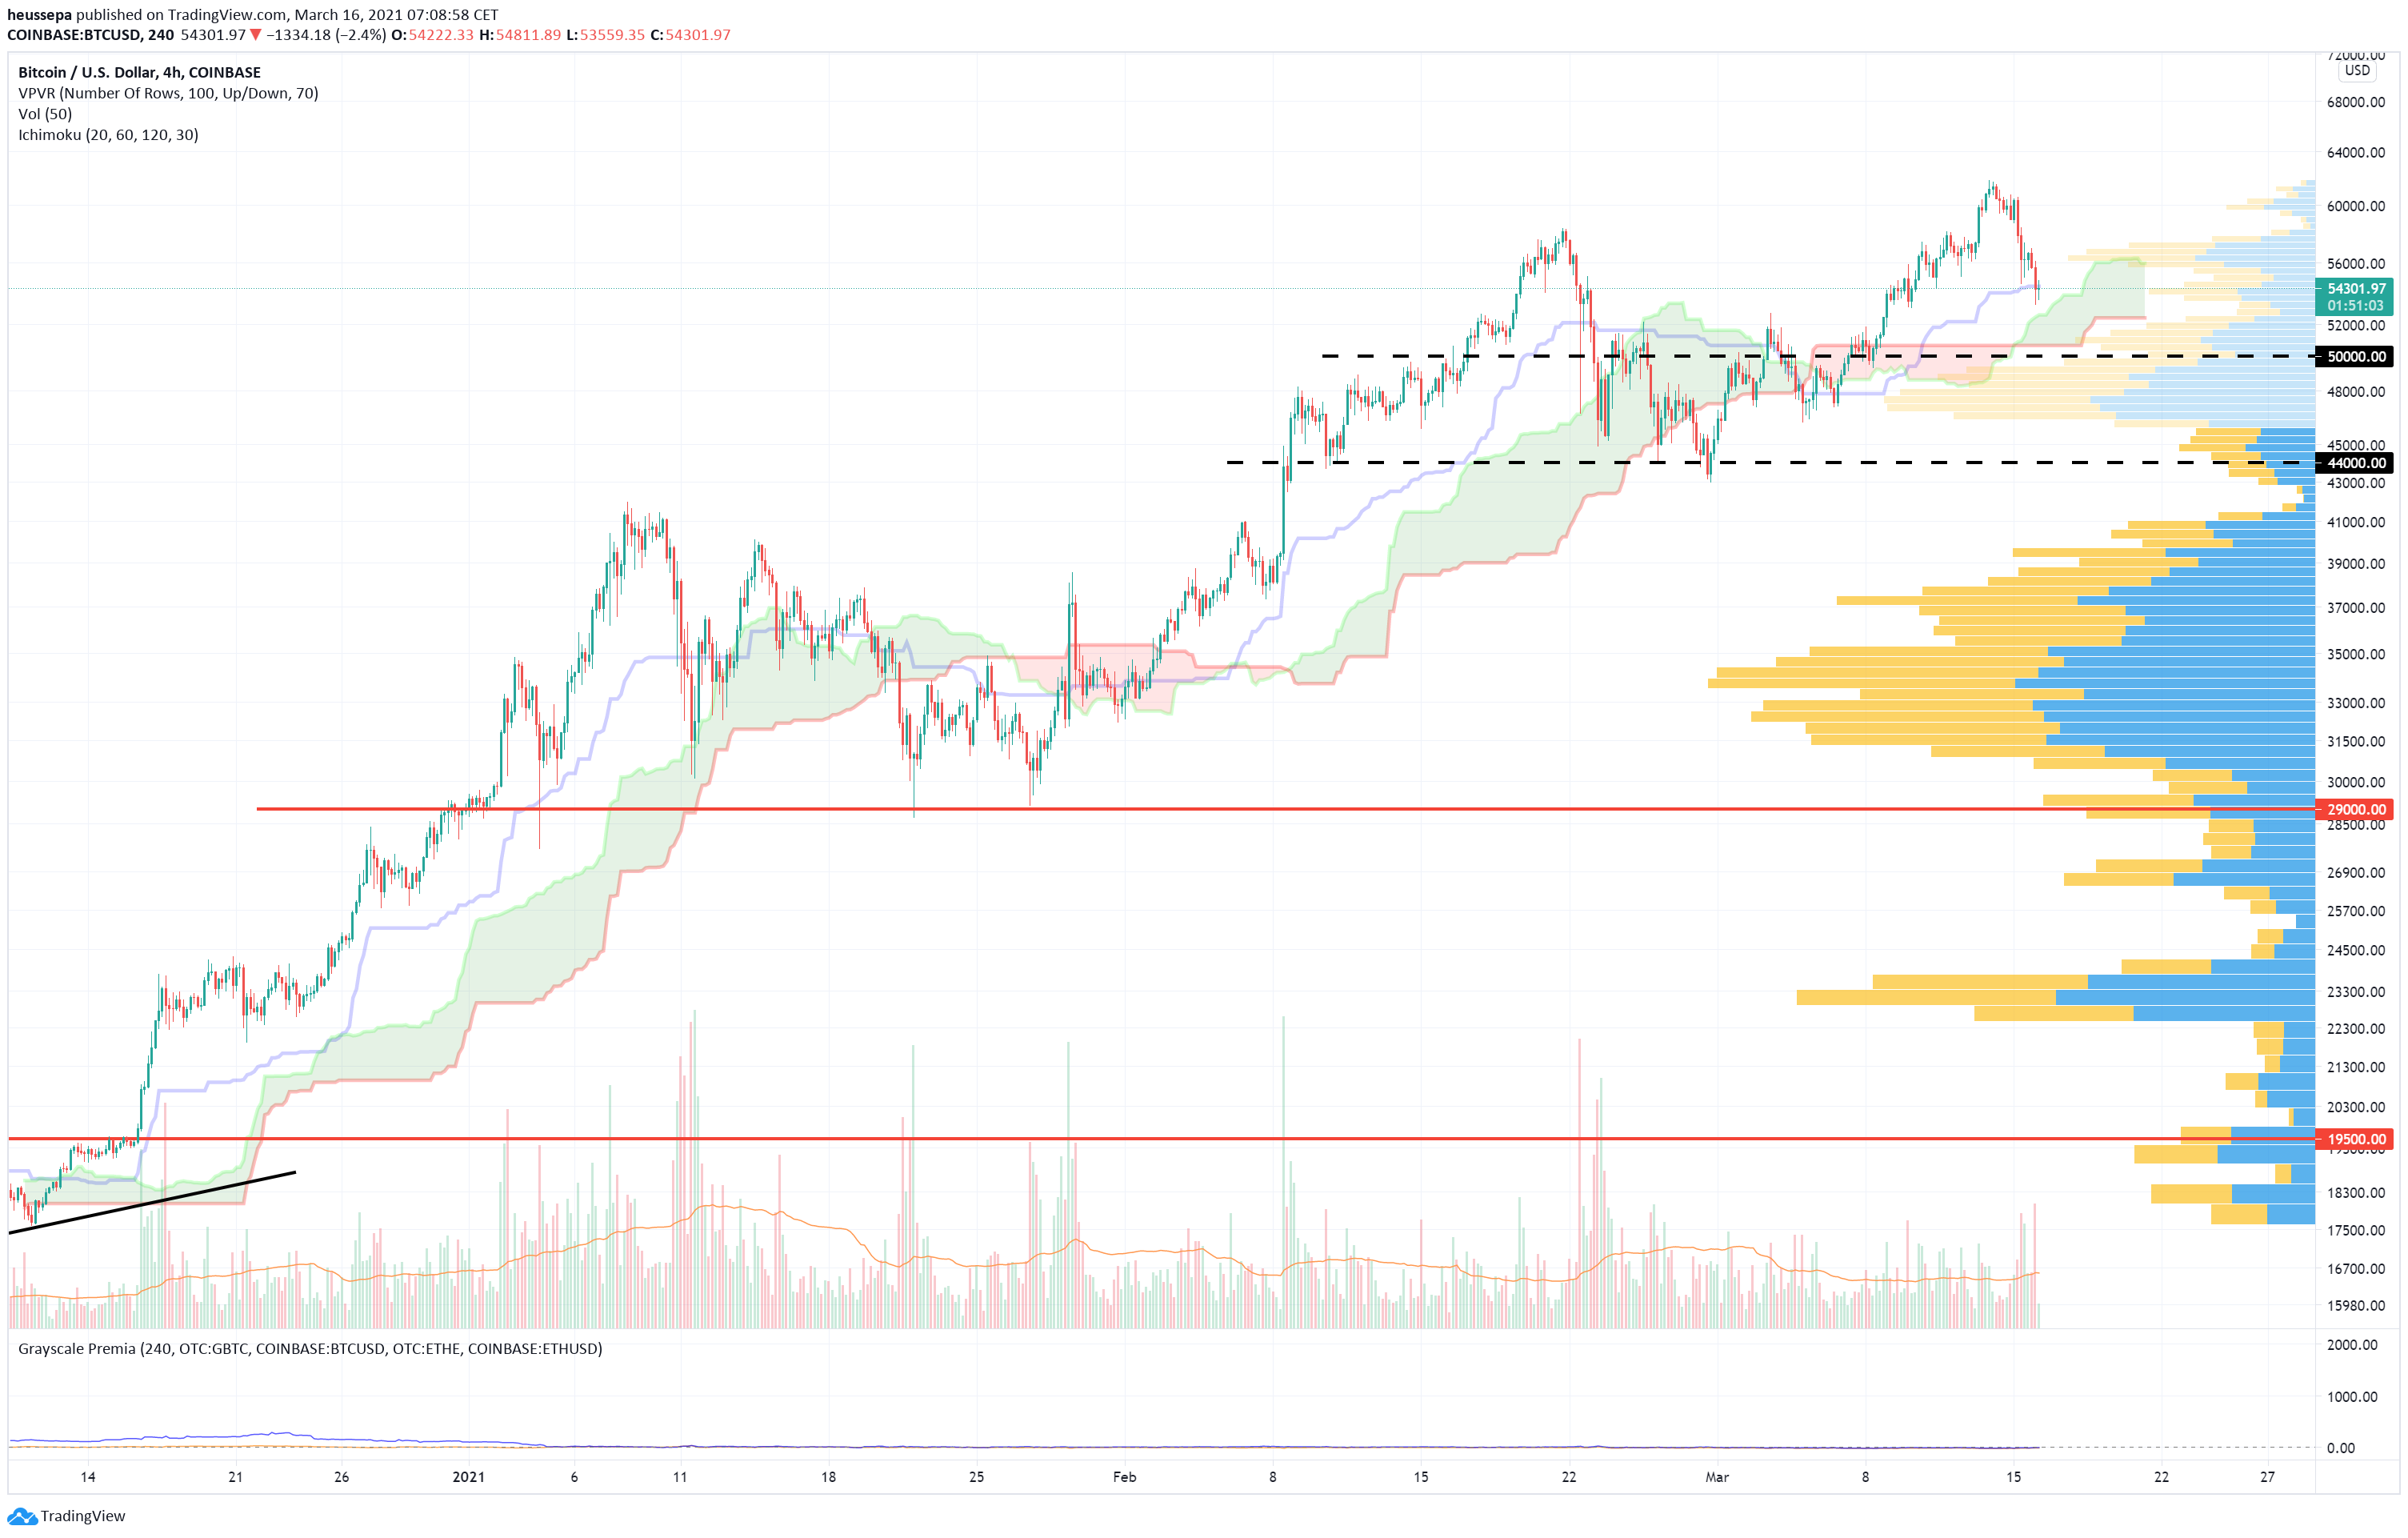
Things are getting a bit more “choppy” on this chart. The wave structure I mentioned on the daily chart is clearly visible here on the flipping Ichimoku cloud (bullish/bearish). Currently, we are fighting near the baseline, which is already pretty close to the upper band of the cloud. We are in an overall bullish scenario, and therefore I am rather looking for long positions, which is to say that I have more conviction (risk allocation) in terms of long trades versus short positions. However, there is no trade setup right now that is leaping out at me.
Copyright © 2021 | Crypto Broker AG | All rights reserved.
All intellectual property, proprietary and other rights and interests in this publication and the subject matter hereof are owned by Crypto Broker AG including, without limitation, all registered design, copyright, trademark and service mark rights.
Disclaimer
This publication provided by Crypto Broker AG, a corporate entity registered under Swiss law, is published for information purposes only. This publication shall not constitute any investment advice respectively does not constitute an offer, solicitation or recommendation to acquire or dispose of any investment or to engage in any other transaction. This publication is not intended for solicitation purposes but only for use as general information. All descriptions, examples and calculations contained in this publication are for illustrative purposes only. While reasonable care has been taken in the preparation of this publication to provide details that are accurate and not misleading at the time of publication, Crypto Broker AG (a) does not make any representations or warranties regarding the information contained herein, whether express or implied, including without limitation any implied warranty of merchantability or fitness for a particular purpose or any warranty with respect to the accuracy, correctness, quality, completeness or timeliness of such information, and (b) shall not be responsible or liable for any third party’s use of any information contained herein under any circumstances, including, without limitation, in connection with actual trading or otherwise or for any errors or omissions contained in this publication.
Risk disclosure
Investments in virtual currencies are high-risk investments with the risk of total loss of the investment and you should not invest in virtual currencies unless you understand and can bear the risks involved with such investments. No information provided in this publication shall constitute investment advice. Crypto Broker AG excludes its liability for any losses arising from the use of, or reliance on, information provided in this publication.

