
Technical Analysis
Good Morning!
It seems that market participants are uncertain about the next larger move that bitcoin will make. This can be seen in the charts.
Bitcoin BTC$ (daily)

I am not convinced (yet) that we have a confirmed rising wedge. But the decreasing volume together with the fact that local tops are happening faster and less forcefully, might mean that we see the market getting caught in a bull-trap.
If this plays out, my price target is in the area of $44-50k. In terms of the big picture, this is totally fine, and does not break the bullish trend.
Bitcoin BTC$ (4h)

I mentioned the $54k level in my weekend post (in combination with the rising wedge). This price also shows the importance of the pivot points. The S comes in just below $54k.
The 4h chart does not look good. I am expecting some battles inside of the Ichimoku cloud, but if you pointed a gun at my head, I would opt to sell there.
S2 comes in just at the $50k level, but given the price-volume pattern, I think we might take a further dive to $48k.
Today, I would also like to highlight a coin that seems to be going against the mainstream: IOTA.
IOTA$ (daily)
We saw some really strong buying interest from the high $0.35 area all the way up to $1.40. The price move reminds me of some of the DeFi tokens. The only small difference is that the IOTA project has been around way longer than the DeFi sector itself.
It will be hard to get a position on right now, but my preferred buying area is between $1.00-1.20.
IOTA$ (4h)
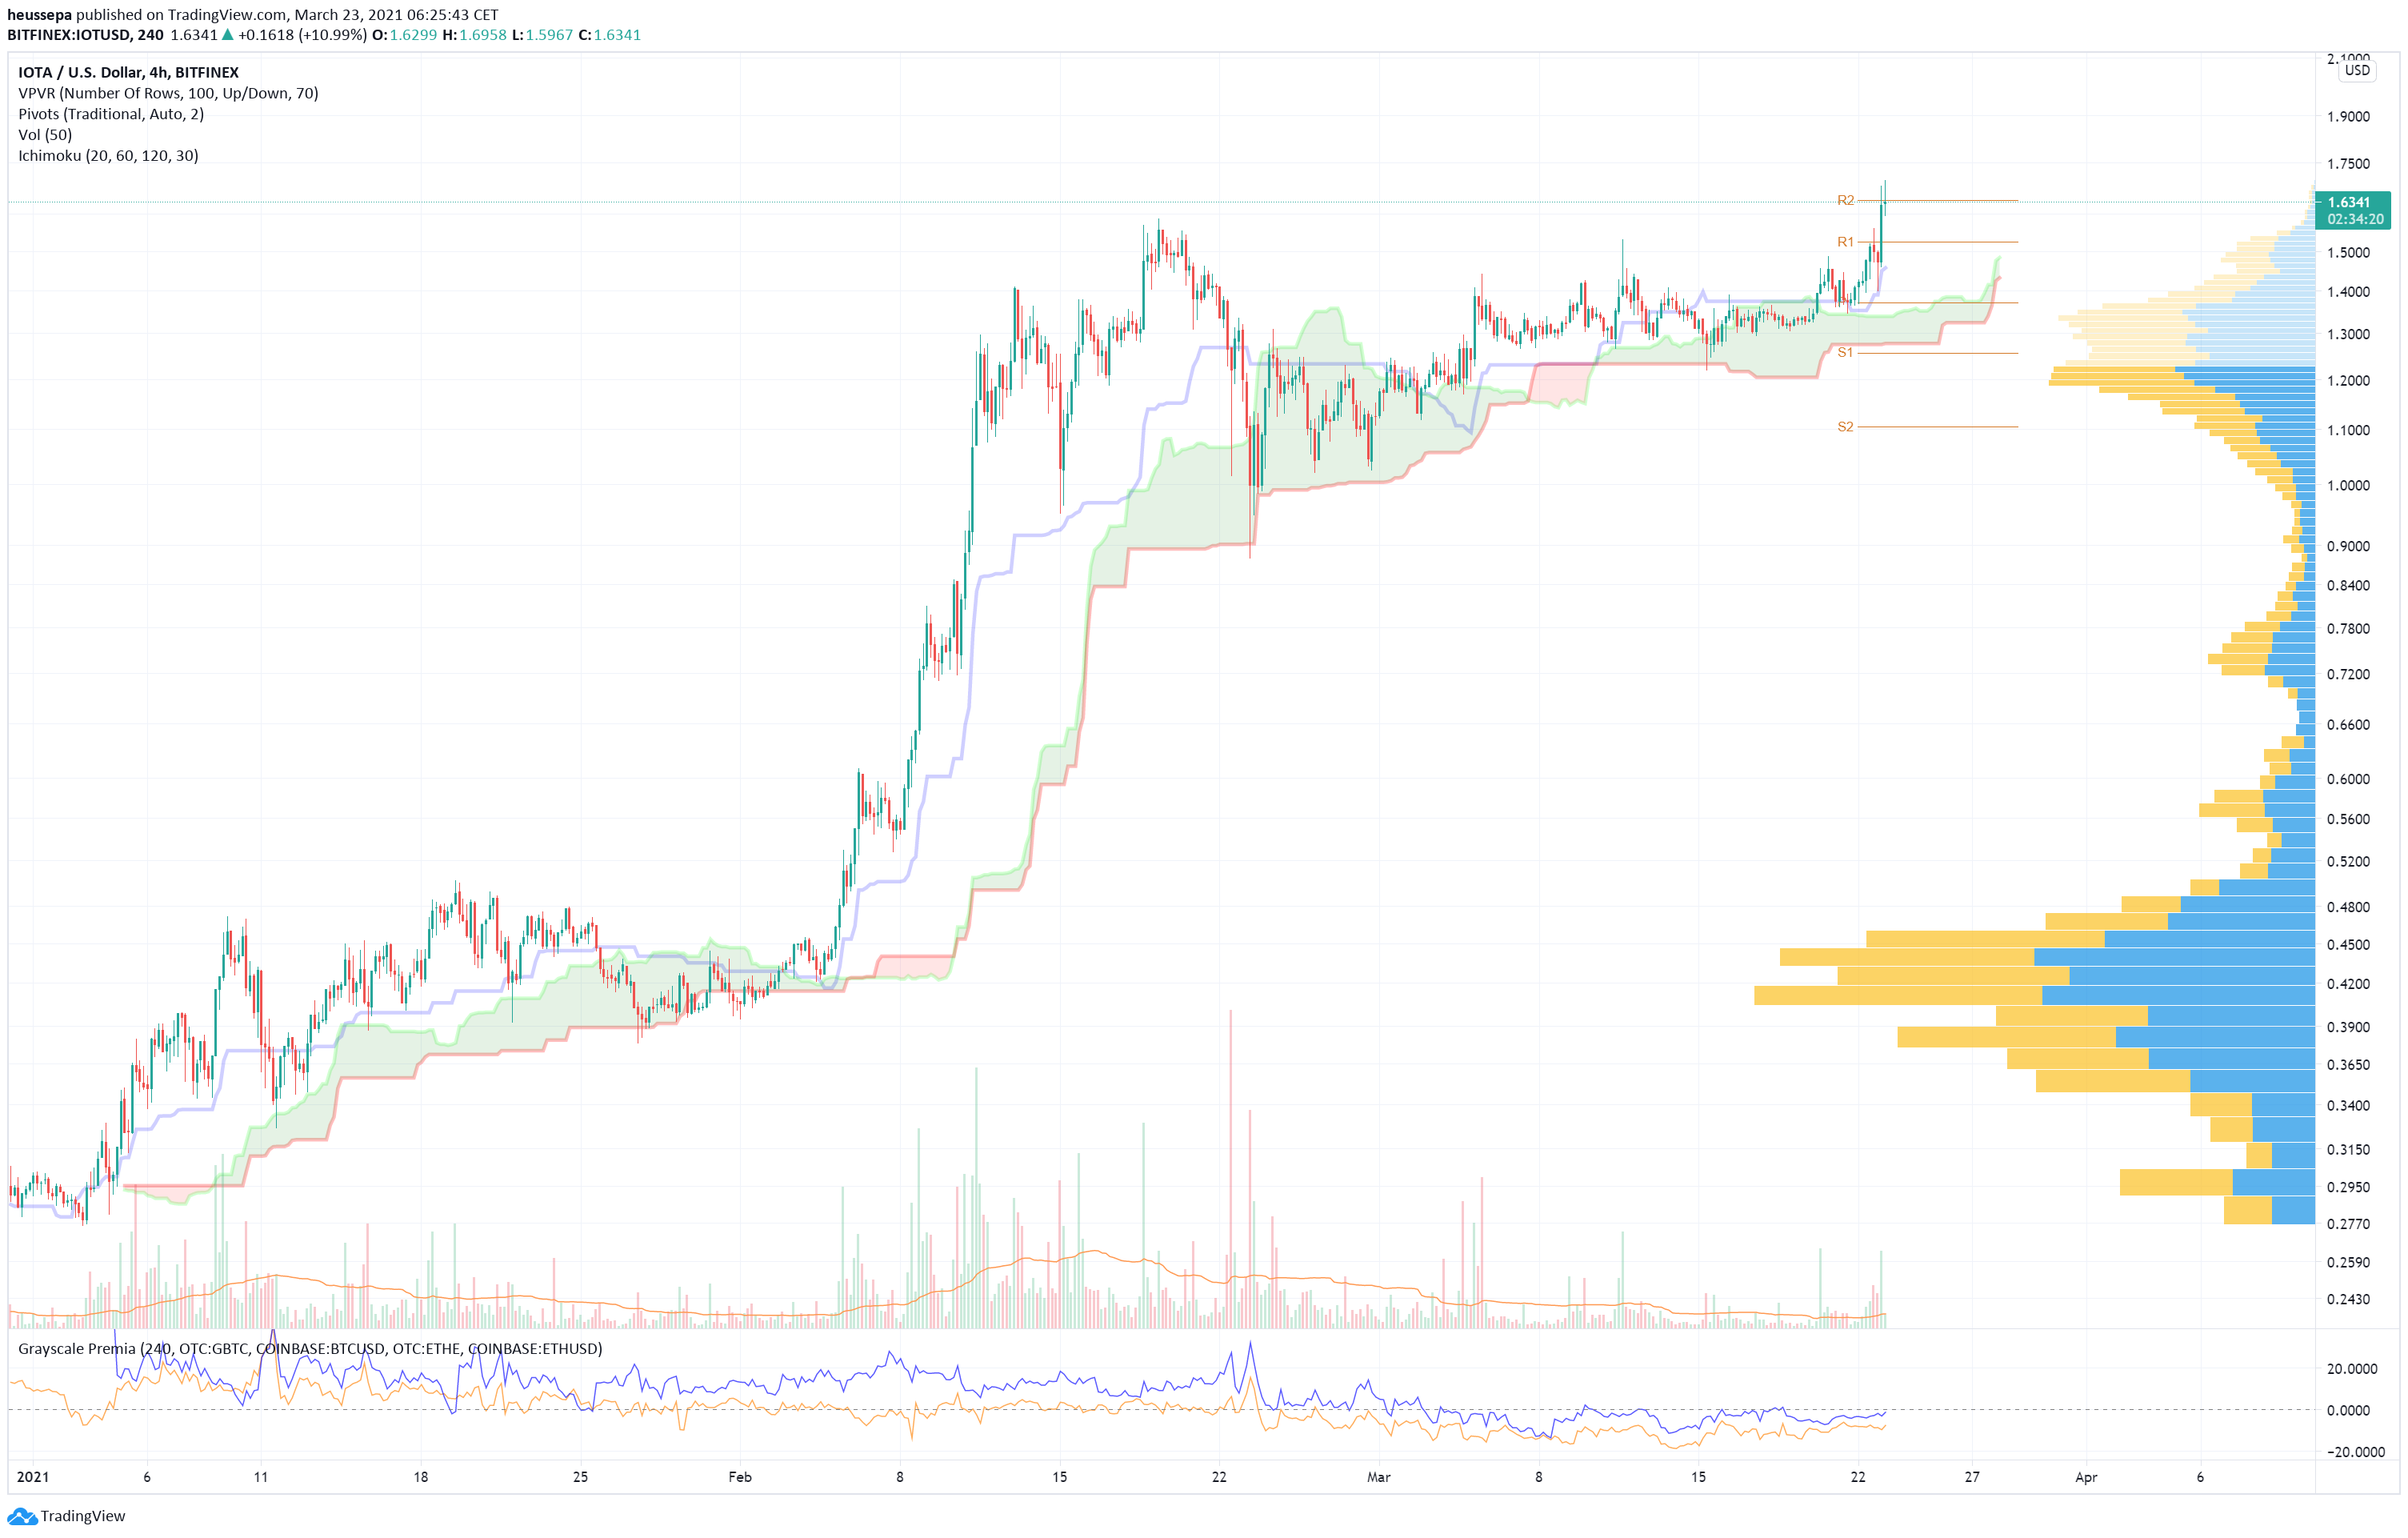
I think there is a good chance that we will come back down, as we are already up at the R2 level.
The $1.40 area, which is just above the Ichimoku cloud, is my first bid level. The coin is pretty volatile (similar to that of some DeFi tokens), but the development team has started to release some groundbreaking changes. We will have some more information in a detailed analysis about IOTA in the near future.
Copyright © 2021 | Crypto Broker AG | All rights reserved.
All intellectual property, proprietary and other rights and interests in this publication and the subject matter hereof are owned by Crypto Broker AG including, without limitation, all registered design, copyright, trademark and service mark rights.
Disclaimer
This publication provided by Crypto Broker AG, a corporate entity registered under Swiss law, is published for information purposes only. This publication shall not constitute any investment advice respectively does not constitute an offer, solicitation or recommendation to acquire or dispose of any investment or to engage in any other transaction. This publication is not intended for solicitation purposes but only for use as general information. All descriptions, examples and calculations contained in this publication are for illustrative purposes only. While reasonable care has been taken in the preparation of this publication to provide details that are accurate and not misleading at the time of publication, Crypto Broker AG (a) does not make any representations or warranties regarding the information contained herein, whether express or implied, including without limitation any implied warranty of merchantability or fitness for a particular purpose or any warranty with respect to the accuracy, correctness, quality, completeness or timeliness of such information, and (b) shall not be responsible or liable for any third party’s use of any information contained herein under any circumstances, including, without limitation, in connection with actual trading or otherwise or for any errors or omissions contained in this publication.
Risk disclosure
Investments in virtual currencies are high-risk investments with the risk of total loss of the investment and you should not invest in virtual currencies unless you understand and can bear the risks involved with such investments. No information provided in this publication shall constitute investment advice. Crypto Broker AG excludes its liability for any losses arising from the use of, or reliance on, information provided in this publication.

