
Bitcoin/USD daily basis
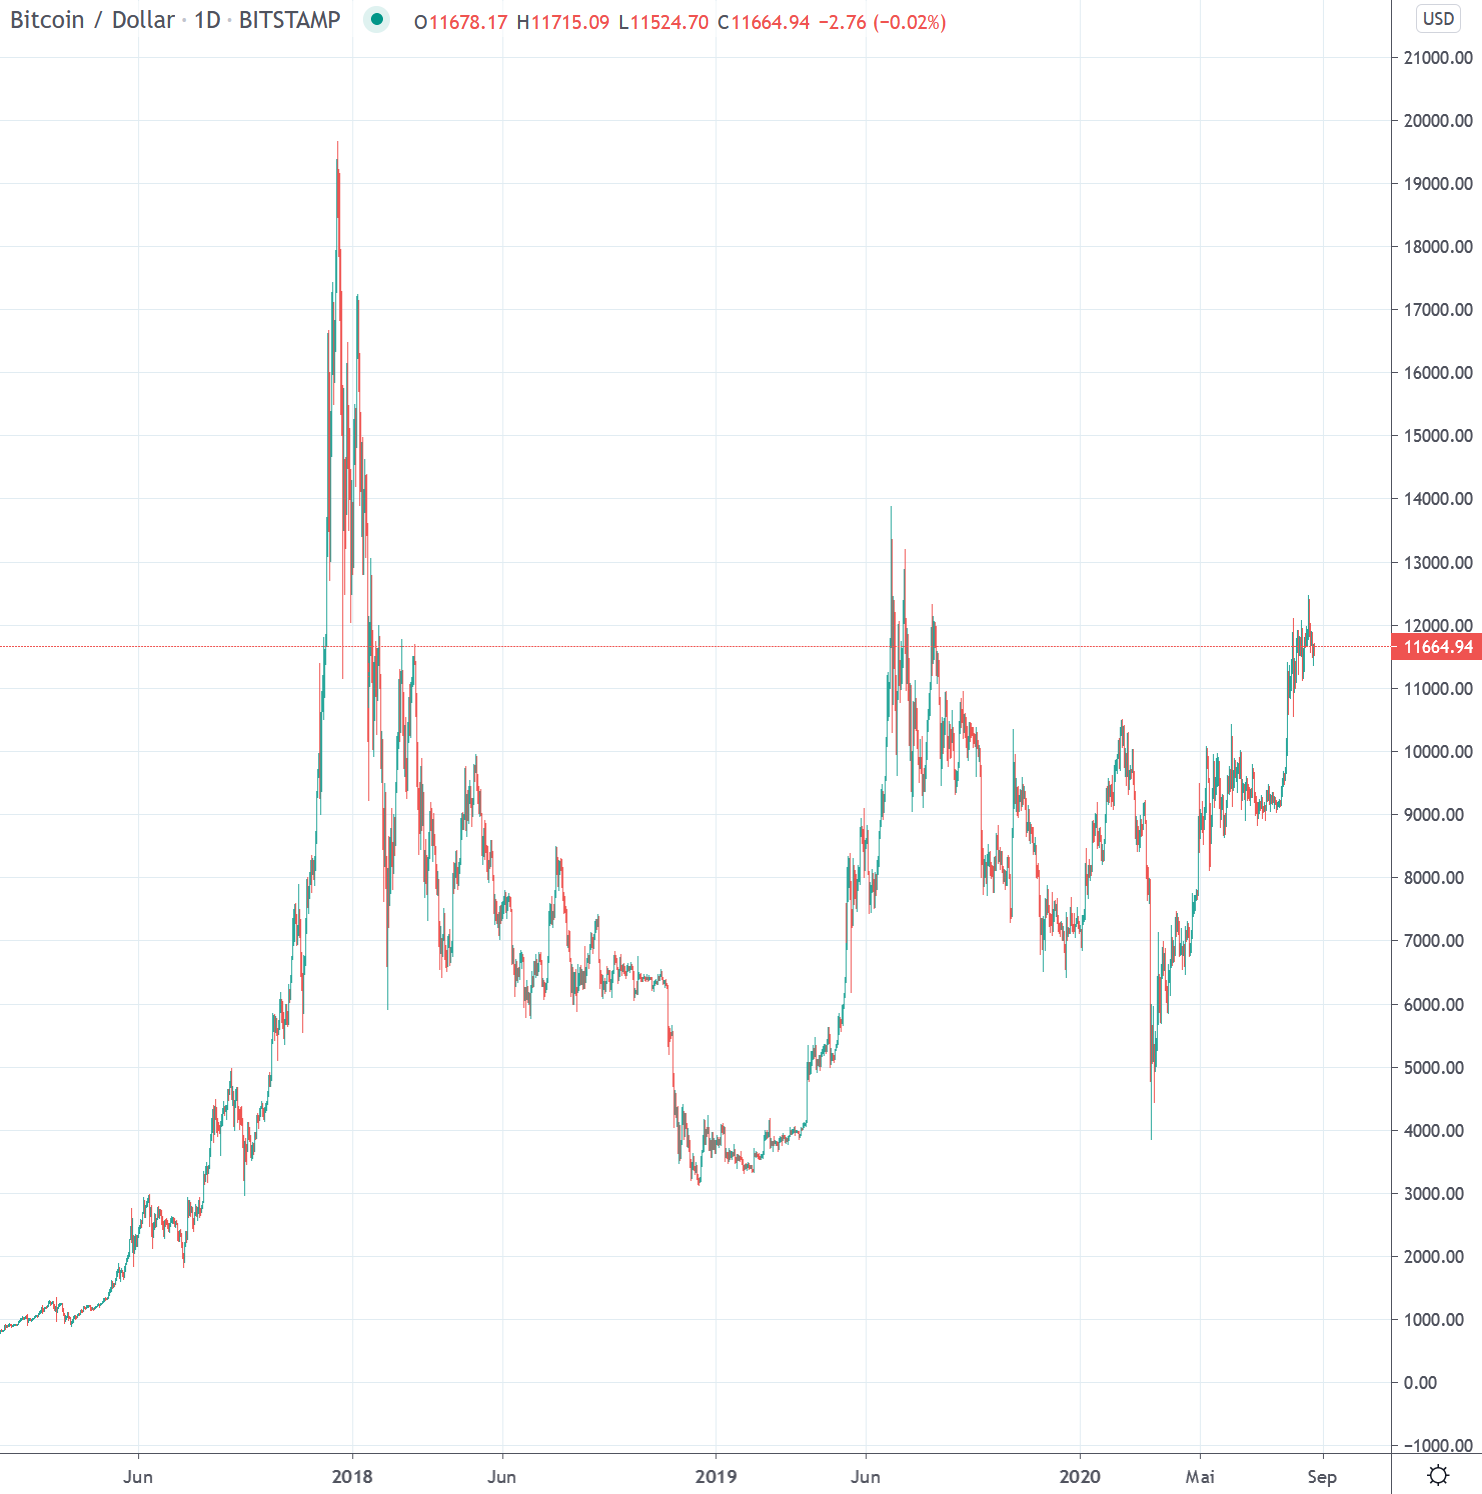
Bitcoin USD - consolidation near recent highs
The reporting week was characterized by a downward trend. Although a breach of the USD 12,000 mark was achieved on Monday, this breakout already marked the high for the week. The Bitcoin price reached a daily high of just under USD 12,400 and a closing price of around USD 100 below this. Already on Tuesday a correction followed with a daily low of USD 11,800 and a closing price just below the USD 12,000 mark. From Wednesday until the end of the week, narrower trading ranges were recorded with lower daily highs and lows. This trend led Bitcoin to a weekly low of around USD 11,370 on Saturday. Sunday was mixed with a slightly more positive investment and a trading focus around 11,600 USD.
Breakthrough through historical resistance
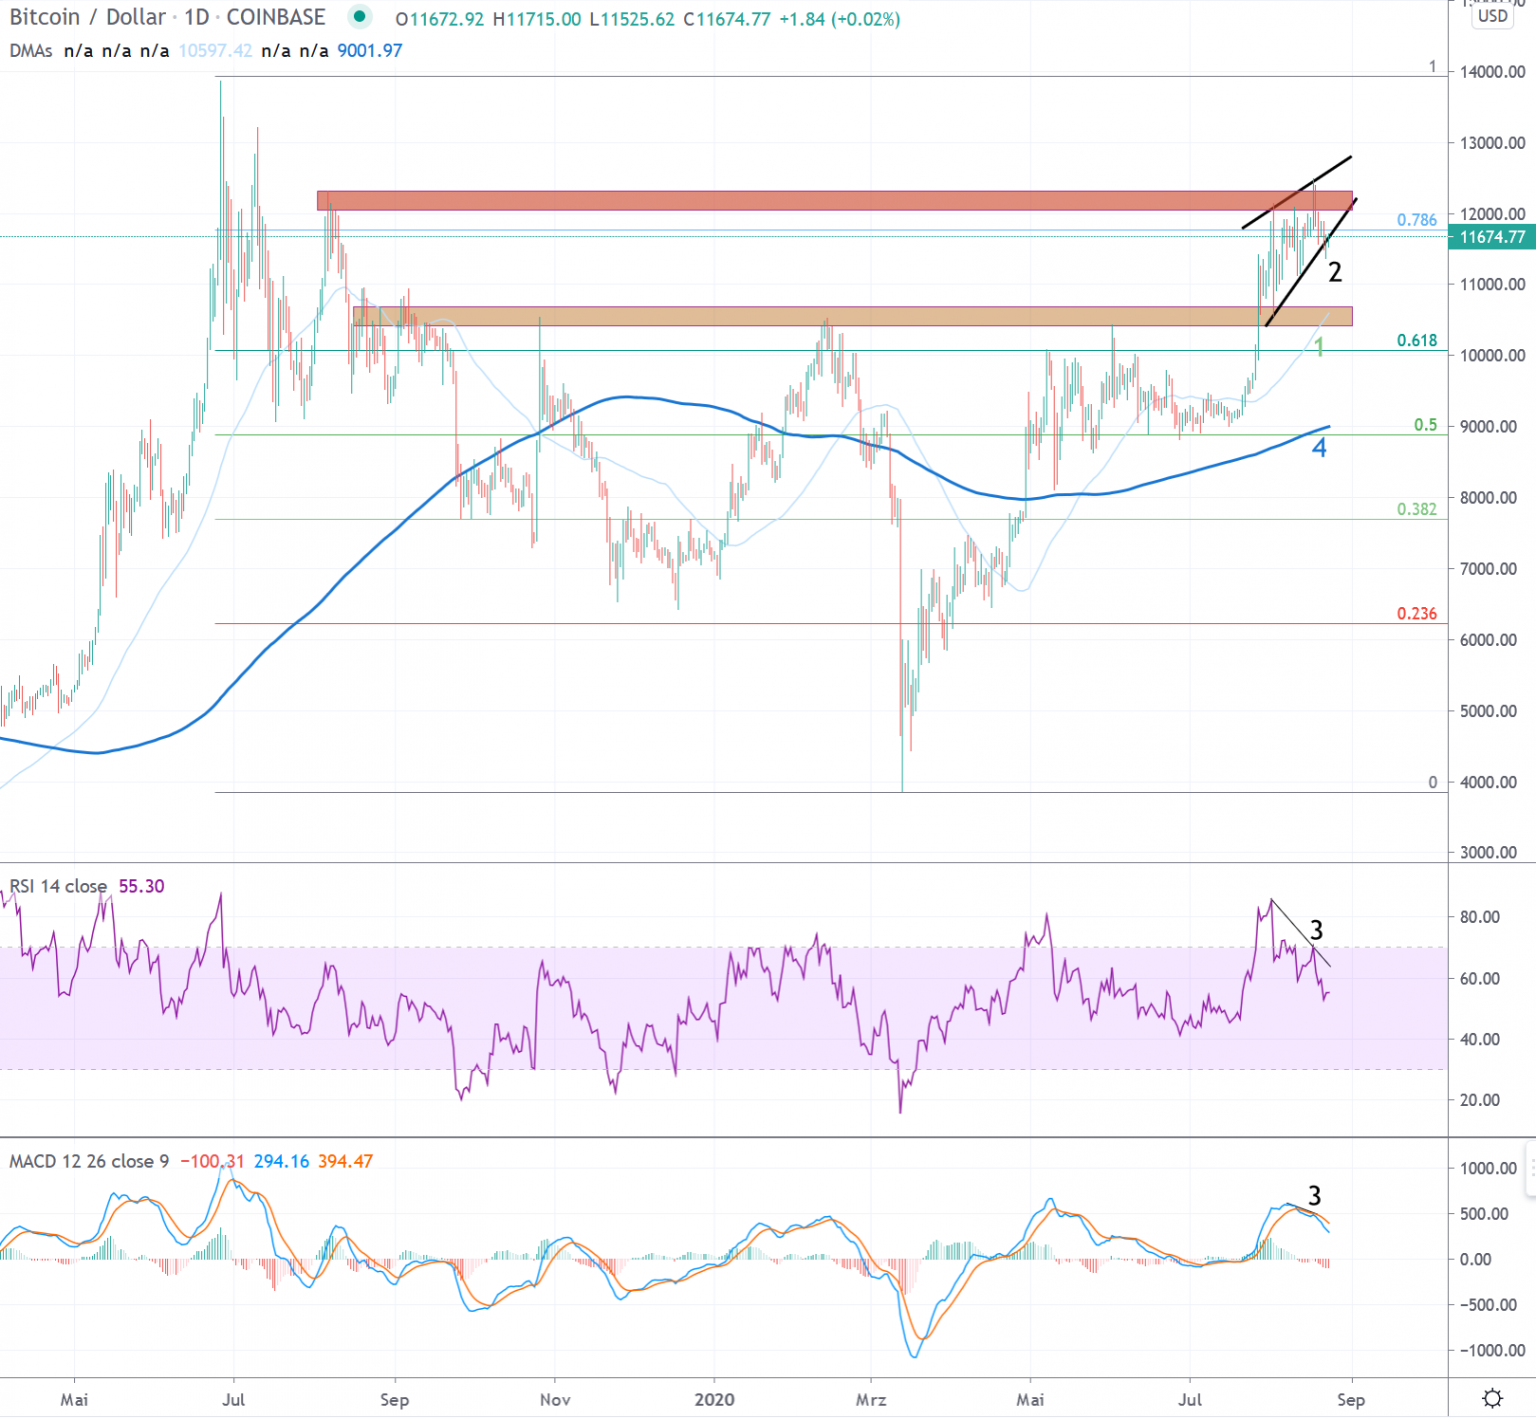
Review of Daily Interval
A veritable countermovement established itself after the price slump in mid-March. This led up to the resistance zones starting at USD 10,000. After a renewed rejection at the beginning of June, an almost two-month consolidation was observed. This was characterized by a series of higher daily lows and lower daily highs. The series of lower highs was broken on 22 July. This was followed on July 27 by a break through the resistance zone around USD 10,500, which has been established since August 2019 and which Bitcoin has already failed to break several times.
The resistance zone around USD 10,000 was interesting in several respects. On the one hand, the 0.618 Fibonacci point (1) of the entire downward movement, which was heralded at the end of June 2019 just below USD 14,000, is located here. On the other hand, the zone around $10,000 also served as a confirmation of the still bearish trend of lower highs since December 2017 (see next section). This zone now counts as a significant support (green).
Outlook
What can now confirm the sustainability of the recent outbreak is an establishment above historical resistance at USD 10,500. With this week's failed breakout above $12,000 and the subsequent drop in price to $11,300, signs of the recent uptrend weakening are visible. Firstly, the lower trend line of the previously observed "rising derelict" formation has been breached, transforming into a rising wedge (2), a bearish formation. Also, the negative RSI and MACD (3) continue to diverge.
A correction becomes more likely, support is expected at around USD 11,000. Below that, the aforementioned USD 10,500 mark should provide further support. This zone should be respected for a sustained momentum-driven uptrend. Further support is expected around 9'500 USD, which has been generated by trading since the beginning of May. The 200-day moving average is also located here (4).
The next resistance to be overcome just above USD 12,000 is significant. Should this be permanently overcome, there is little resistance left until the all-time high of December 2017 and the probability of a sustained trend reversal would be high (see next section).
Macro: Series of lower highs broken since end of 2017
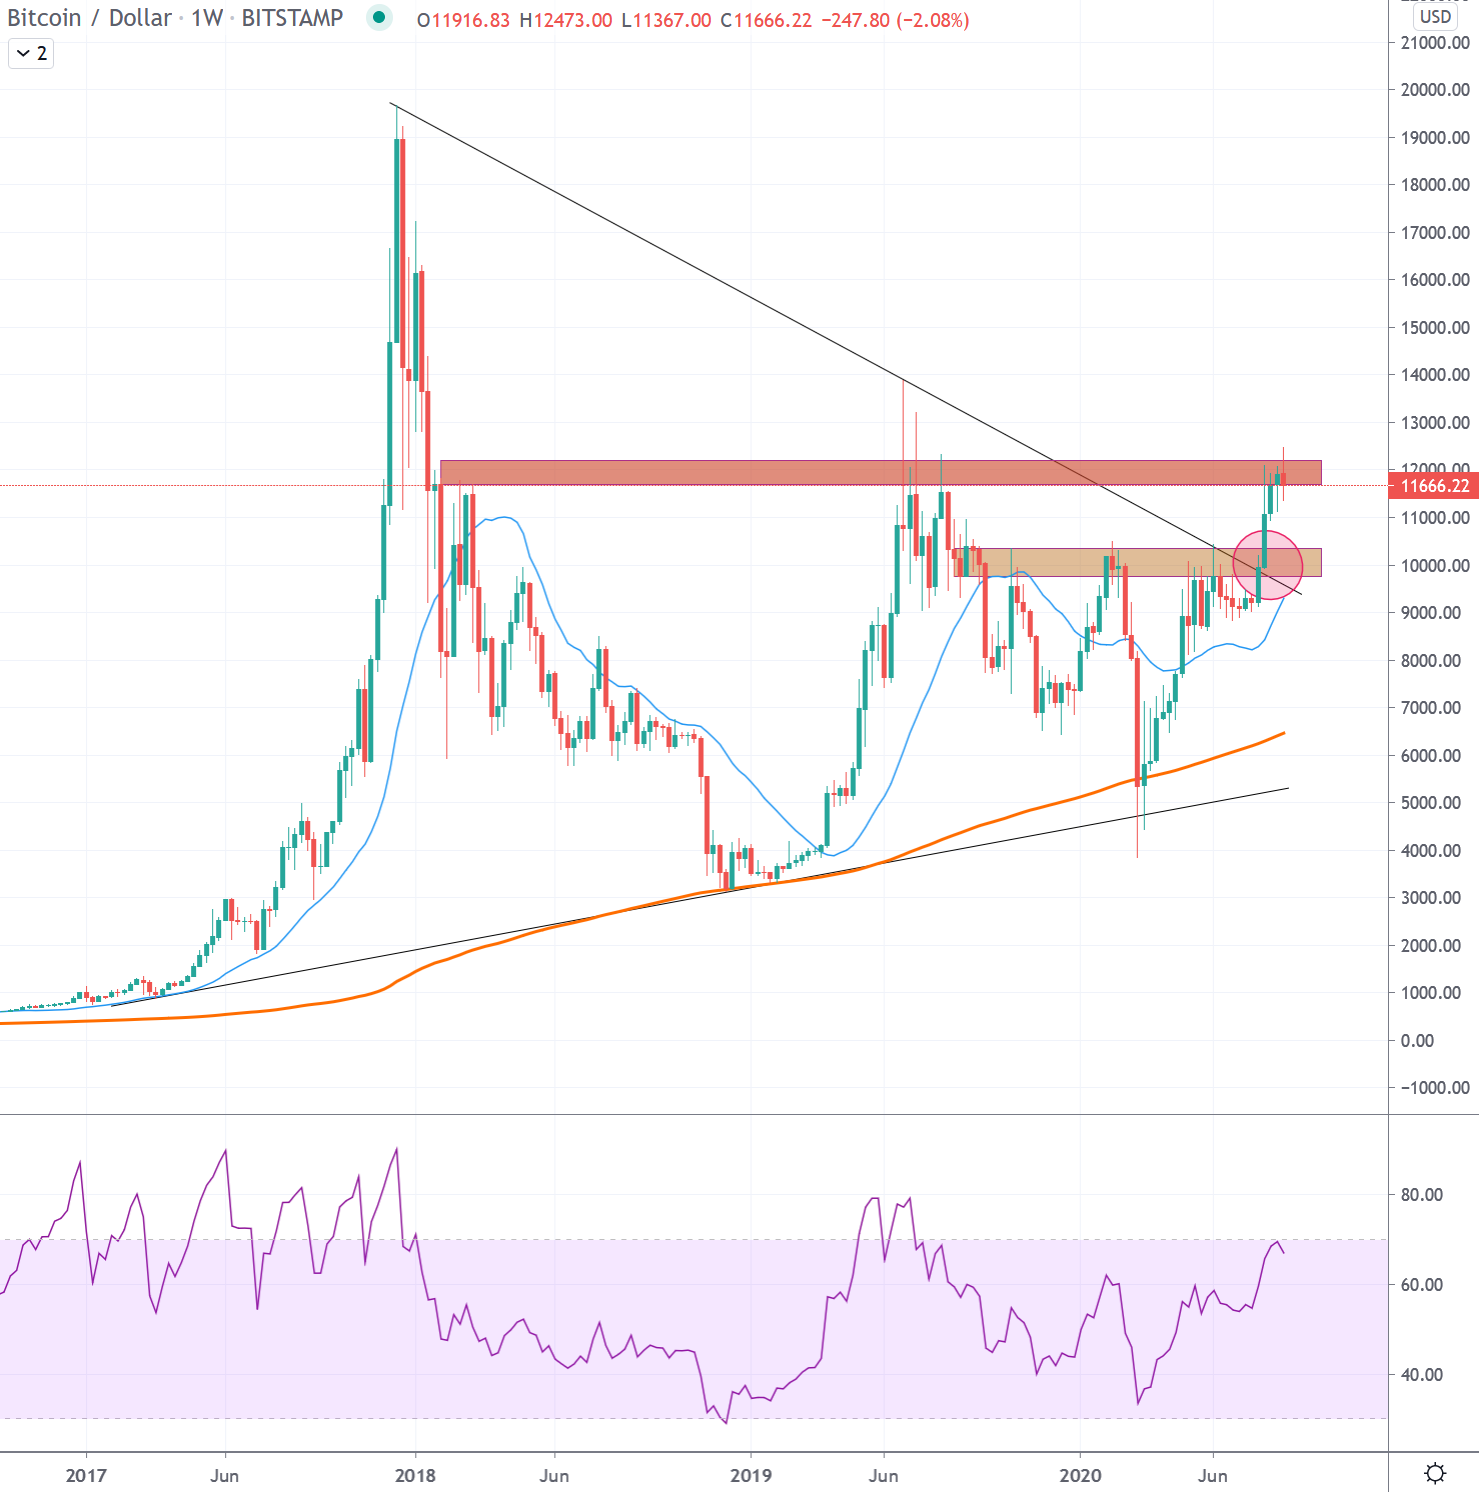
Bitcoin was able to set a higher high for the first time in the weekly interval, breaking the prevailing bearish trend since December 2017. The series of lower highs, which lasted for 135 weeks, was thus interrupted (marker).
In order to change the negative macro picture into a valid trend reversal, the breakout should be legitimized by several weekly candles above the USD 10'000 mark.
An establishment above USD 10'000 and a consistent overcoming of the resistance around USD 12'000 over the next weeks speak for a legitimacy of the trend reversal. If the Bitcoin exchange rate can then consolidate above USD 12,000 again, the chances of an attack on the all-time high of a good USD 20,000 would certainly exist.
A drop in the price, which would bring the price back into the USD 9,500 range and below over several weeks, would damage the positive momentum and argue for a longer consolidation.
Haftungsausschluss
Alle Angaben in dieser Publikation erfolgen ausschliesslich zu allgemeinen Informationszwecken. Die in dieser Publikation zur Verfügung gestellten Informationen stellen keine Anlageberatung dar und sind auch nicht als solche beabsichtigt. Diese Publikation stellt kein Angebot und keine Empfehlung oder Aufforderung für eine Anlage in ein Finanzinstrument einschliesslich Kryptowährungen und dergleichen dar und ist auch nicht als Angebot, Empfehlung oder Aufforderung beabsichtigt. Die in der Publikation enthaltenen Inhalte stellen die persönliche Meinung der jeweiligen Autoren dar und sind nicht als Entscheidungsgrundlage geeignet oder beabsichtigt.
Risikohinweis
Anlagen und Investitionen, insbesondere in Kryptowährungen, sind grundsätzlich mit Risiko verbunden. Der Totalverlust des eingesetzten Kapitals kann nicht ausgeschlossen werden. Kryptowährungen sind sehr volatil und können daher in kurzer Zeit extremen Kursschwanken ausgesetzt sein.

