
A summarizing review of what has been happening at the crypto markets of the past week. A look at trending sectors, liquidity, volatility, spreads and more. The weekly report in cooperation with market data provider Kaiko.
The last 7 days in the cryptomarkets:
- Price Movements: Bitcoin is up 99% YTD while gold is down more than 10%.
- Trading Volume: Trade count has fallen on Uniswap despite soaring volumes.
- Order Book Liquidity: Price slippage shows how easy it is to move Bitcoin's price.
- Volatility and Correlations: USDC is the most stable stablecoin.
Financial markets diverge
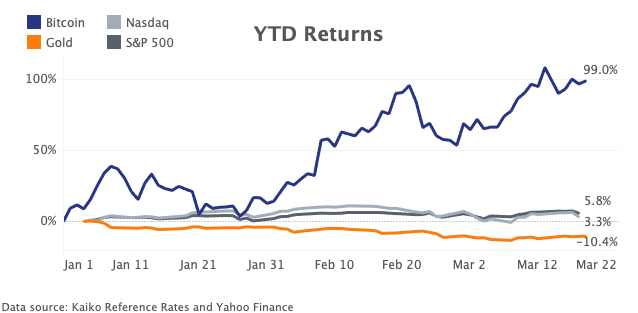
Financial markets have lost momentum in 2021 following a record-setting run up in equities. The S&P 500 and Nasdaq indices are still up single digits for the year, but Gold is down more than 10% in a sharp turnaround for the store of value. Meanwhile, Bitcoin is up 99% YTD, and remains the best performing asset by a long shot.
Analyzing Uniswap trade dynamics
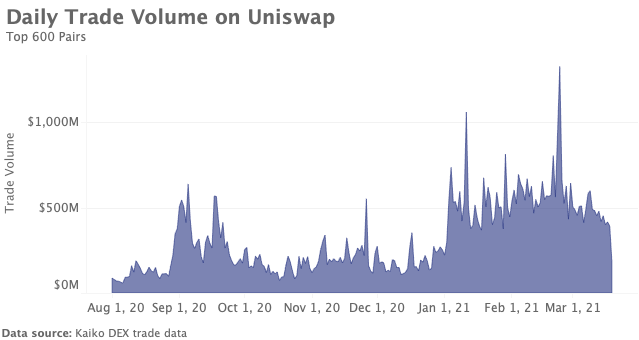
Uniswap is the largest decentralized exchange and boasts trade volumes often on par with the biggest centralized exchanges. Uniswap recently became the first DEX to cumulatively process more than $100 billion in volume, and in early February daily volumes crossed $1.3 billion for the first time. Overall, trade volumes have nearly doubled since the fall.
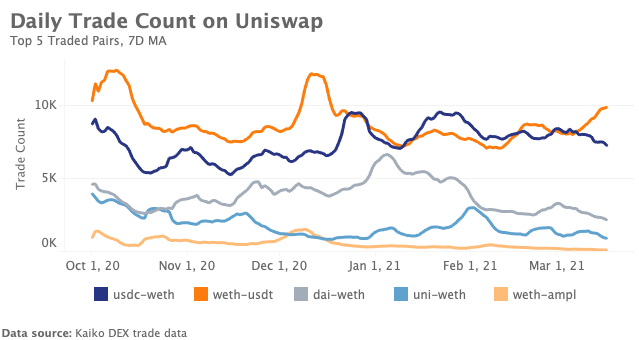
But when looking at trade count - measured as the raw number of executed transactions - we notice a considerably different trend. Daily trade count peaked in late September, fell sharply, and then stabilized at around 50,000 per day.

Below, we chart daily trade counts for the five top trading pairs, and can observe that most pairs see under 10k trades per day. The vast majority of all pairs on Uniswap see under 1k per day.
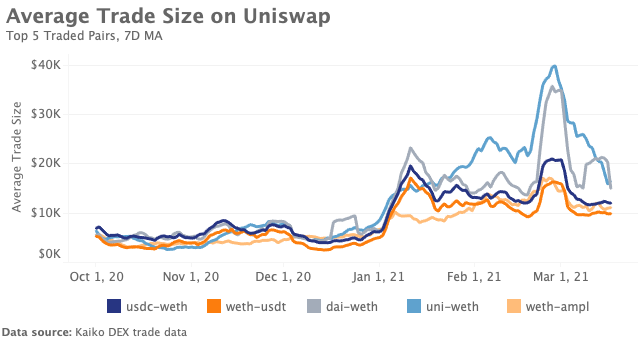
Typically, an increase in volume corresponds closely with an increase in trade count, but with Uniswap we see a divergence in this trend. Uniswap volumes have increased, but daily trade counts have fallen. The only way this can occur is if the average trade size has soared (average trade size = total volume / trade count). This is indeed what has happened: average trade sizes now range between $10-$30k per trade, which is huge compared with centralized exchanges.
How large orders move Bitcoin's price
A claim by strategists at Bank of America caught our eye this week, arguing that just $93 million could move the price of Bitcoin by 1%. The sum specifically referred to buying pressure in USD. With the right data, it is relatively simple to calculate price slippage across Bitcoin markets. However, price discovery is a complex process, determined by a multitude of factors.
There are about 20 exchanges in the industry which support BTC-USD trading, but not every exchange has equal impact on the price discovery process. Derivatives markets, Bitcoin pairs denominated in stablecoins, and actual supply considerations can all impact the process of price discovery, in addition to fiat spot pairs. Thus, it is quite complex to assess the realistic amount needed to move the price by 1%.
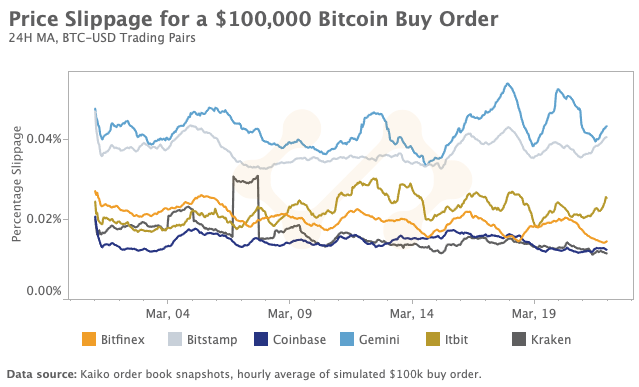
However, we can look at simulated price slippage to get an idea of how each Bitcoin market reacts to large market orders. Below, we chart the simulated price slippage for a $100k Bitcoin buy order on six fiat exchanges. To get this percentage, we use raw order book snapshots to determine how many price levels on the ask side are required to fill a market buy order.
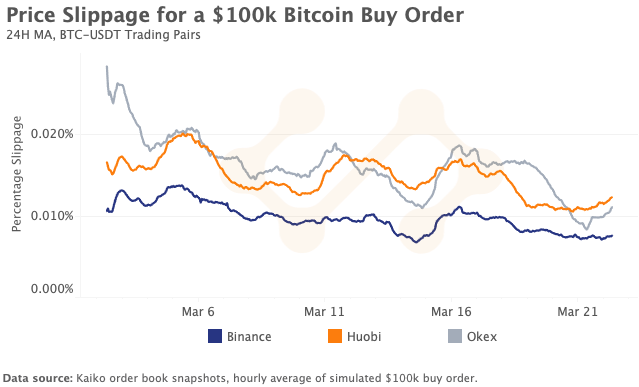
We also look at price slippage for BTC-USDT markets, which play a big role in price discovery with some of the highest volumes in the industry. We can observe that BTC-USDT on Binance has the lowest price slippage out of the "Big Three" of non-fiat exchanges. All three exchanges have average slippage under .02%, which is often better than fiat exchanges.
To summarize, slippage is a useful indicator for understanding how large market orders can influence the price of Bitcoin. However, it is not a fully accurate tool for determining the amount of money needed to push up or down the price. For example, influencing the price on just one exchange can have a ripple effect across markets, especially if that exchange's data is used in say, indices valuing derivatives contracts. It is not fully clear where the number "$93 million" came from, but if someone is able to test that amount, let us know.
USDC is the most stable stablecoin
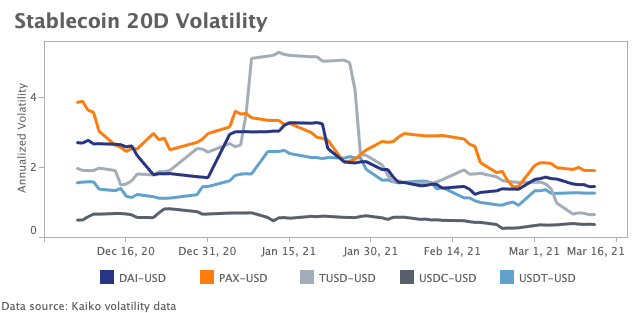
Stablecoins can often exhibit significant volatility despite their USD pegs. Volatility arises from changes to supply and demand curves, which can be difficult to control during market movements. Above, we chart the 20D volatility of five stablecoins, and can observe that USDC has the lowest measure for annualized volatility. Tether ranks second, while Dai ranks fifth, with a surge in volatility occurring mid January.


