
A summarizing review of what has been happening at the crypto markets of the past week. A look at trending sectors, liquidity, volatility, spreads and more. The weekly report in cooperation with market data provider Kaiko.
The last 7 days in cryptocurrency markets:
- Price Movements: A hawkish Fed meeting triggered a sharp sell-off in both crypto and equities markets.
- Volume Dynamics: DEX trade volume has risen for the 5th month in a row, concentrated mostly on Uniswap V3.
- Order Book Liquidity: Liquidity remained stable for USD markets despite strong volatility.
- Derivatives: Open interest plummeted but funding rates remained neutral during the sell-off.
- Macro Trends: Bitcoin's correlation to Nasdaq and the S&P 500 reached its highest level since July of 2020.
Bitcoin's Correlation With Equities Surges
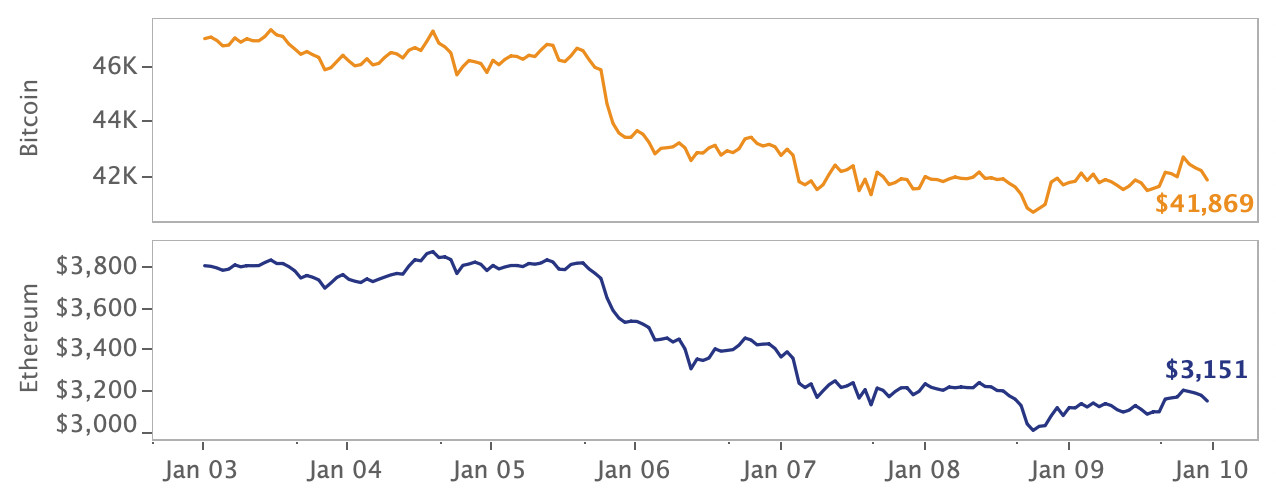
The monetary policy outlook officially shifted to “tighter-than-expected” following the release of the Federal Reserve’s December meeting minutes, causing both crypto and equity markets to experience a sharp sell-off. Bitcoin closed the week down 17% and its correlation to the S&P 500 equities index reached its highest level since July of 2020. Hundreds of millions in long liquidations were recorded on derivatives exchanges, exacerbating the price drop, and market sentiment now remains firmly bearish.
In other industry news, the NFT marketplace OpenSea was valued at $13.3 billion following a blow-out year that saw investors spend almost as much on digital collectives as traditional art. Also, a nationwide Internet blackout in Kazakhstan caused a drop in hashpower on the Bitcoin network.
Layer 1 tokens suffer following strong Q4.
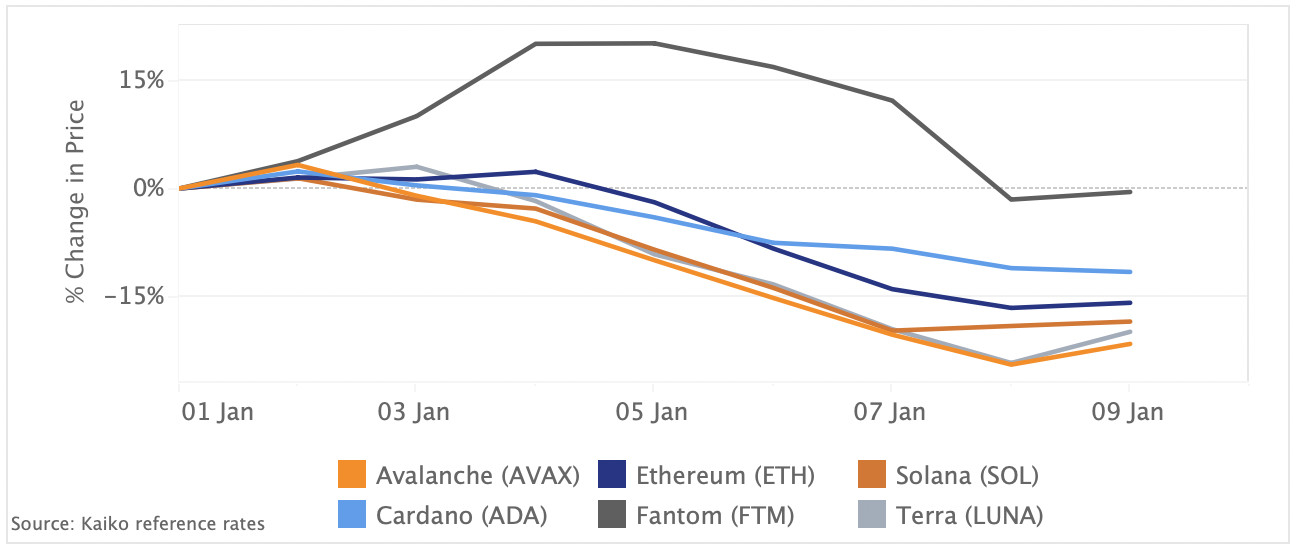
Most Layer 1 tokens plunged sharply last week, underperforming Ethereum alongside the overall crypto market. The decline comes even though alternative networks have gained market share relative to Ethereum over the past year (as measured by Total Value Locked) and the planned scaling of the network is still months away. Avalanche’s AVAX registered the strongest declines at -22% since 2022's open, well below Ethereum’s 16% drop. The native token of Terra – the second largest blockchain for decentralized finance- also declined by 20%. Terra’s LUNA enjoyed strong upside momentum over the past few months boosted by its Columbus-5 upgrade and the launch of several projects such as the DEX Astroport. Fantom’s FTM was the best performer, closing Sunday about where it started the year.
DEX trade volume picks up in December, dominated by Uniswap V3
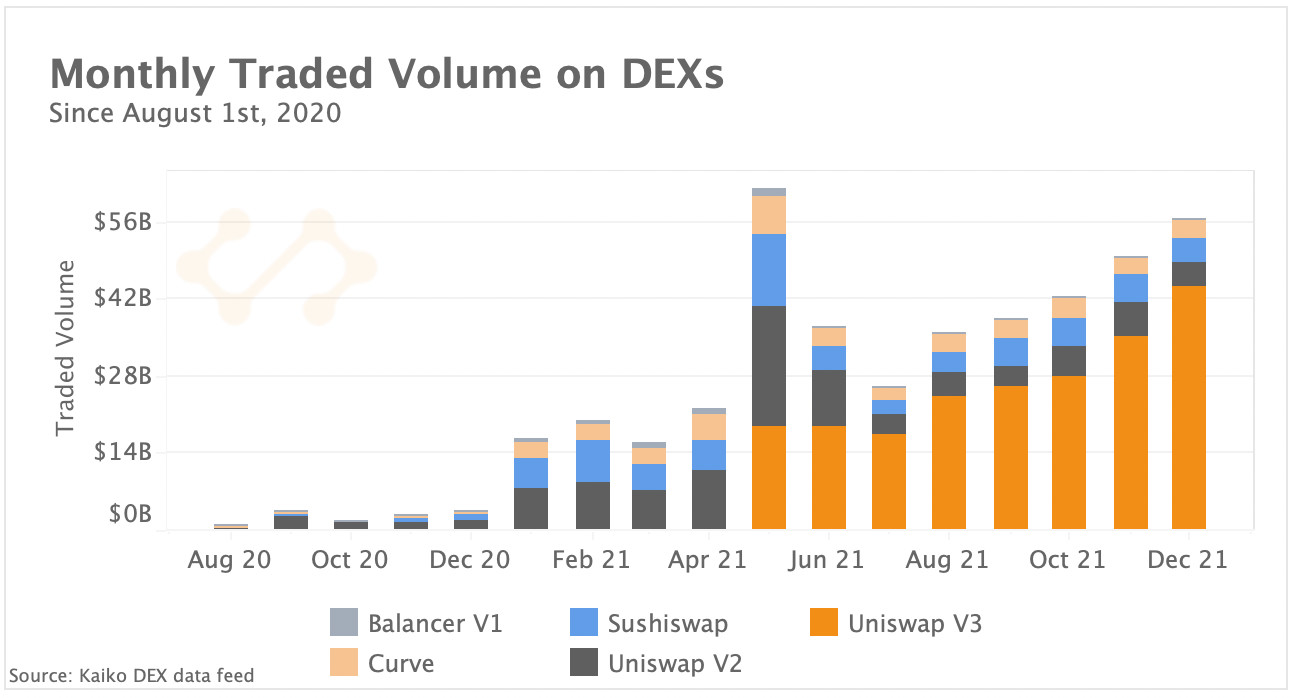
Trade volumes on the leading Ethereum-based DEXs have been on a steady upward trend since July, clocking $57B in December, the highest level since May. The increase is almost entirely driven by strong trading activity on Uniswap V3 which today accounts for 77% of total volume. Trading activity on Curve, a DEX optimized for exchanging stablecoins, rose from $3B to $4B month-to-month while volumes fell on Sushiswap and Uniswap V2.
While Curve holds the largest share of DeFi total value locked (TVL) on Ethereum (14%)—more than twice Uniswap’s TVL— trade volume remains relatively low compared with other DEXs. This is due to Curve's unique model for issuing liquidity rewards, which has caused TVL to skyrocket as pools battle to attract liquidity, creating a phenomenon known as the “Curve Wars.” This battle for liquidity spans multiple protocols and is complicated but relevant for understanding DeFi incentive models, so be sure to check out this thread to learn more.
Open interest plummets during latest sell-off while funding rates remain neutral
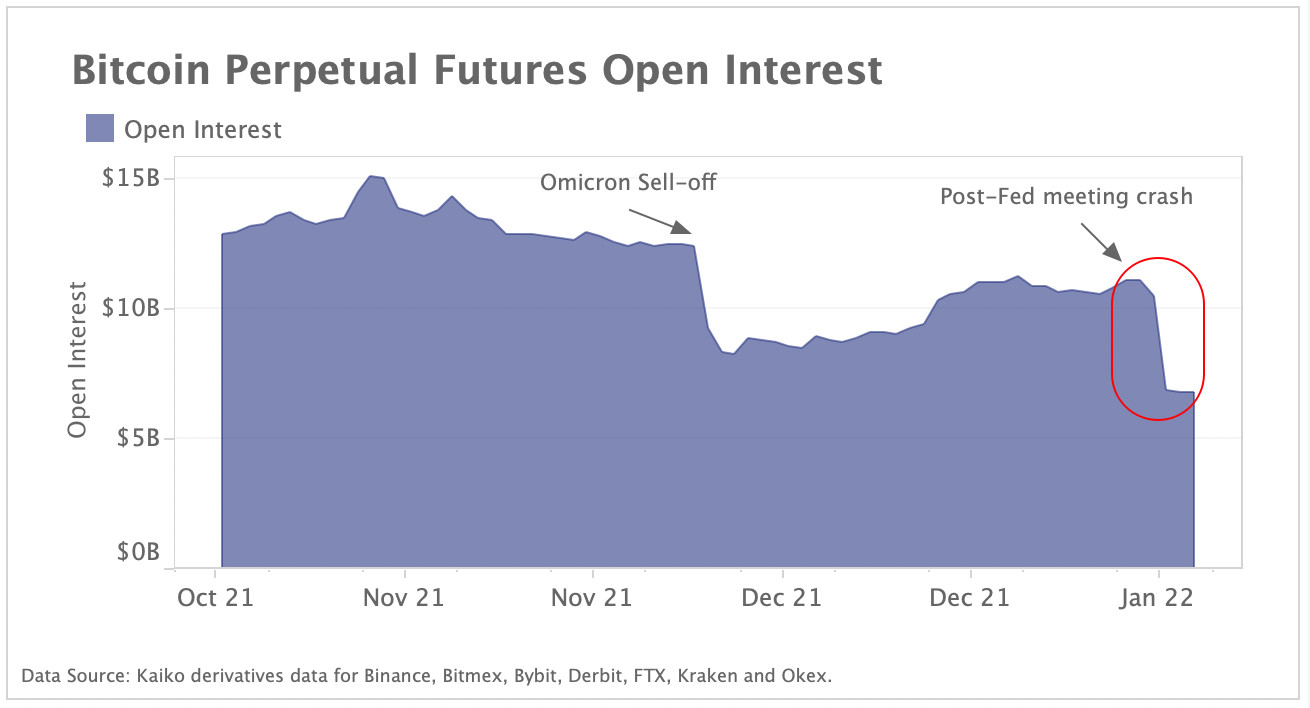
Bitcoin perpetual futures open interest dropped by 38% to $7B between January 5-7 as spot prices plunged from $46k to $41k, triggering deleveraging and forced liquidations on derivatives exchanges. Last week's drop in open interest was sharper than the Omicron sell-off in early December, which saw open interest plummet by 33% over 2 days. Retail-oriented exchanges Binance and Bybit saw the most dramatic declines, which suggests traders were using high amounts of leverage. Derivatives trade volumes exhibited volatility alongside Bitcoin’s price swings, soaring by 74% on Jan 5-6 to $59B before falling to $29B on Jan 7 and surging again to $51B.
Despite the strong drop in open interest, funding rates for Bitcoin perpetual futures hardly showed any volatility, in sharp contrast to early December's sell-off which saw funding rates on all exchange briefly turn negative.
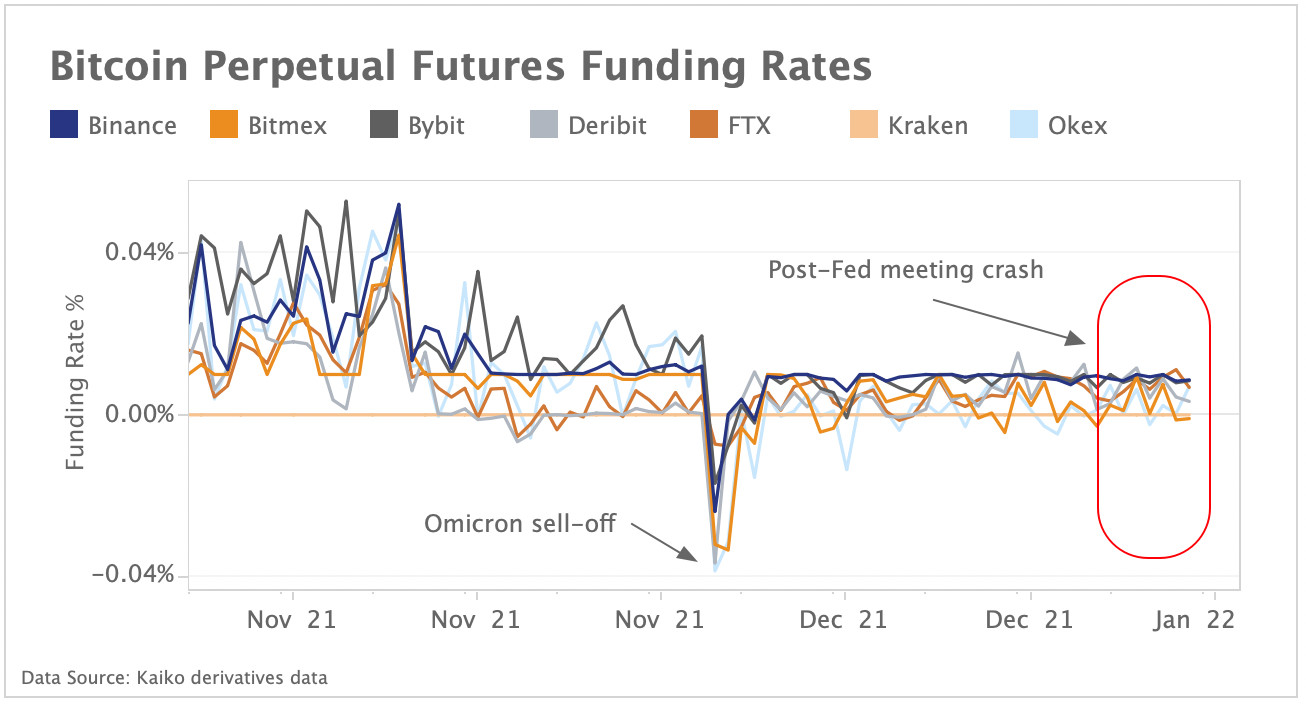
Funding rates are the cost of holding a long position and are seen as a gauge of market sentiment and leverage. When funding rates are positive, long position traders are dominant and paying funding to short traders. Negative funding rates suggest an overall bearish sentiment, with short traders dominant. The fact that funding rates did not plummet like they did in early December suggests that leverage wasn't as extreme and the balance between longs and shorts was more stable.
Options volumes diverge from futures
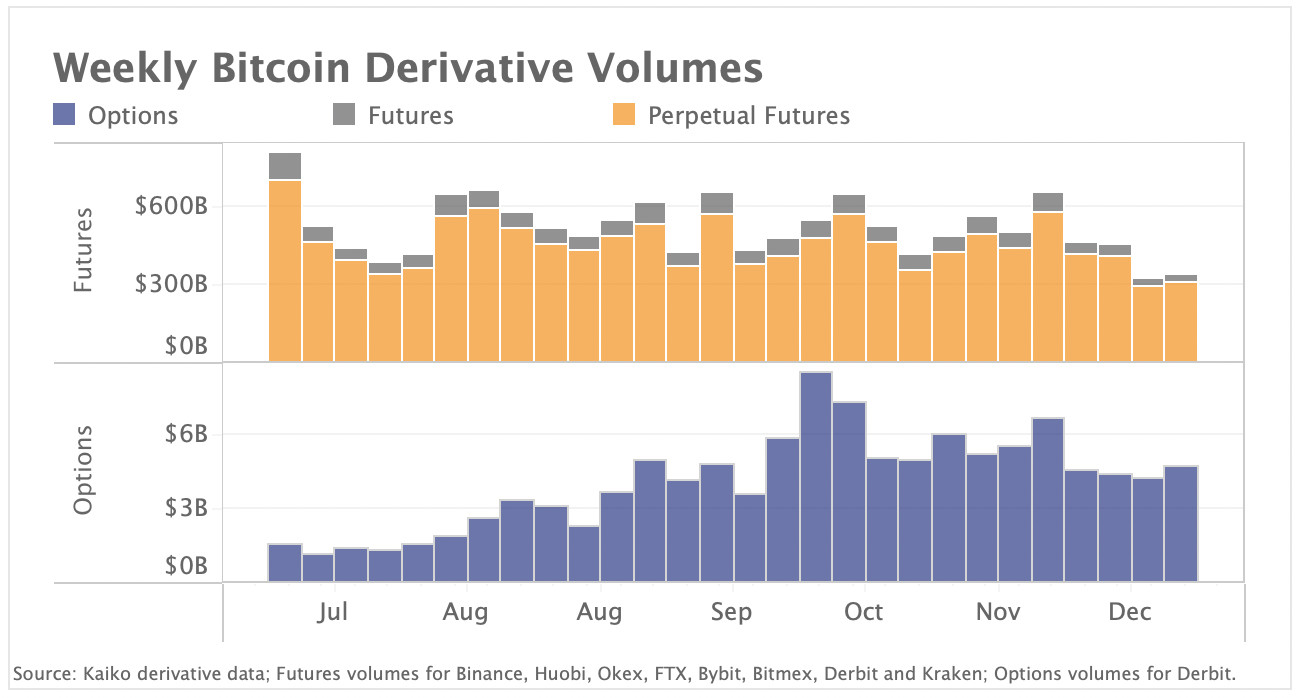
Bitcoin option trade volumes have increased sharply since this summer, in contrast to volumes for futures and perpetual futures which have undergone a slight decline. Above, we chart BTC futures volumes aggregated across the leading derivatives exchanges alongside options volumes on Deribit, which today accounts for +90% of the total options market. We observe that futures volumes declined sharply last month with the average weekly volume more than halving between November and December. Perpetual futures—which account for over 80% of total Bitcoin derivatives volumes— also decreased albeit at a slower pace. However, BTC option volumes remained significantly higher than during the summer bear market with call volumes (bullish bets) accounting for 60% in total trades made in December.
Bitcoin has highest correlation with equities since July 2020
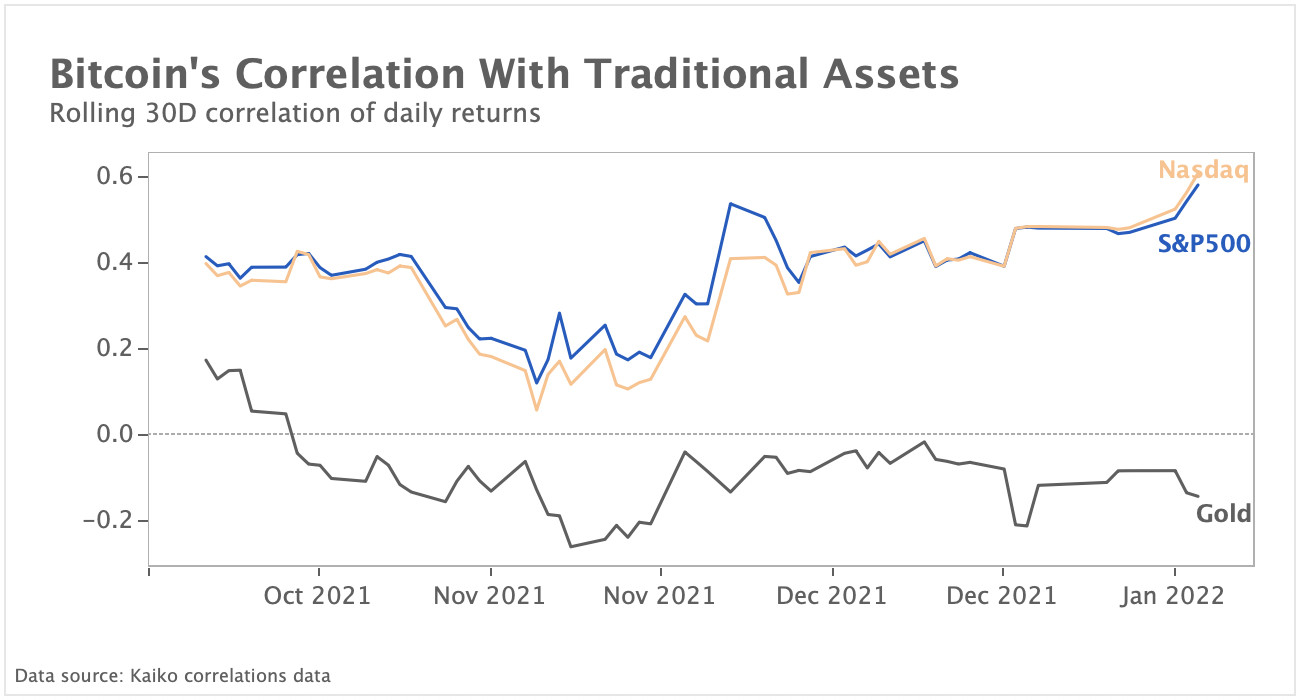
The Federal Reserve's December meeting had a strong impact on global financial markets, with traders reacting swiftly to the prospect of monetary tightening. During the volatility, Bitcoin behaved strongly like a risk asset and its correlation with the Nasdaq and S&P 500 equity indices jumped to its highest level in more than a year, at .61 and .58 respectively. On the other hand, Bitcoin's correlation with safe haven gold has remained negative since September.
Despite the risk asset sell-off, U.S. Treasury Yields hit multi-month highs last week. Below, we chart the 2, 10 and 30-year U.S. Treasury yields, which are considered safe havens.
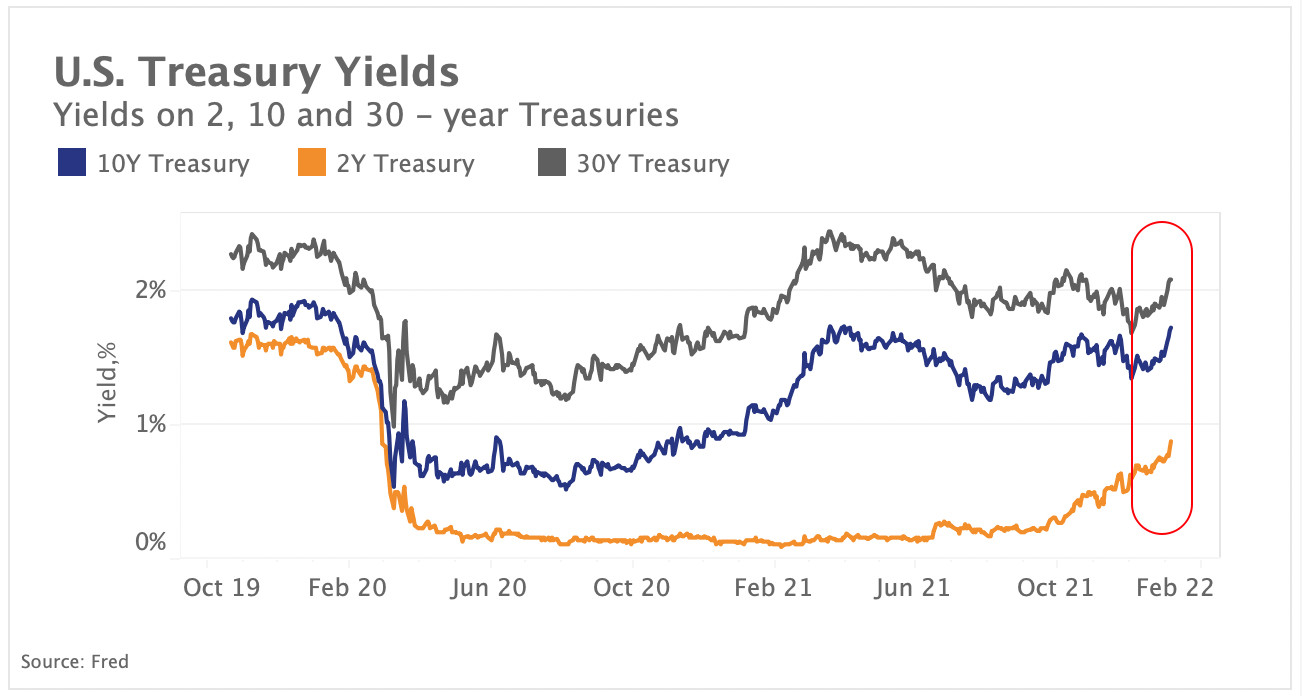
We observe that yields, which move inversely to bond prices, have mostly been rising throughout December despite jitters around the potential impact of the Omicron Covid variant on growth. The trend is linked to high inflation, which have caused real (inflation-adjusted) bond yields to remain negative. Overall, the tightening of financial conditions is expected to negatively impact risk assets such as equities and crypto as they become less attractive than safe-haven bonds.
Volatility takes a toll on annual crypto returns
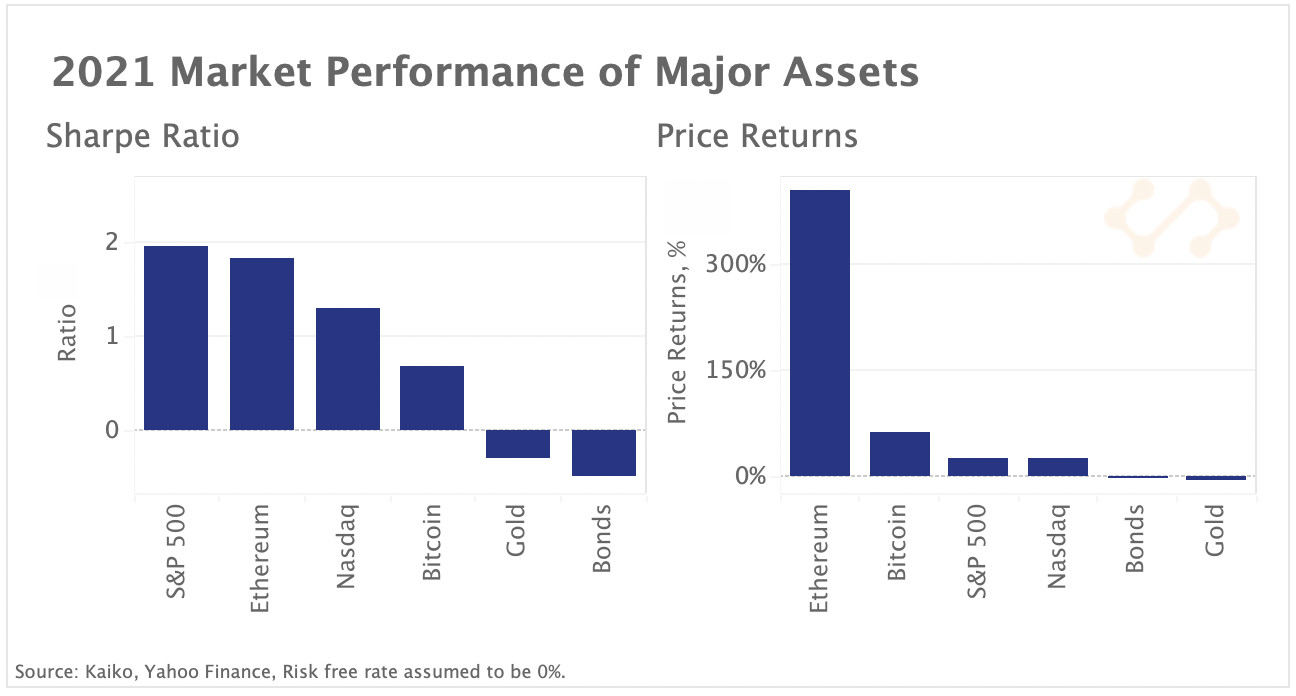
Despite the market downturn, annual crypto returns were strong with BTC and ETH gaining 64% and 404% respectively. U.S. equities also had a stellar year registering robust profit margins despite soaring inflation. While crypto assets exhibit the strongest returns in absolute terms, equities performed better in risk adjusted terms. Above we chart total annual returns and the Sharpe Ratio (risk-adjusted returns) for major assets. The S&P 500 and ETH were the best performers when taking volatility into account while gold and bonds were the worst performers.
Volatility is expected to remain present throughout 2022 as the withdrawal of pandemic-era monetary stimulus disrupts markets, especially for riskier assets. Below we chart the Fed’s balance sheet alongside the S&P 500 implied volatility as measured by the VIX Index, to get an idea of how monetary policy has affected equities.
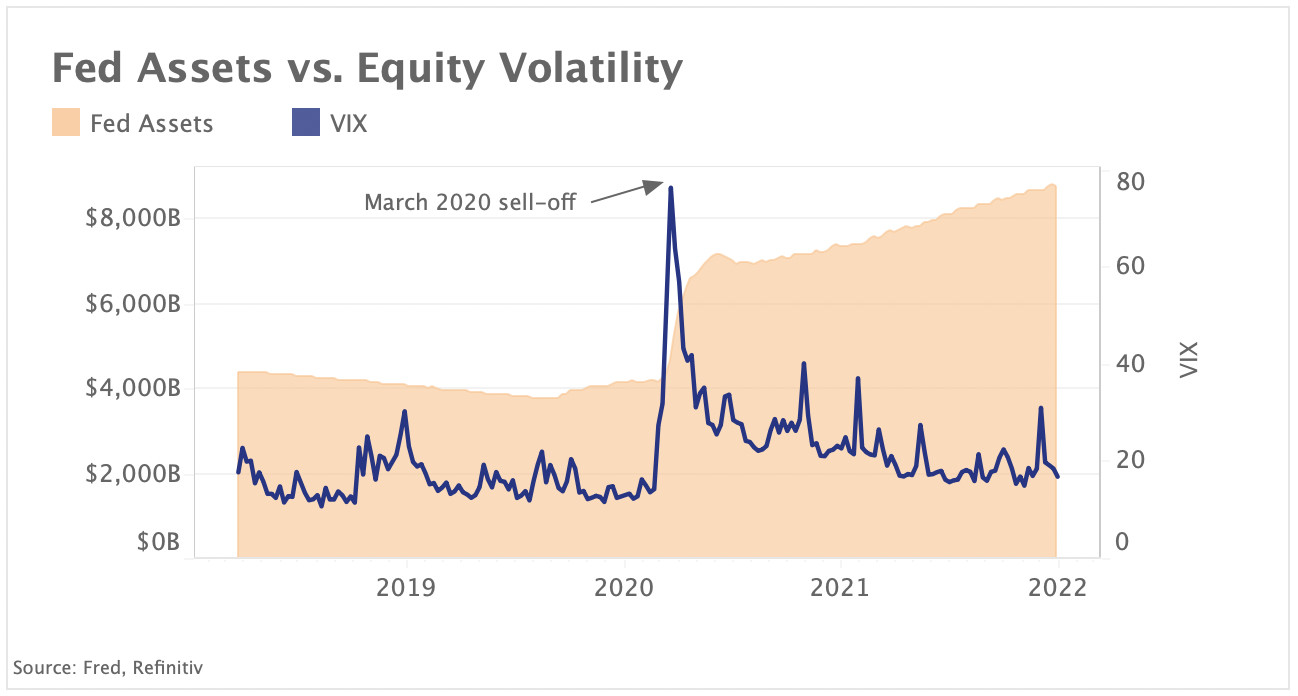
We observe that volatility and the Fed's balance sheet have been moving in the opposite direction with the VIX declining significantly since the March 2020 market crash (and shortest recession on record) while the Fed’s balance sheet has more than doubled exceeding $8.3T. Bitcoin has been strongly correlated with equity markets sell-offs over the past months and we can expect global financial trends to increasingly influence crypto market sentiment.


