
A summarizing review of what has been happening at the crypto markets of the past week. A look at trending sectors, liquidity, volatility, spreads and more. The weekly report in cooperation with market data provider Kaiko.
The last 7 days in cryptocurrency markets:
- Price Movements: The Ethereum-to-Bitcoin price ratio reached its highest level since 2018.
- Volume Dynamics: Play-to-earn tokens are attracting huge levels of investment on Binance.
- Order Book Liquidity: Market depth for ETH-USD markets is on a downward trend.
- Derivatives: Ethereum options volumes recently broke all time highs while spot volumes have remained flat.
- Macro Trends: Global inflation is on the rise.
Inflation is starting to show its face
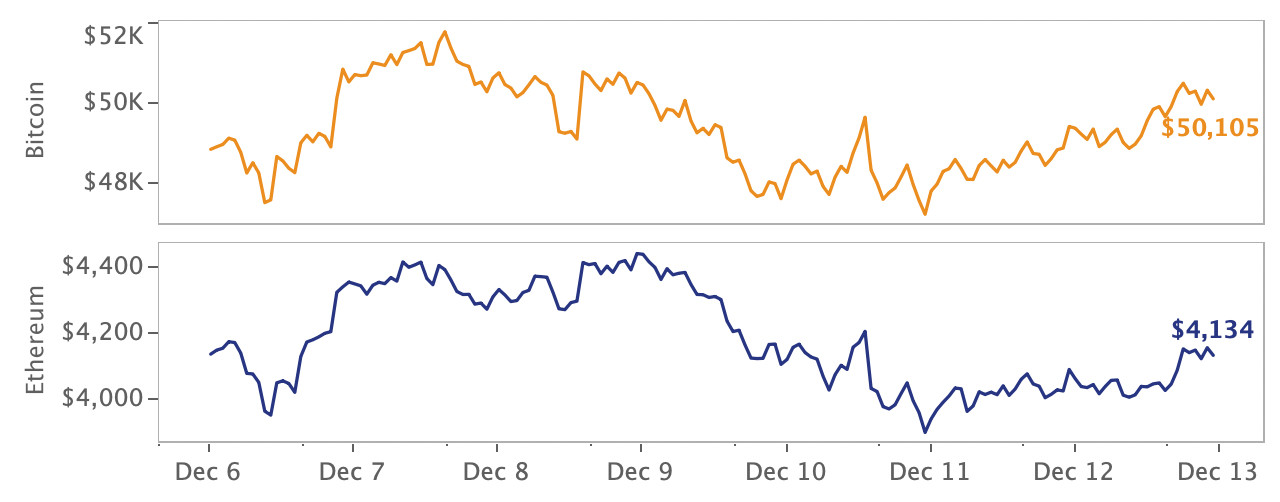
On Friday, the U.S. Bureau of Labor Statistics released highly-anticipated inflation data revealing the largest year-over-year annualized rate since the 1980's. Traditional markets didn't have a strong reaction before Friday's close, but Bitcoin experienced a rapid drop and as of Monday morning now trading near the $48k price level, contrary to its perception as an inflation-hedge. Meanwhile, Ethereum is proving far more resilient to macro headwinds along with its Layer 1 competition. In other news, crypto executives headed to Washington for a marathon hearing in front of Congress, Visa formed a crypto advisory unit, and FTX.US is getting serious about regulated derivatives.
ETH-BTC ratio breaks multi-year highs
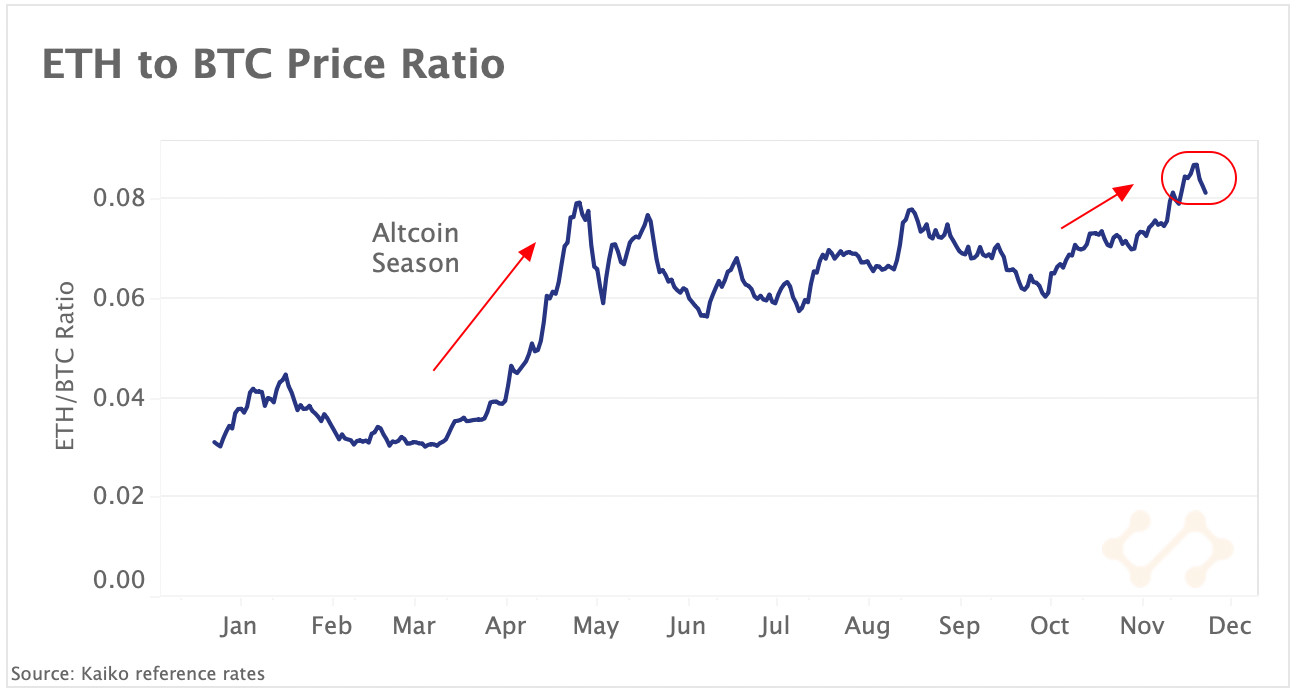
Ethereum has outperformed Bitcoin over the past couple months and is showing resilience despite rising macro uncertainty. While Bitcoin is almost 30% below its all-time high of $69k, Ethereum is down just 10% and continues to consistently trade above the psychological level of $4k. We chart the Ethereum-to-Bitcoin price ratio which can be used as an indicator of Bitcoin's dominance relative to altcoin markets and has historically served as a gauge for investor sentiment. When the ratio increases, it suggests investors are rotating funds into Ethereum and altcoin markets, and vice versa. Since the end of October, the ratio has been on a steady upward trend and recently topped its highest level since 2018. However, the increase has been a lot more gradual than during the March to May altcoin rally.
Ether becoming deflationary
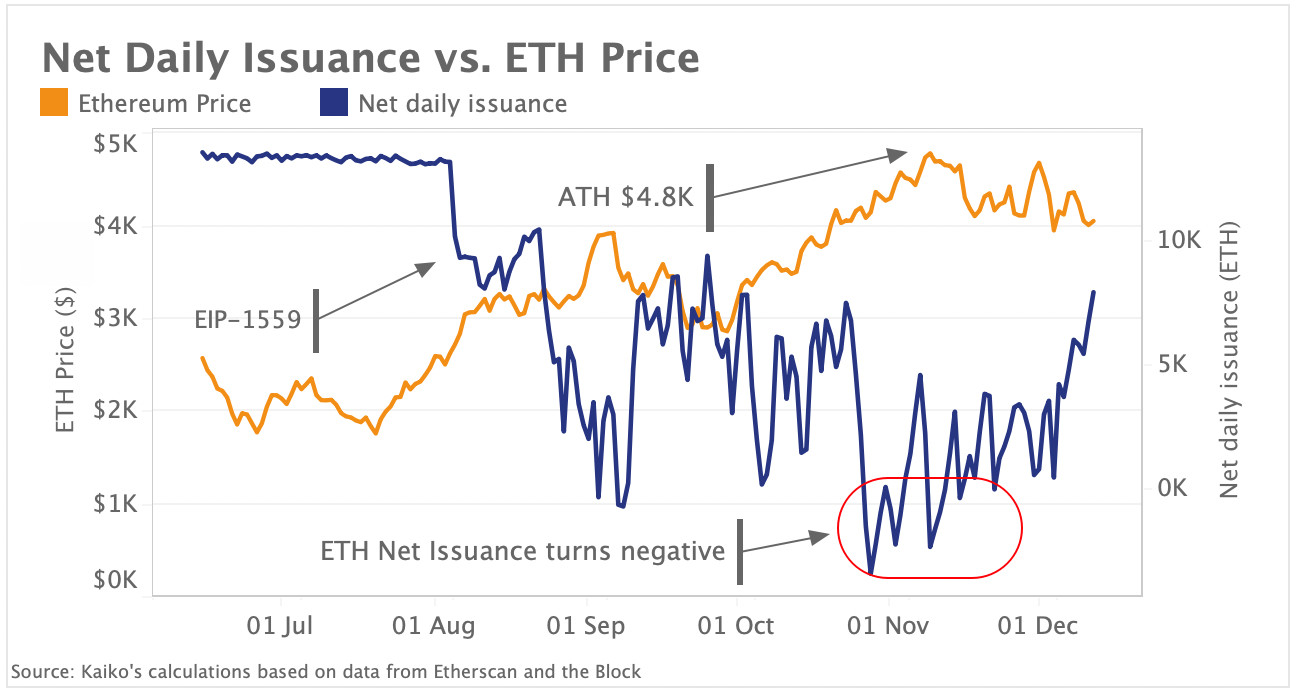
While it is difficult to assign a single reason for Ethereum's resilient performance, one contributing factor could be the network's new fee-burning mechanism, which takes a portion of Ethereum permanently out of circulation. Above, we chart the net daily amount of newly issued ETH, which is calculated by subtracting the amount of ETH burned from total issuance.
Since August, Ethereum's daily net issuance has dropped sharply, and briefly turned negative in early November as Ethereum hit several all-time highs. At the same time, demand for ETH spiked as NFTs soared in popularity, which combined with slower supply growth likely put additional upward pressure on prices. Over 1 million ETH has been burned since the upgrade at a total value nearing $4bn, causing the YTD issuance rate to fall from 4.1% to 2.9%. A rise in staking on DeFi protocols and ETH 2.0 has also taken ETH out of circulation, which could be creating an imbalance in supply and demand.
Layer 1 competitors
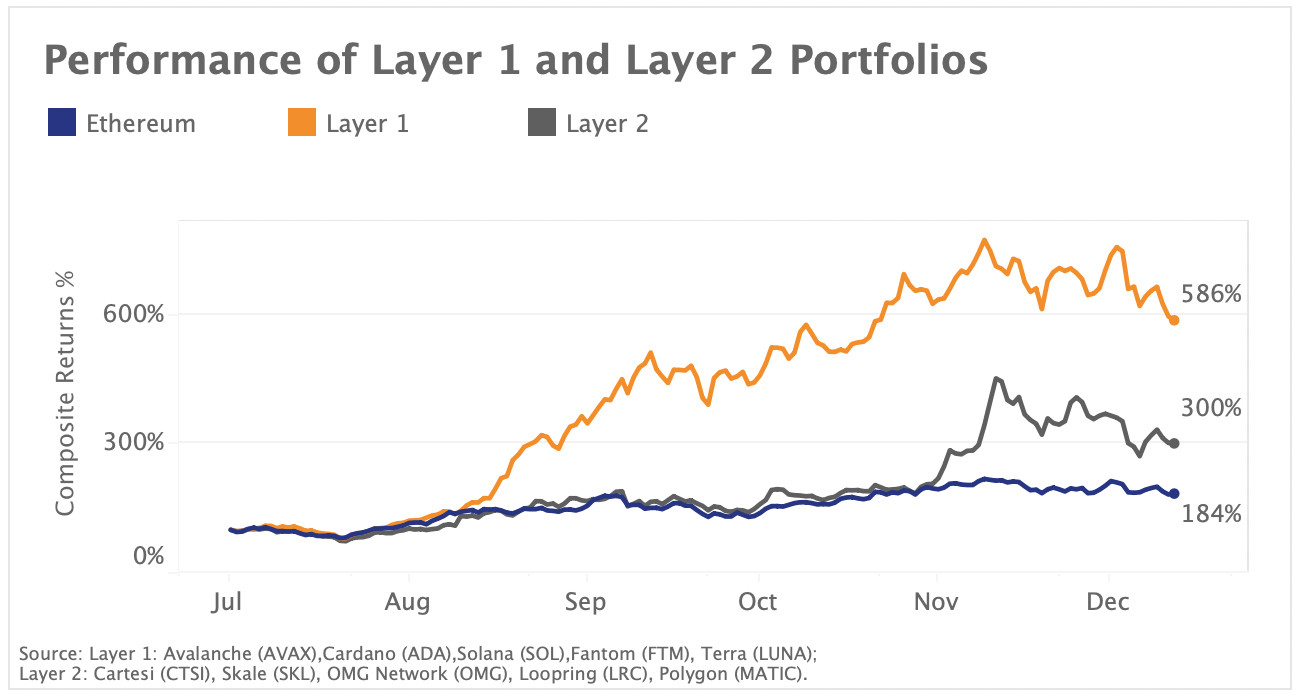
Despite Ethereum's resilience, the networks scalability concerns are driving adoption of alternate Layer 1 blockchains and Layer 2 scaling solutions. Above, we chart a hypothetical Layer 1 and 2 portfolio comprising some of the top assets in each category.
Layer 1 protocols are alternate blockchain networks with similar features as the Ethereum network, but without the high transaction fees and low throughput (for now). Layer 2 protocols are scaling services for the Ethereum blockchain designed to process transactions off-chain, which could solve major scalability concerns of the underlying network. To understand investor sentiment around each possible category of scaling solution, we built multi-asset portfolios representing L1s and L2s. We observe that our L1 portfolio has rallied by over 586% and L2s by 300% since the start of Q3, eclipsing Ethereum's relatively paltry 184% returns in a sign that investors are most bullish about alternate blockchain networks.
Play-to-earn token trade volume soars
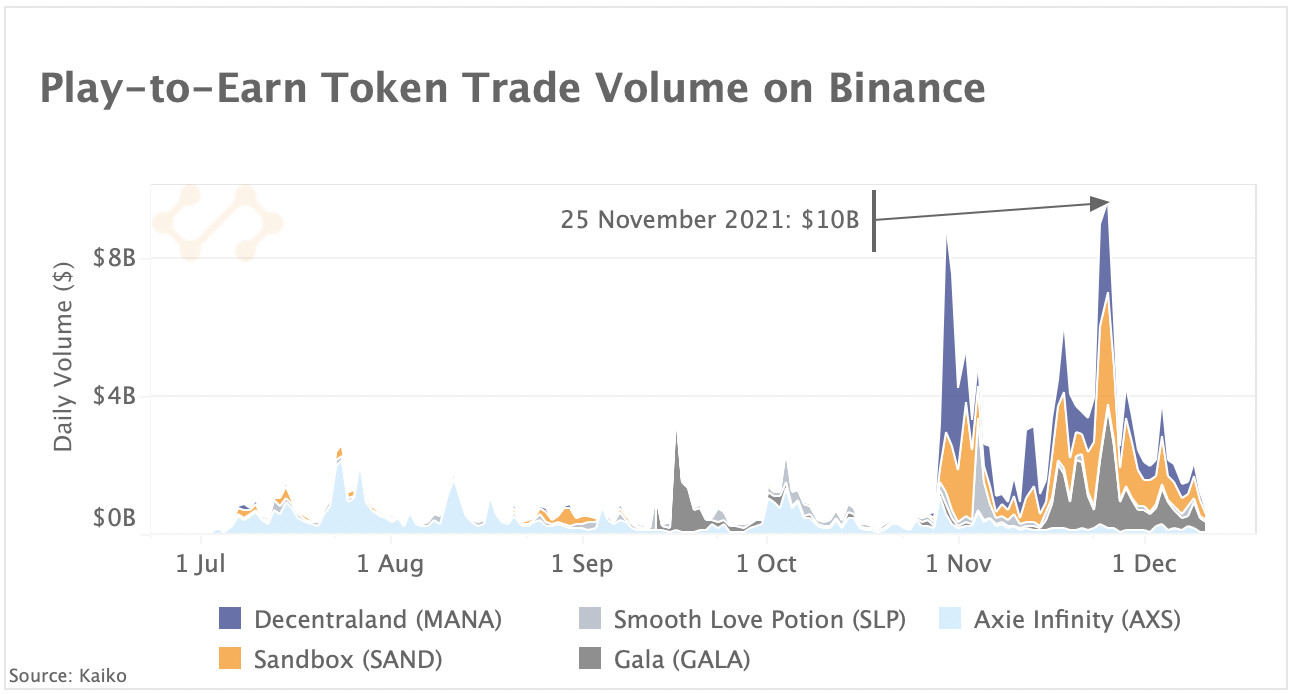
Play-to-earn (P2E) games such as Axie Infinity, the Sandbox and Decentraland have soared in popularity over the past few months along with mainstream enthusiasm for the metaverse. P2E is a category of gaming that lets players earn rewards, usually in the form of an in-game token that can then be traded on exchanges. Above, we chart daily trade volume on Binance for the five largest P2E tokens by market capitalization since the start of Q3. Volumes peaked in November at nearly $10bn, but have dropped sharply into December.
Historically, Axie Infinity has been the main driver of P2E volumes as its governance token AXS gained +1,900% in a few short months. However, the Sandbox and Decentraland have since gained the bulk of investor attention following Facebook’s rebrand as Meta, which was a bullish signal for this genre of gaming. Overall, P2E games have emerged as a significant source of revenue for pandemic-hit workers in countries such as the Philippines and more recently, inflation-ridden Venezuela.
Ethereum options volumes at all time highs
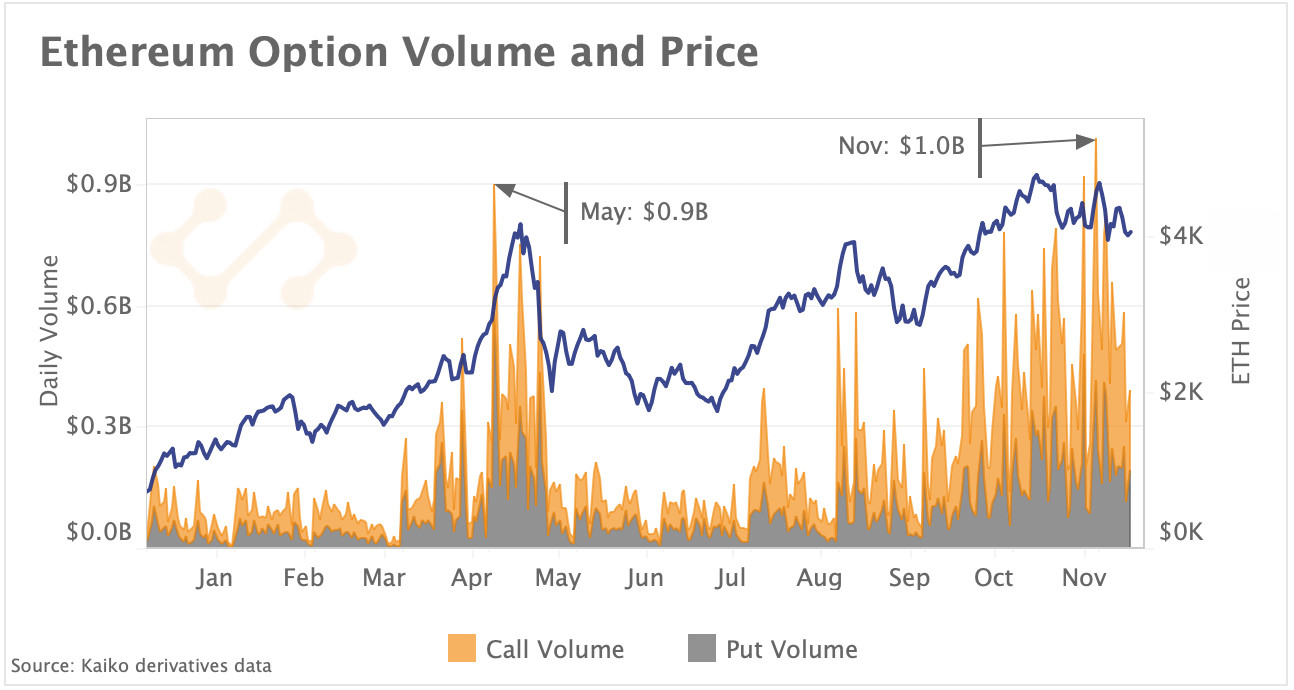
Ethereum’s daily option trade volume hit a yearly high at end-November moving in stark contrast to spot volumes which remained relatively flat over the same period. Above, we chart the put and call trade volume on Deribit, the largest cryptocurrency options market, along with Ethereum’s price. We observe that daily trade volume has increased significantly over the past two months, totalling nearly $1bn on Nov 30, well above its previous high reached on May 3. Options are a type of derivatives contract giving the right - but not the obligation - to purchase the underlying asset at a fixed price before or at the date of expiry.
Typically, traders buy call options (the right to buy) to bet on price increases and seek protection via puts (the right to sell) if they foresee price declines. The market share of call volume has also been rising since mid-November hovering around 60% of total volume, suggesting higher demand for calls (or bullish bets). This ratio dropped off over the weekend, and today volumes are near 50-50.
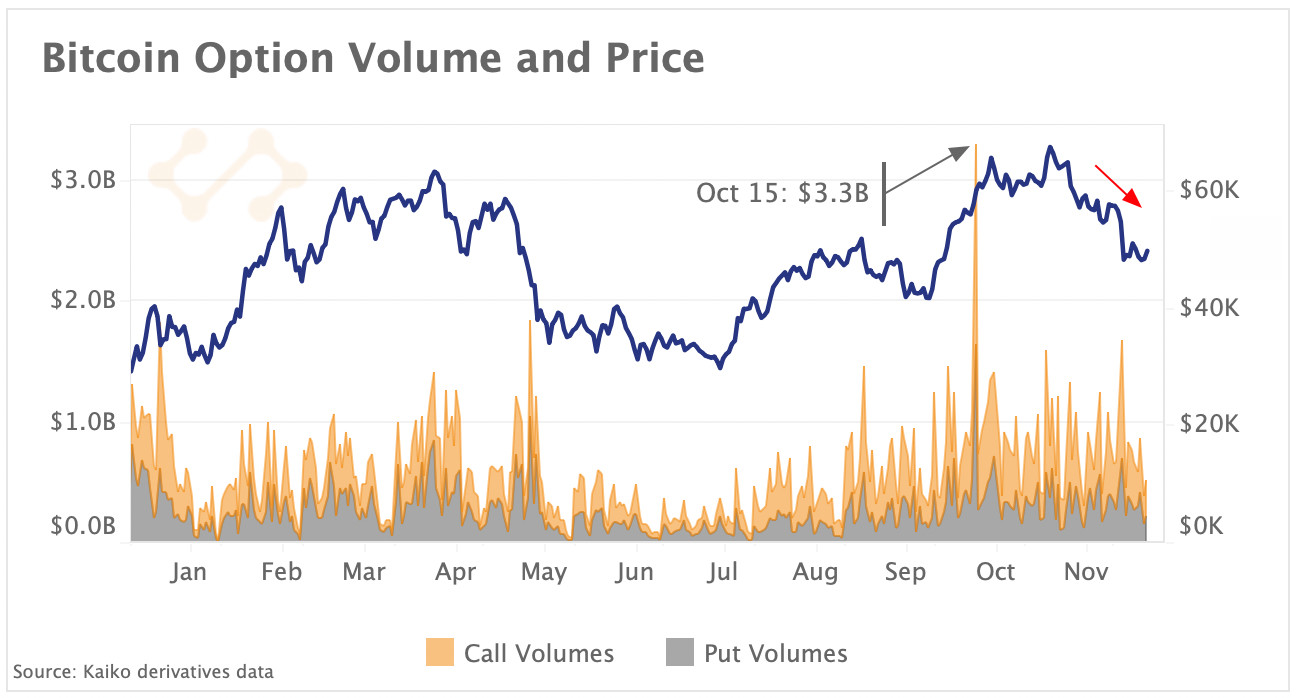
In contrast, Bitcoin option volumes have remained relatively flat over the past few weeks, hovering between $0.6 and $0.8bn, after spiking to a yearly high days before the launch of the first Bitcoin-backed futures ETF in the U.S. on Oct 18. Put and call volumes have been relatively equal suggesting a neutral trend going forward.
Inflation is surging
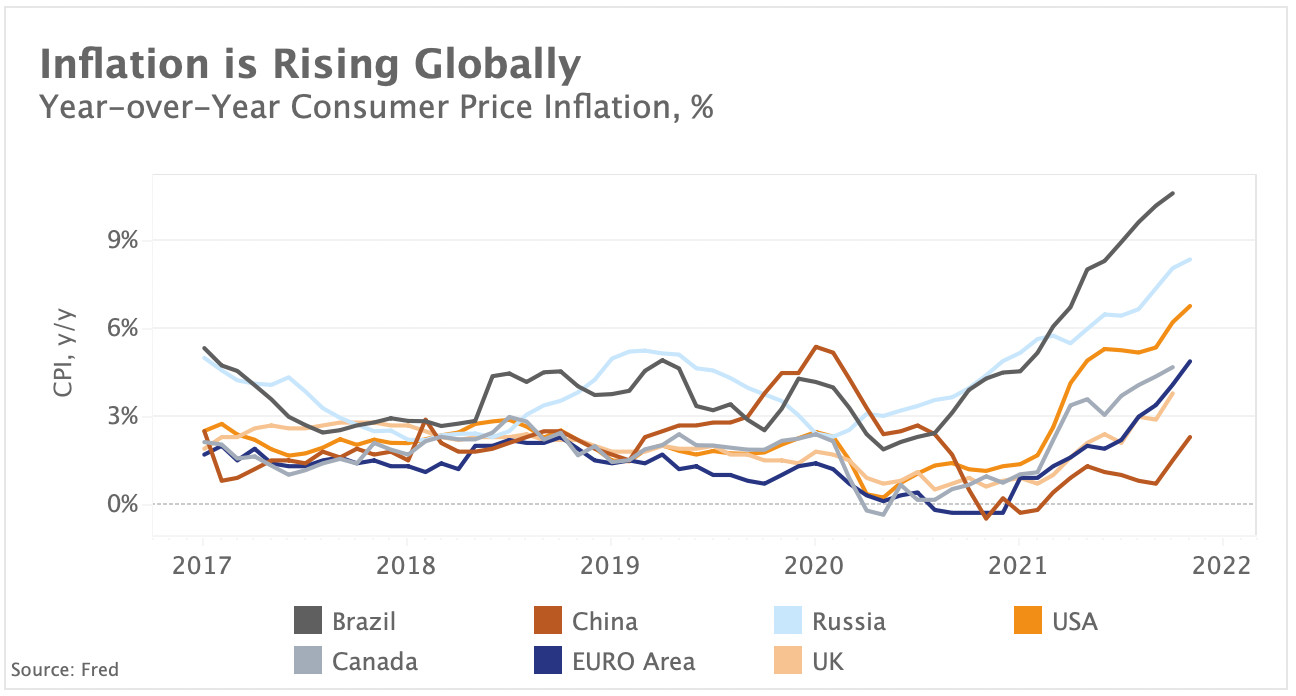
Inflation has increased globally over the past year as a rebound in demand and supply bottlenecks pushed prices up. Above, we chart the Consumer Price Index (CPI) year-over-year change in major developed and emerging markets since 2017. We observe that prices declined over the course of 2020 due to lockdown measures introduced to curb the spread of COVID. However, as economies reopened, prices began climbing. Emerging markets such as Brazil and Russia experienced significantly stronger price growth than developed markets and have aggressively risen interest rates over the past few months in response. In developed economies, the Euro Area CPI hit its highest level since the creation of the euro while U.S. inflation accelerated to a nearly four decade high.
Major U.S. equities have been volatile over the past few weeks while crypto assets have experienced a sharp pullback in response to a growing risk-off environment. Overall, Bitcoin's correlation with traditional equities has been on the rise while its correlation with gold has been mostly negative.
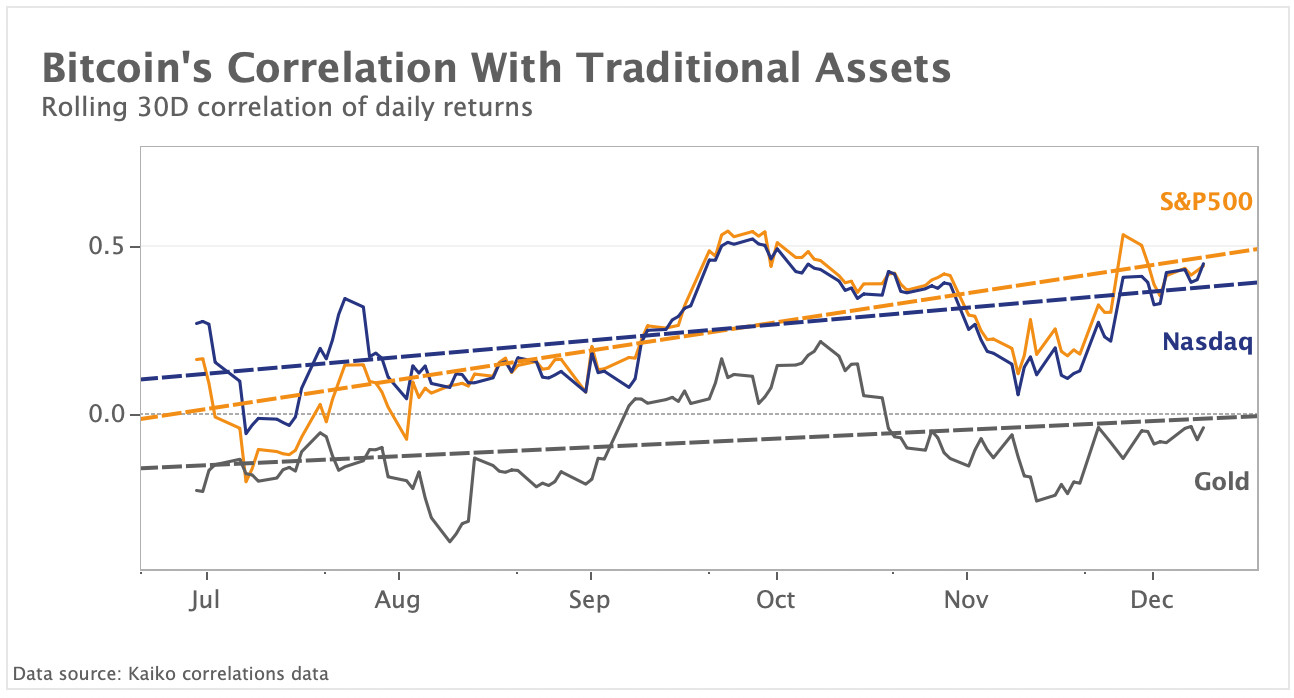
Risk-off sentiment seems to be driving similar investor responses for equities and crypto, disrupting Bitcoin's narrative as a safe haven and inflation hedge. All eyes are now on the U.S. central bank at their December FOMC meeting, where they are expected to discuss the pace of tapering.


