

Bitcoin/USD daily basis
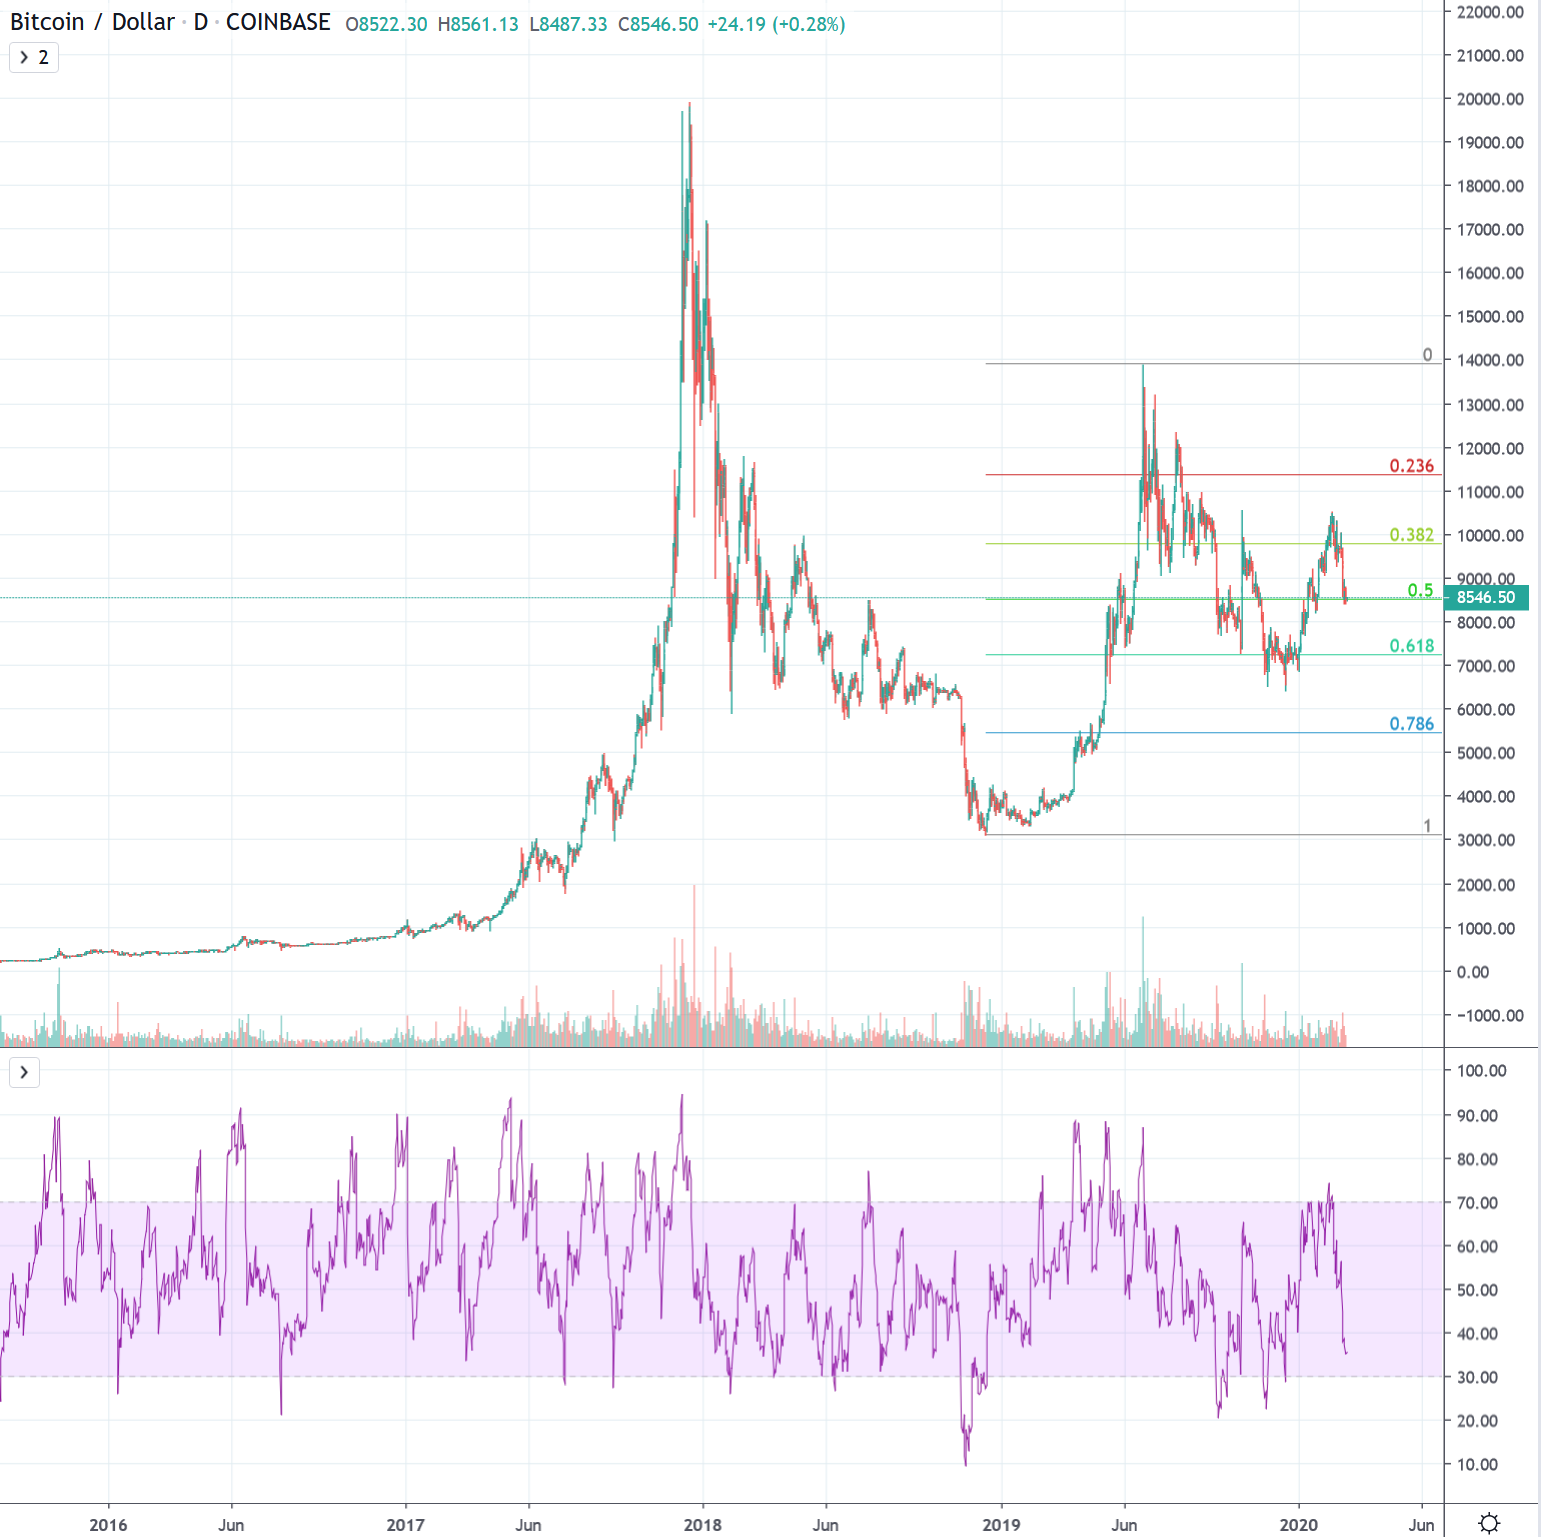
Bitcoin/USD – Series of lower highs leads to setback
The bitcoin share price moved further away from its recently reached new highs of around USD 10,500 this reporting week, as it did in the previous week. From Sunday onwards, the price traded downwards with lower highs and lows. On Monday, a further lower high, since the high on the 13th of February, was marked at just under USD 10,000. This movement was followed on Tuesday by a test of initial support at around USD 9,500. Already on Wednesday, this was broken with a massive red candle, which closed near a daily low of 8’500 USD. From Thursday onwards, smaller daily movements followed in the second half of the week and thus smaller but still red candles which had their daily lows around the 8’500 support zone.
Continued rejection of the resistance zones between 10’500 and 11’000 USD
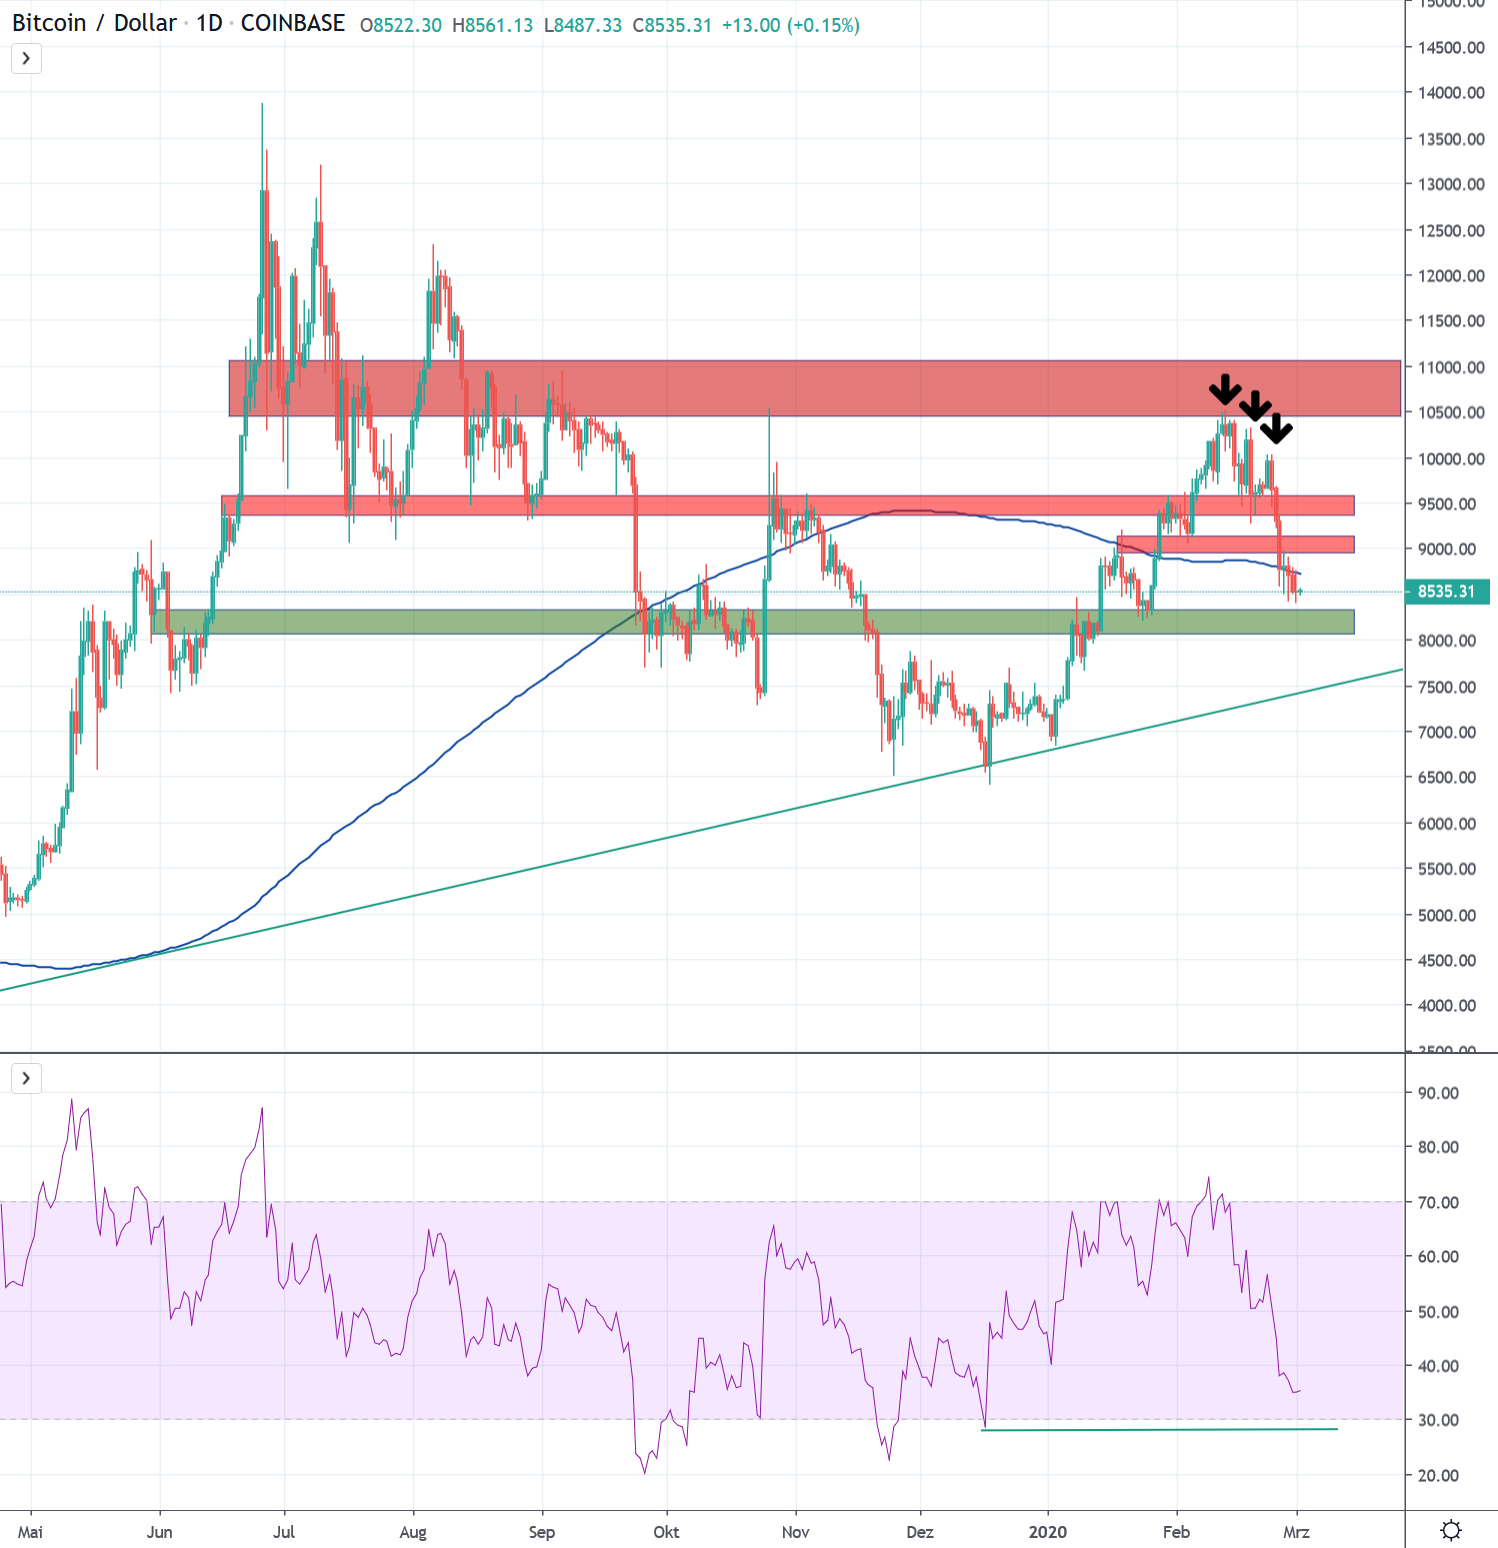
The first sustained attempt to break through the historically strong upward resistance between USD 10,500 and 11,000 failed. This resistance zone is strongly influenced by earlier price movements (red). Already in October, this zone served as a barrier for the two-day massive upward movement in late October. The rejection of the previous week was consistently continued. This first became apparent with consistently lower highs and the relatively fast break of the support zone around USD 9,500 which had been created before. This capitulation put a harsh end to the chances of an early re-testing of the highs. As a result, the current consolidation phase is at the lower support level of around USD 8,500, just below the 200-day average line.
Further support is found at around 8’000 USD (green). Finally, an upward-trendline just below the 8’000 USD level is evident. However, from a technical point of view, a consolidation above the 200-day-line as well as above the support zone of 8’200 USD should take place in order not to further strain the picture of the latest upward-trend since January.
Macro: First strong rejection of the recent uptrend
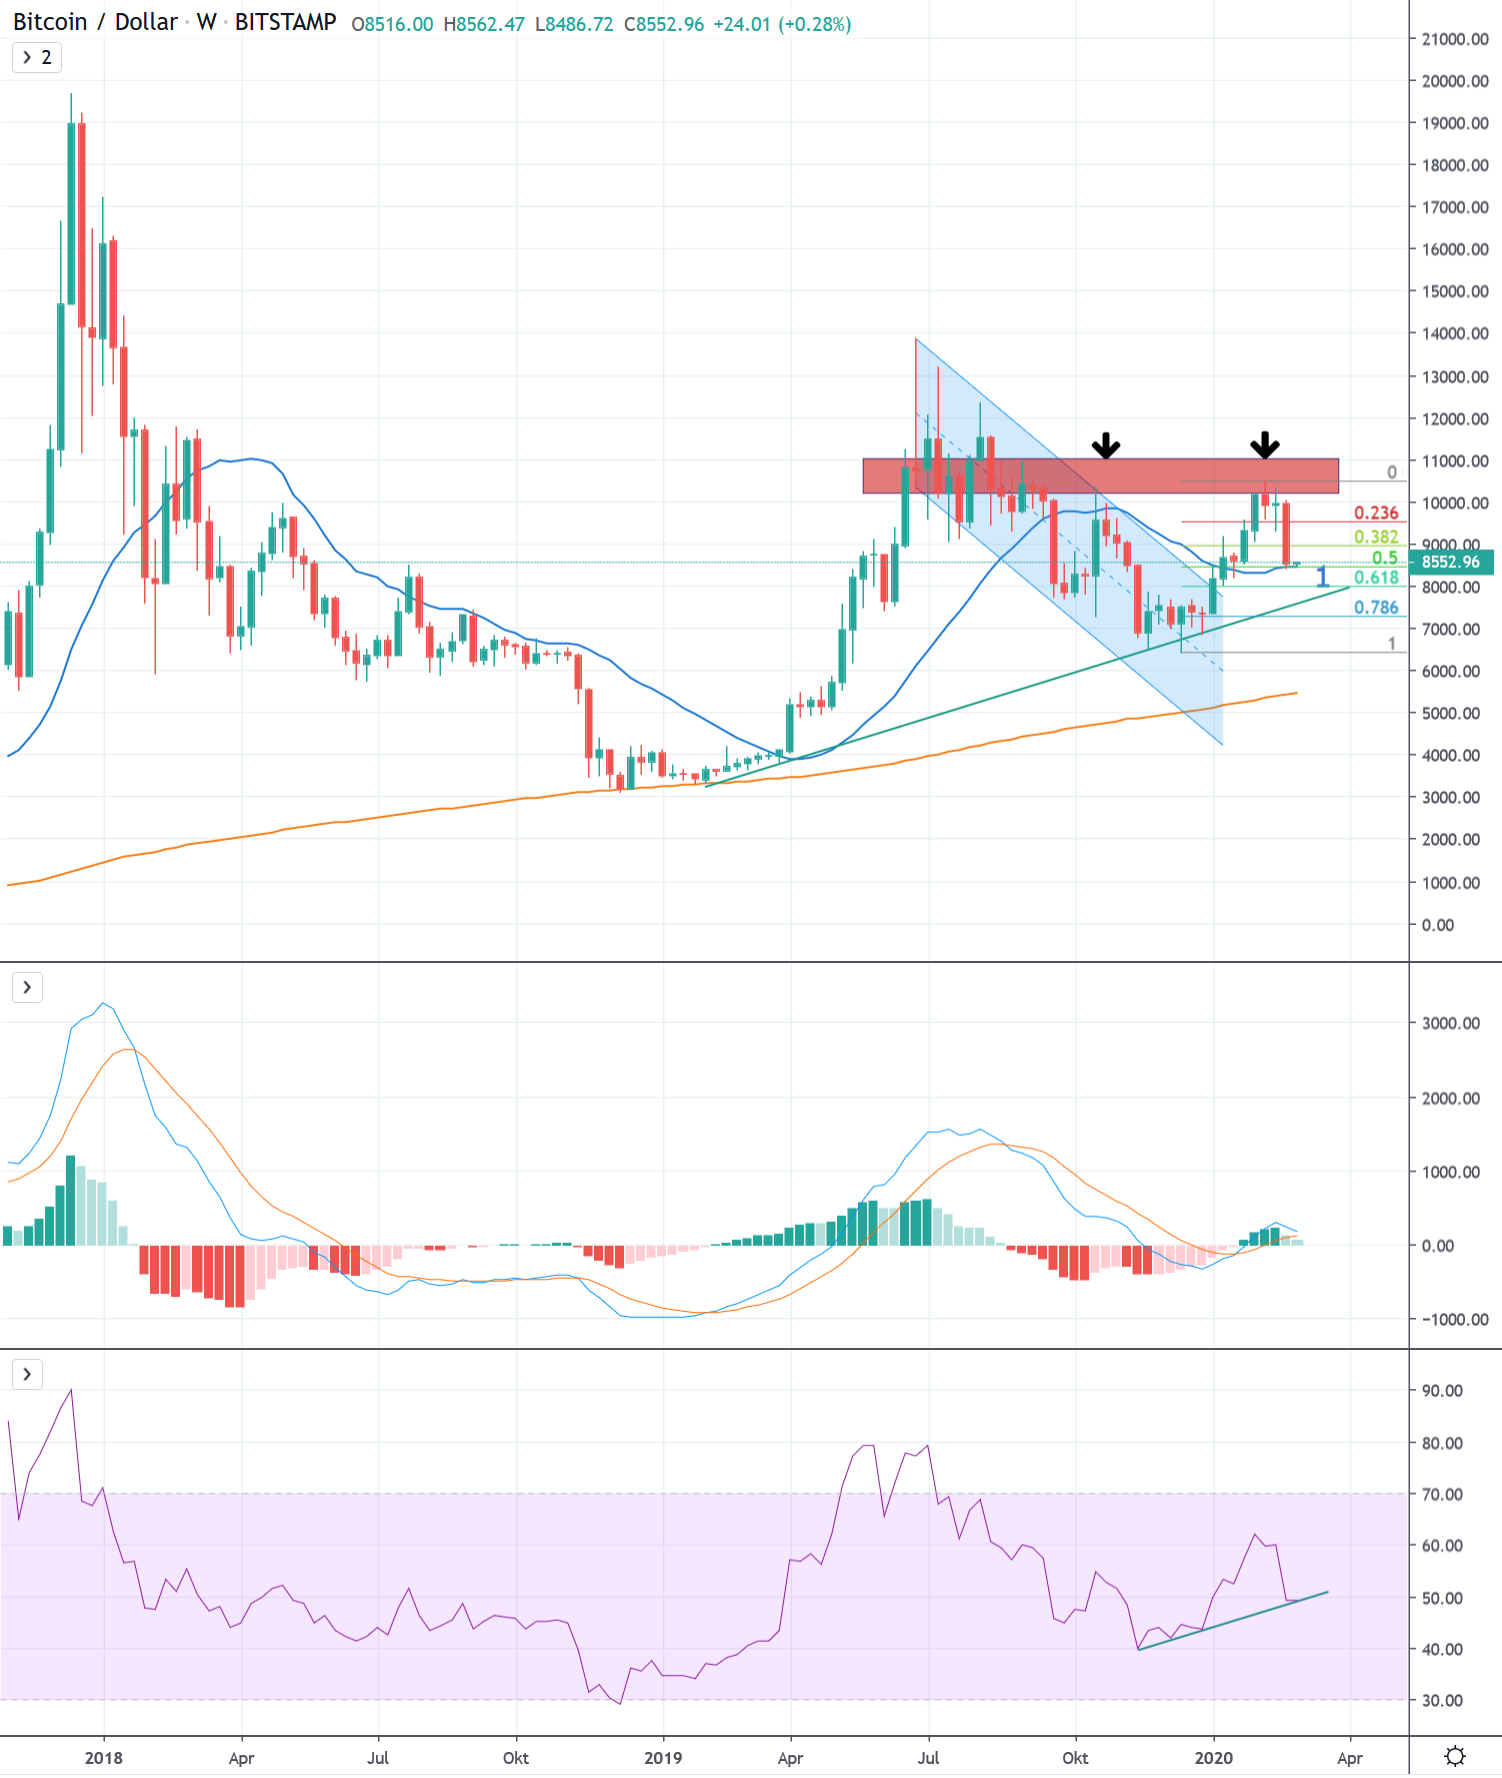
The series of lower highs and lows prevailing since June 2019 has been interrupted since January 2020. In order to improve the technical picture, a higher high above the trend defining candle of October 2019 (arrows) is still missing. The most recent attempt failed. Thus, a confirmation of a trend reversal since June 2019 is still pending. The rejection of the resistance zone (red) was strong. The setback brought the Bitcoin price back to the 21-week average line at 8’500 USD. Further support can be seen in the 0.618 Fibonacci point of the latest uptrend as well as in a rising trend line of the lows since February 2019, at around 8’000 USD.
In the coming weeks, the credibility of the latest uptrend will have to prove itself. As long as the price remains above the 21-week average line (1), this is still no shipwreck for the latest structure. Currently, the current zone at 8’500 serves as support from previous price movements. A renewed testing of the support below USD 7,300 would negate the entire upward movement and massively reduce the chances of a renewed testing of the highs above USD 10,500.
Only a breaching of the resistance zones between USD 10,500 and USD 11,000 in the coming weeks would validate a sustained break in the prevailing downtrend and could lay the foundation for another bull phase lasting several months.