
Bitcoin/USD daily basis
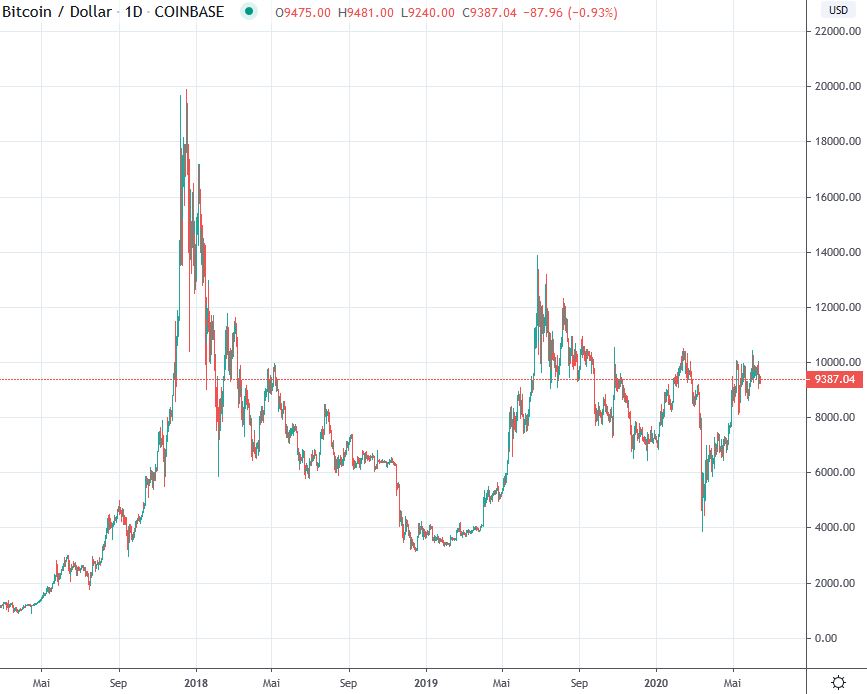
Bitcoin USD - The situation is coming to a head
The reporting week was characterized by low daily trading margins. For most of the time, the share price moved in a range between USD 9,300 and USD 9,700. Only on Thursday was there higher volatility. When Bitcoin briefly crossed the USD 10,000 mark again for a short time the previous day, a correction followed which took the price to just under USD 9,000. At the end of the day and on the following days, however, the price was again above USD 9,000, with an average of around USD 9,400. The trend of higher lows continued, while resistance remained at 10,000.
Advancing to well-known resistances in micro and macro trends
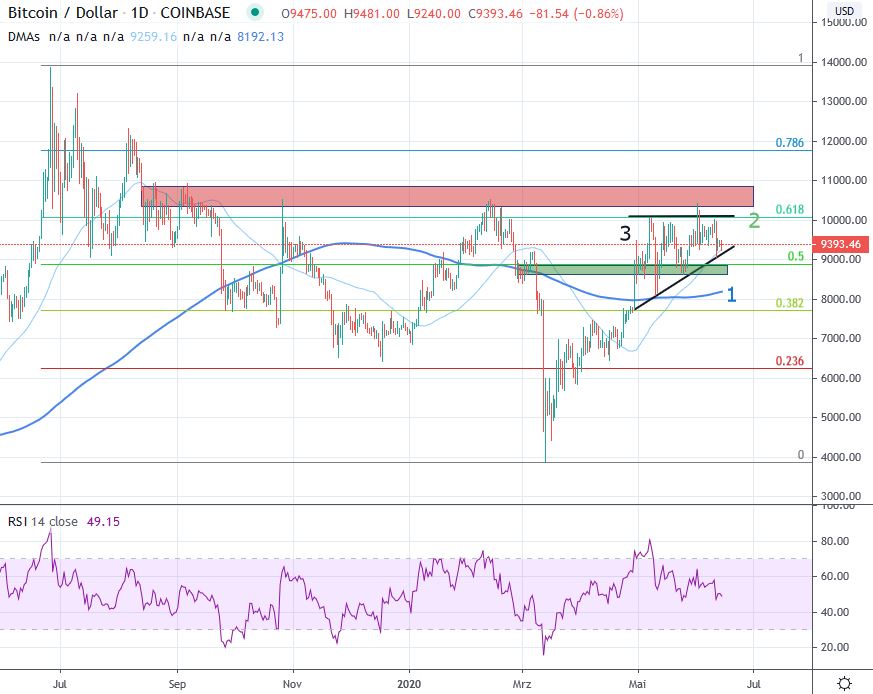
A veritable countermovement established itself after the price slump of mid-March. This led up to the resistance zones around USD 10,000 (red). This was followed by a first rejection, which brought the price back to the 200-day average (1), just over USD 8,000. In the meantime, further attempts to climb to the area beyond the USD 10,000 level have failed. Ignoring the intraday outliers of 10 and 11 May, Bitcoin has been trading within the USD 8,500 - USD 10,000 zone for a good month. A tendency towards higher lows is discernible here.
Due to the temporary failure at the historical resistance zone, a rising triangle (3) is formed, which is basically positive. However, this also brings with it the characteristic of expected strong price reactions when the formation is breached.
The resistance zone around USD 10,000 is interesting in several respects. On the one hand, this is where the 0.618 Fibonacci point (2) of the entire downward movement is located, which was heralded at the end of June 2019 just below USD 14,000. Secondly, the zone around USD 10,000 simultaneously functions as a confirmation of the still bearish trend of lower highs since December 2017 (see next section).
In order to maintain the recent positive picture in the daily interval, the trend of higher lows should at best be maintained. If this does not succeed, the support zone should not fall below USD 8,500 - 8,700 (green). The next support zone is the area just above 8'000 USD where the 200-day moving average (1) is located. The positive structure of the micro-trend since the March low is endangered with a renewed test of the zone 7'500 - 7'700 USD. The zone around 7'000 USD can serve as a last support before the confident structure suffers lasting damage.
Macro: On the threshold of a trend reversal
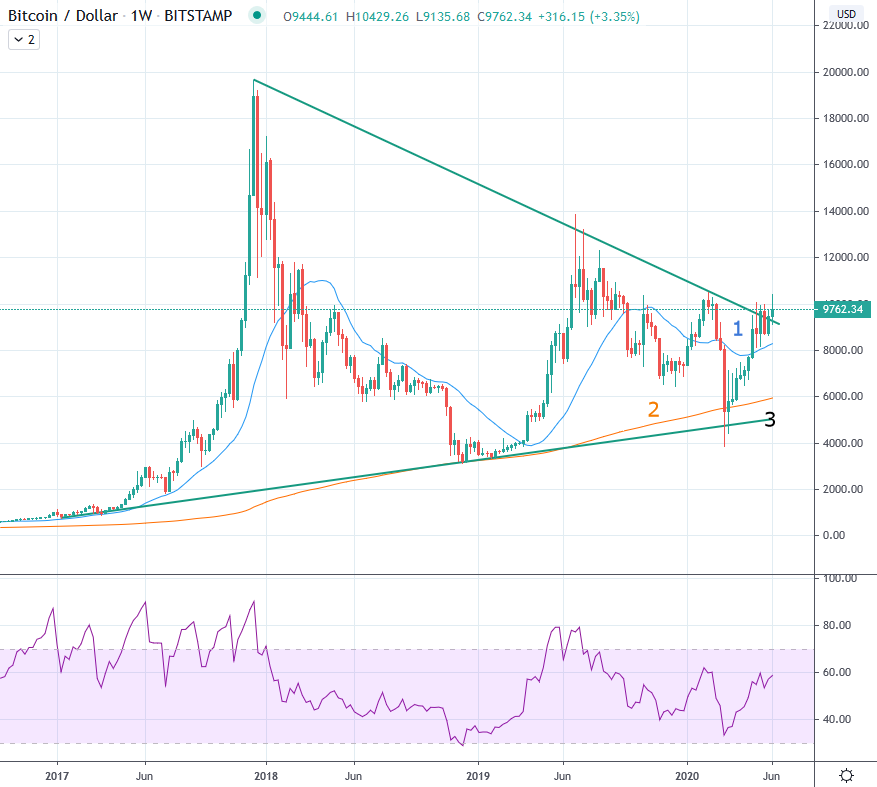
Bitcoin has so far failed to set a higher high in the weekly interval, which would have broken the prevailing bearish trend since December 2017. In its last attempt since the beginning of the year, the upward trend in the relevant zone at around USD 10,500 failed to establish itself.
The countermovement that began in mid-March after the sharp price correction brings the price once again to the trend line, which is the result of the lower highs since the end of 2017.
If the negative macro picture is to be broken, the tendency of lower highs since 2017 must be sustainably overcome. This should be legitimized with several weekly candles above the USD 10,000 mark in order to rule out false outbreaks such as those in July 2019. The current establishment in the new range looks sustainable and should take place in the coming weeks above the 8,400 - 8,700 USD zone, as well as above the 21-week average (1) in order not to cloud the new positive picture again.
If a renewed rejection to below the USD 7,000 zone were to occur, support in the lower range of the macro trend is expected from the 200-week average (2) at USD 5,900, which has never been breached since its inception, and from the trend line (3) of the respective lows of the upward trend since March 2017.
Disclaimer
All information in this publication is for general information purposes only. The information provided in this publication does not constitute investment advice and is not intended as such. This publication does not constitute an offer, recommendation or solicitation for an investment in any financial instrument including crypto currencies and the like and is not intended as an offer, recommendation or solicitation. The contents contained in the publication represent the personal opinion of the respective authors and are not suitable or intended as a basis for a decision.
Notice of risk
Investments and investments, especially in crypto-currencies, are generally associated with risk. The total loss of the invested capital cannot be excluded. Crypto-currencies are very volatile and can therefore be subject to extreme exchange rate fluctuations within a short period of time.

