
Bitcoin/USD daily basis
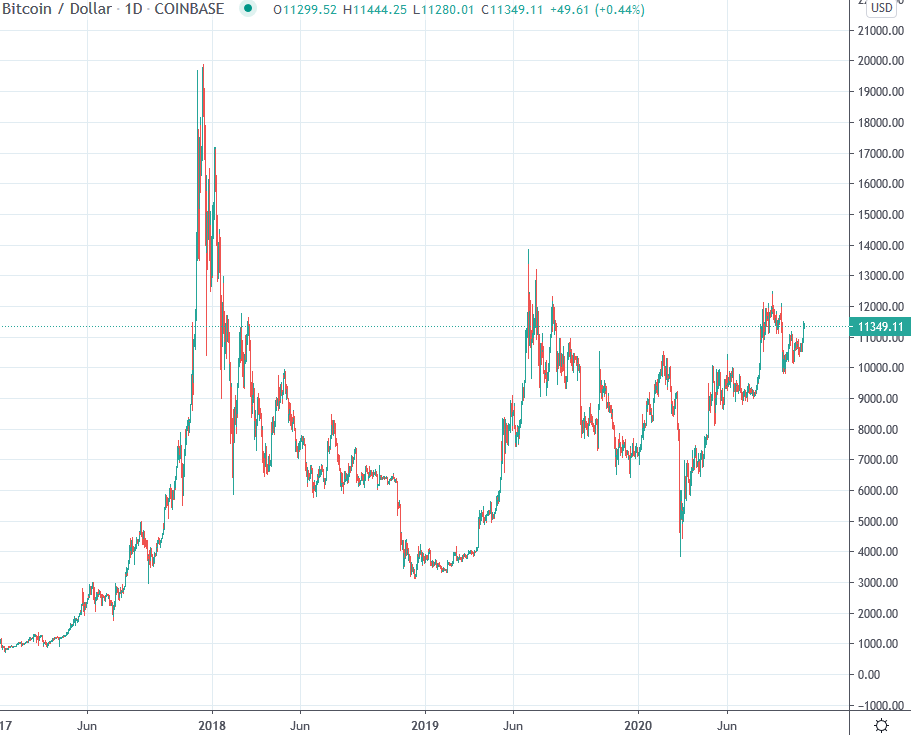
Bitcoin USD - From now on claim above 10'000 USD
At the beginning of the reporting week, a floor at around USD 10,500 was created. As a result; Bitcoin was able to reach USD 10,800 on Monday; and closed near the daily high. On Tuesday, levies led to a renewed test of the previously formed floor at USD 10,500. By the middle of the week, the floor formation manifested itself. On Thursday, this foundation was followed by a major rally to just under USD 11,000. On Friday, prices remained around the new mark, which gave the price a renewed boost the following day and led to a daily high of USD 11,500. The closing price on Saturday was only slightly lower at USD 11,300. Sunday's trading confirmed the new level with slightly higher prices.
Pushing to first resistances

Review daily interval
A veritable countermovement established itself after the price slump in mid-March. This led up to the resistance zones starting at USD 10,000. After a renewed rejection at the beginning of June, an almost two-month consolidation was observed. This was characterized by a series of higher daily lows and lower daily highs. The series of lower highs was broken on 22 July. This was followed on July 27 by a break through the resistance zone around USD 10,500, which has been established since August 2019 and which Bitcoin has already failed to break several times.
The resistance zone around USD 10,000 was interesting in several respects. On the one hand, the 0.618 Fibonacci point (1) of the entire downward movement, which was heralded at the end of June 2019 just below USD 14,000, is located here. On the other hand, the zone around $10,000 also served as a confirmation of the still bearish trend of lower highs since December 2017 (see next section). This zone now counts as a significant support (green).
Outlook
Bitcoin was able to establish itself above the newly created support in the USD 10,000 range. This zone serves as an important pillar of the positive trend. The breach of the upper trendline of the symmetrical triangle mentioned in the previous report led to a veritable upward movement during the reporting week. The movement just ended at the first resistances that formed between the end of July and the beginning of September (3). If this hurdle can be breached in the coming days and serve as support afterwards, the chances are good for an attack on the USD 12,000 mark.
The coming weeks will provide an indication of the strength of the recent rally. If the current resistances can be broken sustainably, there is nothing to prevent an attack of the last larger resistances above USD 12,000 (red). These are significant and from now on serve as an indicator on whether the market is serious about the recent trend reversal.
In case of a stronger setback, the USD 10'000 mark should still be observed. Should this support fall below USD 9,500, further support can be expected from trading activities from the end of April to mid/end July 2020. The 200 daily average is now located in this area (2). In such a scenario, a longer lasting consolidation in the range of USD 9'000 - 11'000 is expected.
Macro: Series of lower highs broken since end of 2017
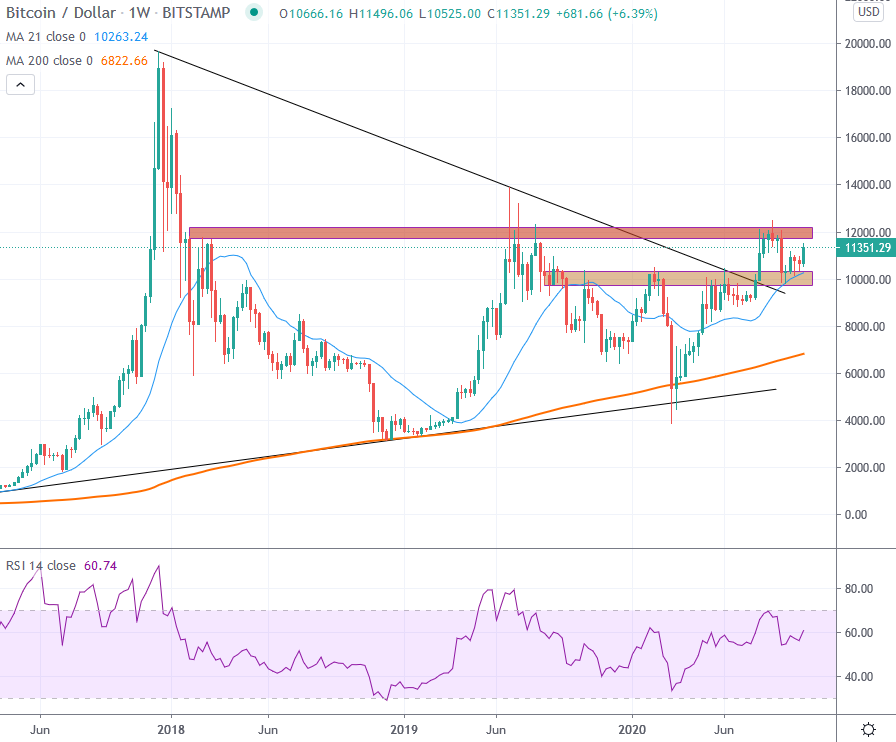
Bitcoin was able to set a higher high for the first time in the weekly interval, breaking the prevailing bearish trend since December 2017. The series of lower highs, which lasted for 135 weeks, was thus interrupted (marker).
In order to change the negative macro picture into a valid trend reversal, the breakout should be legitimized by several weekly candles above the USD 10'000 mark.
An establishment above USD 10'000, and a consistent conquering of the resistance around USD 12'000 over the next weeks/months speak to a legitimacy of the trend reversal. If the Bitcoin price can then consolidate above USD 12,000 again, the chances of an attack on the all-time high of USD 20,000 would certainly exist.
A drop in the price, which would bring the price back into the USD 9,500 range and below over several weeks, would damage the positive momentum and would argue for a longer-lasting consolidation.
Haftungsausschluss
Alle Angaben in dieser Publikation erfolgen ausschliesslich zu allgemeinen Informationszwecken. Die in dieser Publikation zur Verfügung gestellten Informationen stellen keine Anlageberatung dar und sind auch nicht als solche beabsichtigt. Diese Publikation stellt kein Angebot und keine Empfehlung oder Aufforderung für eine Anlage in ein Finanzinstrument einschliesslich Kryptowährungen und dergleichen dar und ist auch nicht als Angebot, Empfehlung oder Aufforderung beabsichtigt. Die in der Publikation enthaltenen Inhalte stellen die persönliche Meinung der jeweiligen Autoren dar und sind nicht als Entscheidungsgrundlage geeignet oder beabsichtigt.
Risikohinweis
Anlagen und Investitionen, insbesondere in Kryptowährungen, sind grundsätzlich mit Risiko verbunden. Der Totalverlust des eingesetzten Kapitals kann nicht ausgeschlossen werden. Kryptowährungen sind sehr volatil und können daher in kurzer Zeit extremen Kursschwanken ausgesetzt sein.

