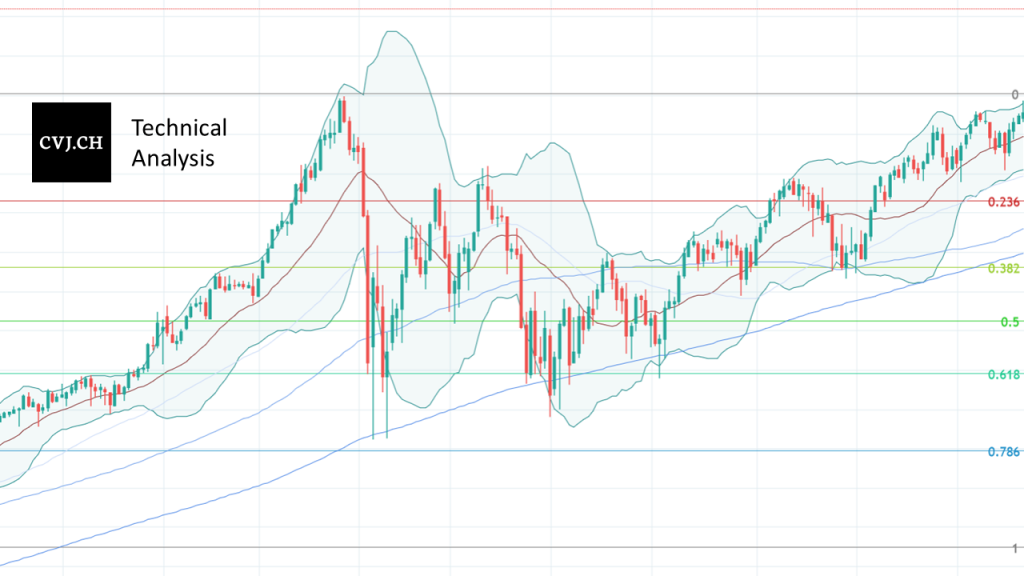

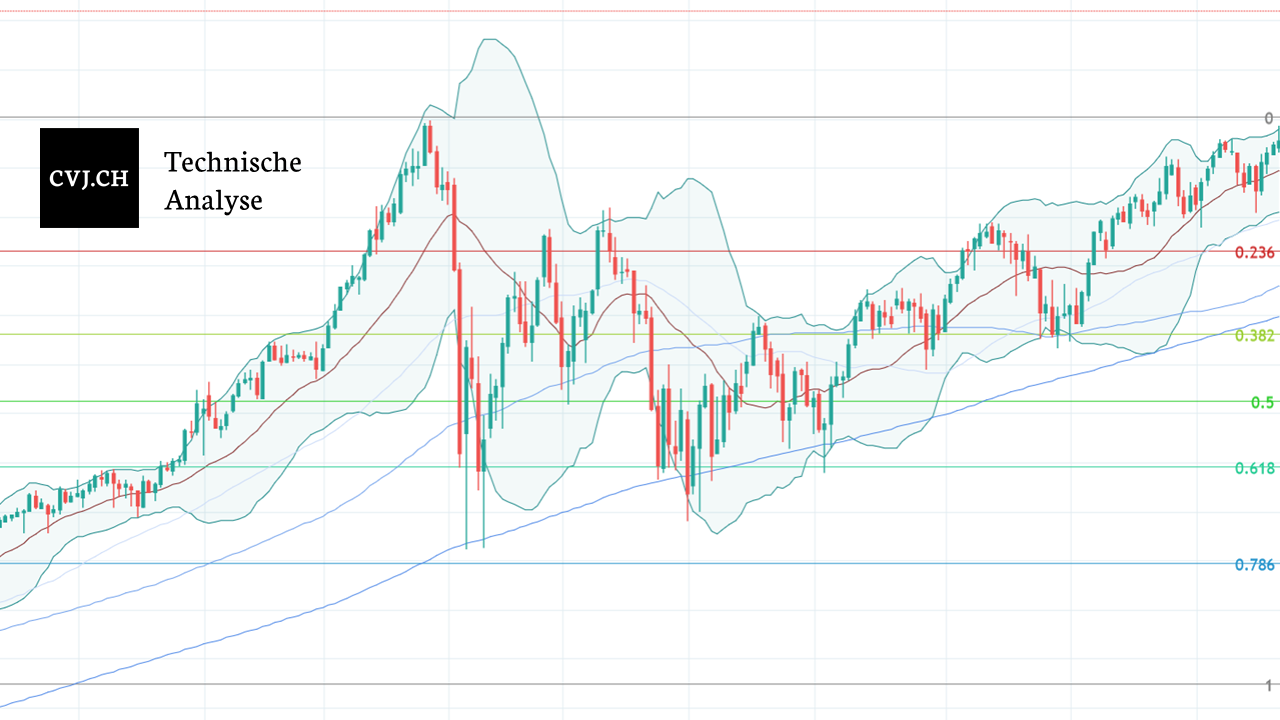
Bitcoin USD daily basis
Bitcoin USD - Breakthrough through 12'000 leads to new annual highs
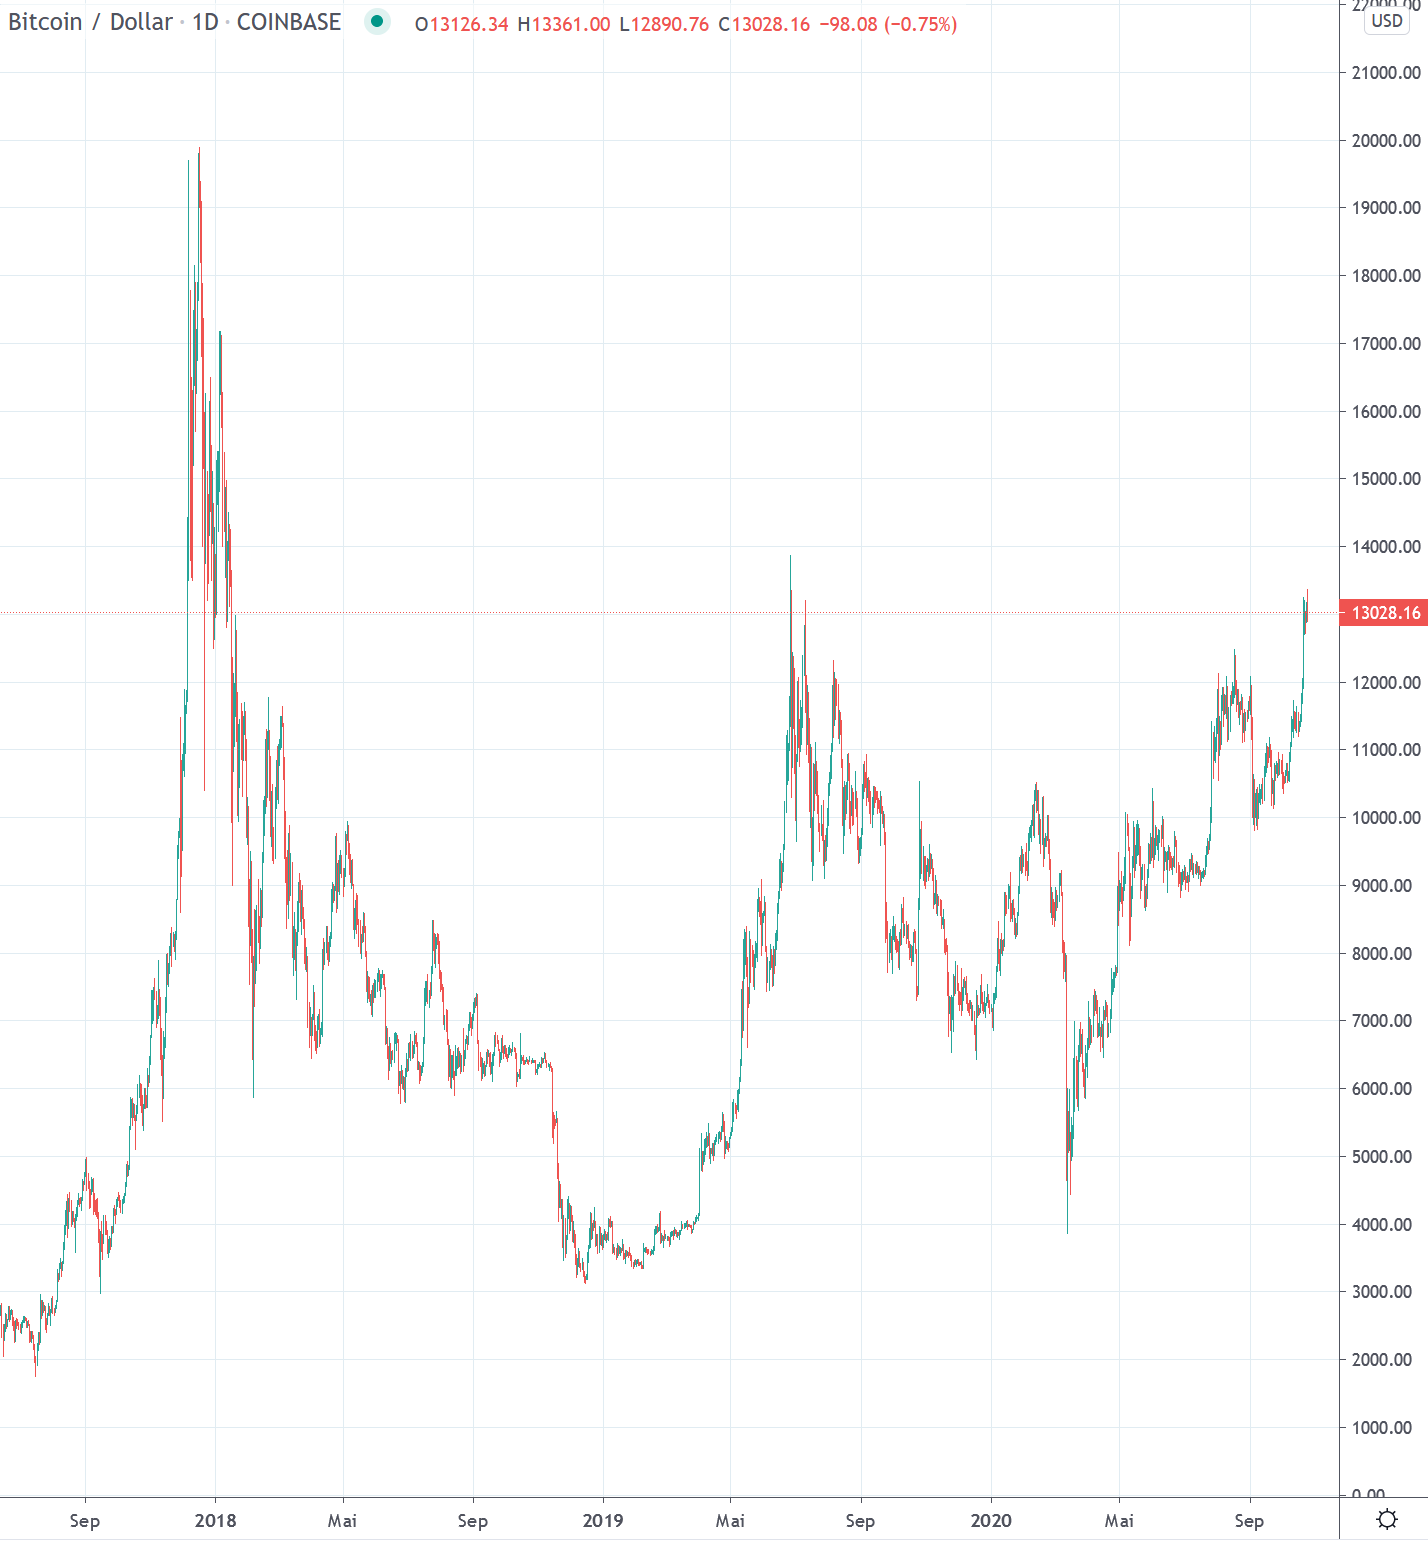
On Monday, Bitcoin was able to gain ground, and ended the day at a price of 11,760 USD, above the week's high of the previous week. Tuesday also saw another green candle as the day closed at USD 11,900, just below the resistances that had formed between August and early September. This important resistance zone was broken on Wednesday, with the highest daily upward movement since July 27th. This rally took the price to a daily high of USD 13,250 and to a daily closing price just above USD 12,800, which corresponded to a gain of USD 900 compared to the previous day. The substantial price gains of the first half of the week were impressively maintained in the following days. In narrower trading ranges, higher daily lows were consistently realized until Sunday, leading the price to close above the USD 13,000 mark at the end of the week.
Marked resistance overcome
Review Daily Interval
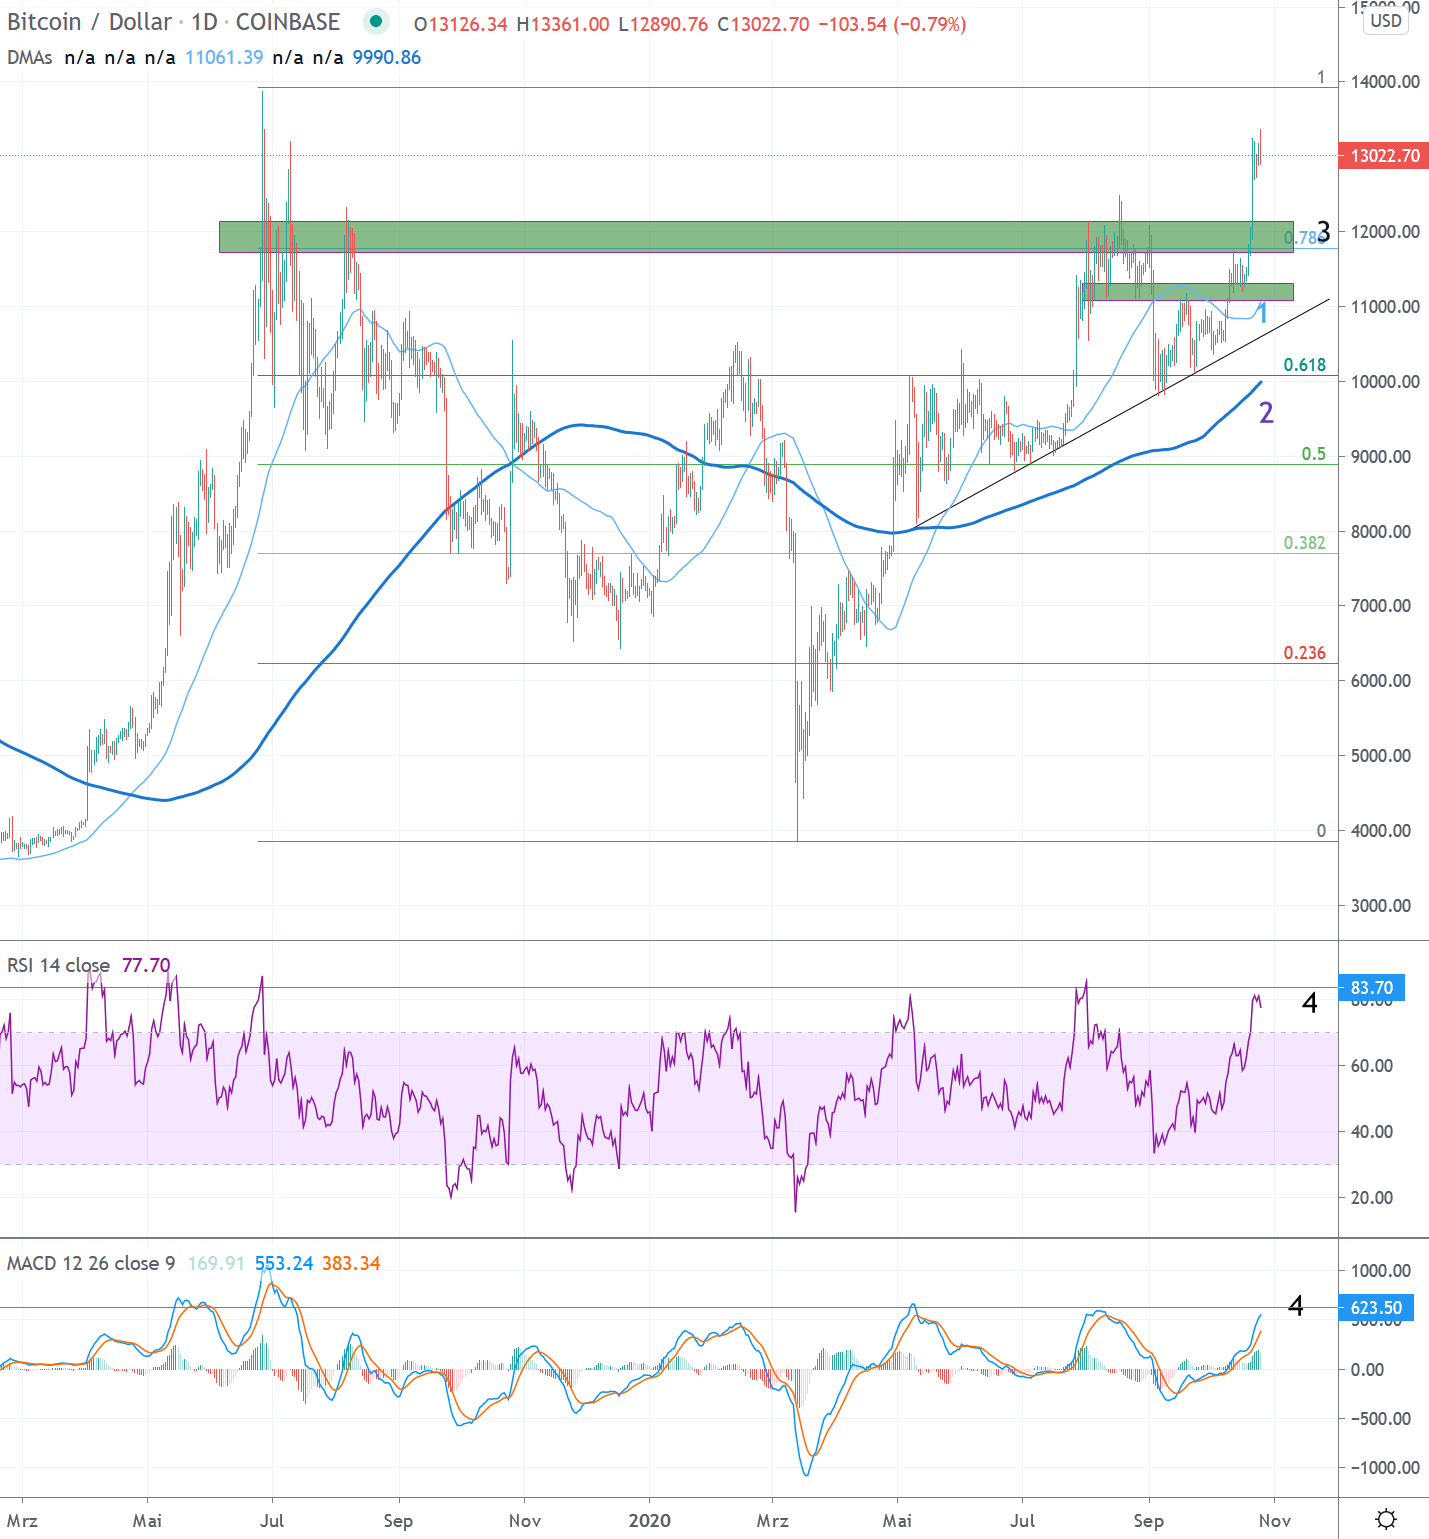
A veritable countermovement established itself after the price slump in mid-March. This led up to the resistance zones starting at USD 10,000. After a renewed rejection at the beginning of June, an almost two-month consolidation was observed. This was characterized by a series of higher daily lows and lower daily highs. The series of lower highs was broken on 22 July. This was followed on July 27, by a break through the resistance zone around USD 10,500, which has been established since August 2019 and which Bitcoin has already failed to break several times.
The resistance zone around USD 10,000 was interesting in several respects. On the one hand, the 0.618 Fibonacci point (1) of the entire downward movement, which was heralded at the end of June 2019 just below USD 14,000, is located here. On the other hand, the zone around $10,000 also served as a confirmation of the still bearish trend of lower highs since December 2017 (see next section). This zone now counts as a significant support (green).
Outlook
Bitcoin recently established itself above the newly created support in the USD 10,000 range. This support was confirmed by a re-test in early September, and serves as an important pillar of the positive trend. After a consolidation in the USD 10,500 range, an initial upward movement brought the Bitcoin price up to the first resistance at around USD 11,300. These had formed as a result of support for trading activities from the end of July to the beginning of September. After a consolidation phase in this zone in the previous week, a remarkable second upward movement in the reporting week led through the marked resistance around USD 12,300. As mentioned in the last report, there was a good chance that this area would be tested again. The significant resistance zone around USD 12,300 (3) became established as early as January 2018 and has served as a zenith for the Bitcoin price on several occasions since then (see Macro Outlook). Breaking through this zone is a strong indication that the market is serious about the recent trend reversal.
For a sustained healthy positive trend, the recently overcome resistance should now be respected as support in the coming weeks. The current strong rally is coming from overbought territory on the RSI and MACD indicators (4). Setbacks should therefore find initial support around USD 12,000 and again above USD 11,000, where support was provided by the S/R flips in the period July to October. In this zone lies the trend line of the lows, which is respected since the end of April, and the 50 daily average (1). In case of a stronger setback, the 10'000 USD mark should still be observed, where the 200 daily average (2) is also moving in the meantime. However, if this zone is visited again or falls below, a longer lasting consolidation in the USD 9'000 - 11'500 range would be expected.
A final resistance before a "bluesky" scenario up to the ATH, represents the mark at around USD 14'000. This zone marked the cap of the first significant rally between March and June 2019 and played a role earlier (see next section).
Macro: Trend reversal becoming established
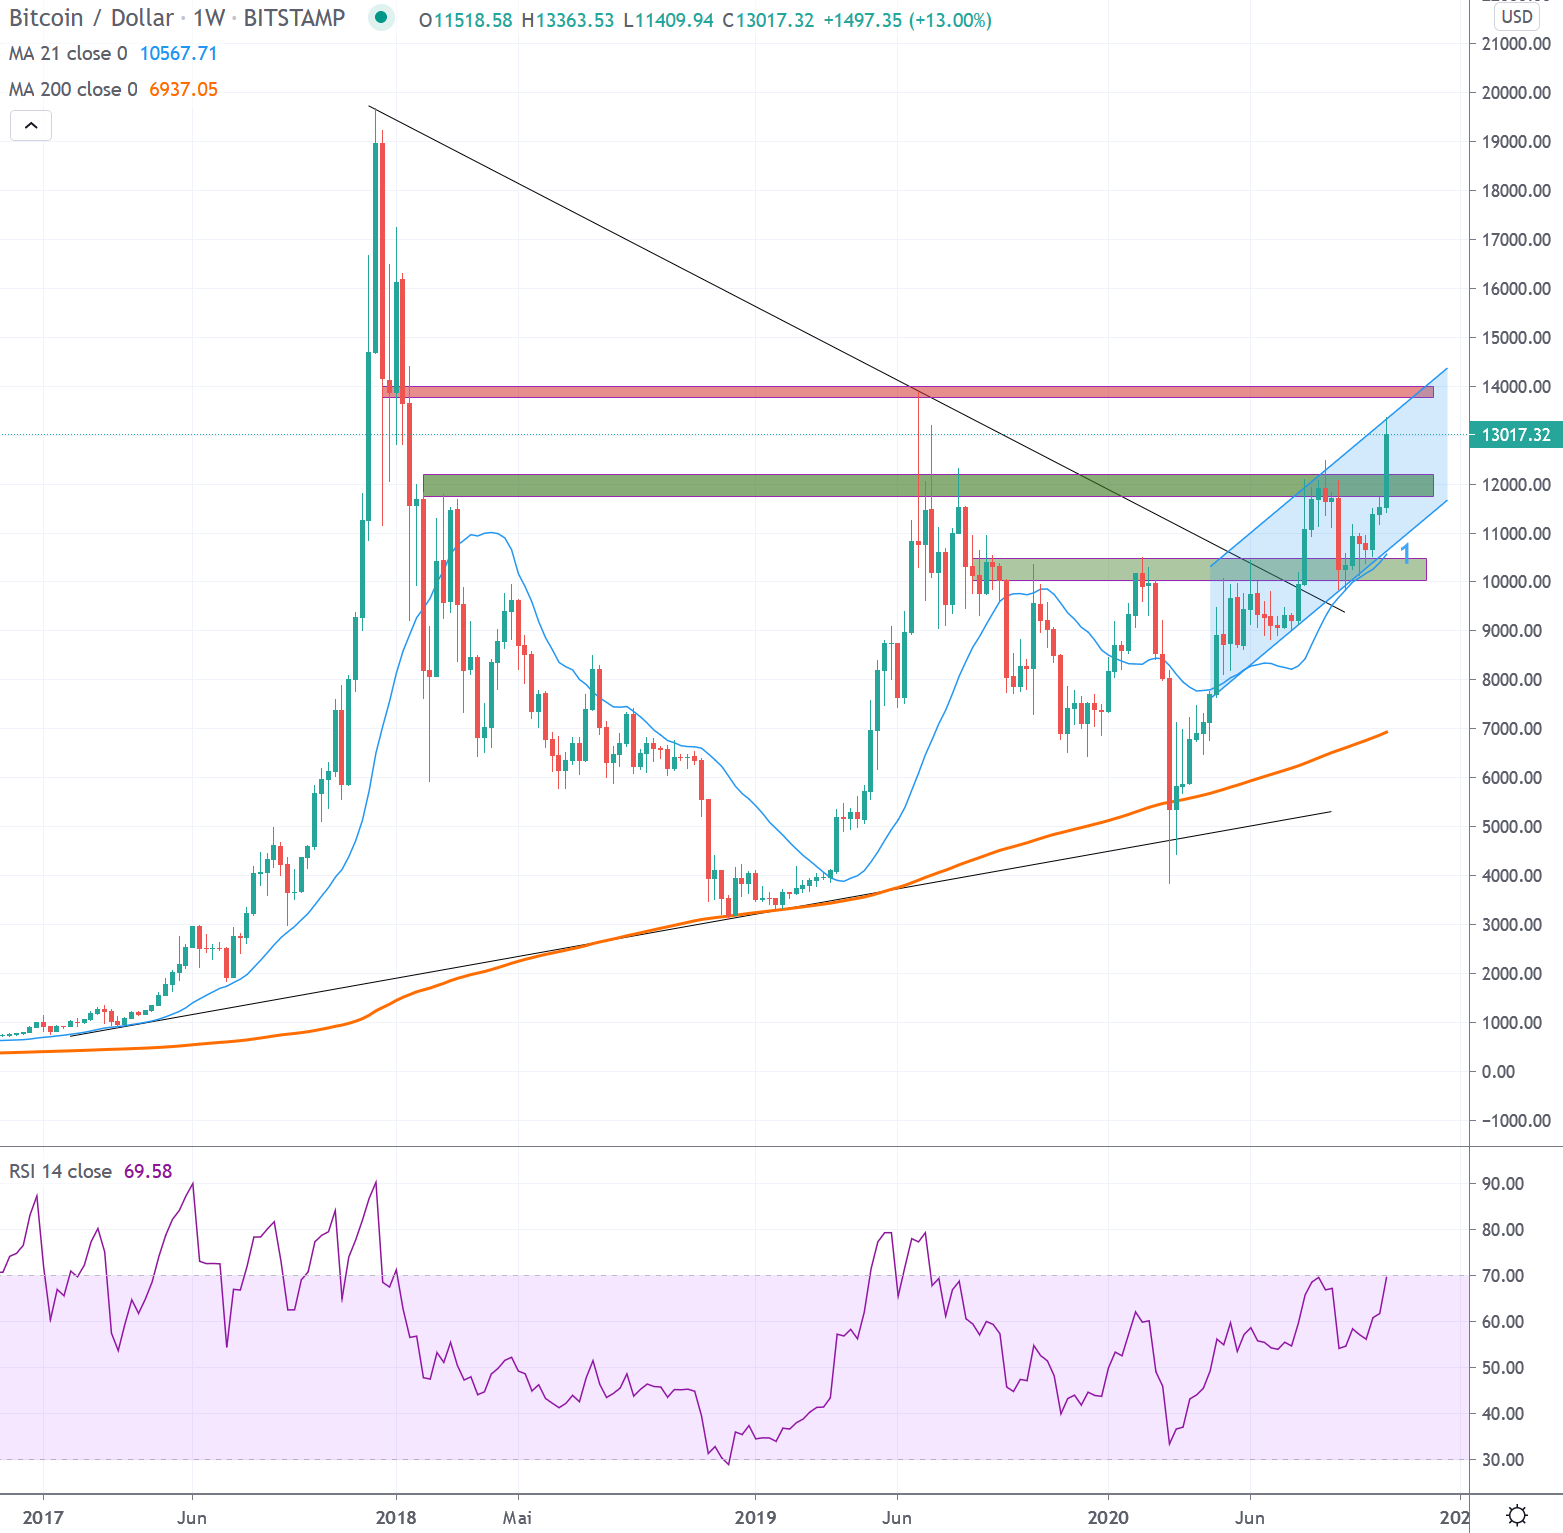
Bitcoin was able to set a higher high for the first time in the weekly interval, breaking the prevailing bearish trend since December 2017. The series of lower highs, which lasted for 135 weeks, was thus interrupted (marker).
Since the breakthrough of the bearish trend, the signs for a valid trend reversal are increasing. This can be legitimized by a continuation of the weekly candles within the establishing trend channel, as well as further development above the 21 week average (1).
A sustained respect for the newly created supports in the range of USD 11'700 and USD 10'500 over the next weeks/months underlines the legitimacy of the trend reversal. If a consolidation at the newly climbed level takes place with respect to the aforementioned supports, the signs are favorable for a breach of the last resistance zone at USD 14,000 (red). If this hurdle is cleared, there is not much more to prevent a renewed attack on the all-time high of a good USD 20,000.
A drop in the price that would take the price back into the areas below USD 10,000 over several weeks would damage the positive momentum and would argue for a longer-lasting consolidation.