
Close Menu
Crypto Valley Journal
    Facebook X (Twitter) Instagram
    Crypto Valley Journal
    • Hot Topics
      • News
      • Minds
    • Focus
      • Background
      • Blockchain
      • Legal & Compliance
      • Non-Fungible Token (NFTs)
    • Investing
      • Markets
      • Financial Products
      • Decentralized Finance (DeFi)
      • Exchange overview
    • Education
      • Basics
      • Glossary
      • Politicians on crypto
    • Statistics
      • Bitcoin-ETF-Flows
      • Ethereum-ETF-Flows
      • Crypto market data
      • On-chain data
    • Academy
      • Overview
      • Part 1: Blockchain
      • Part 2: Money
      • Part 3: Bitcoin
      • Part 4: Cryptocurrencies
      • Part 5: Decentralized Finance
      • Part 6: Investing
    • English
      • Deutsch
    Crypto Valley Journal
    You are at:Home » Hot Topics » News » Bitcoin Fear & Greed Index at 8: Market at deepest pessimism since the FTX collapse

    Bitcoin Fear & Greed Index at 8: Market at deepest pessimism since the FTX collapse

    By Editorial Office CVJ.CH on 30. March 2026 News

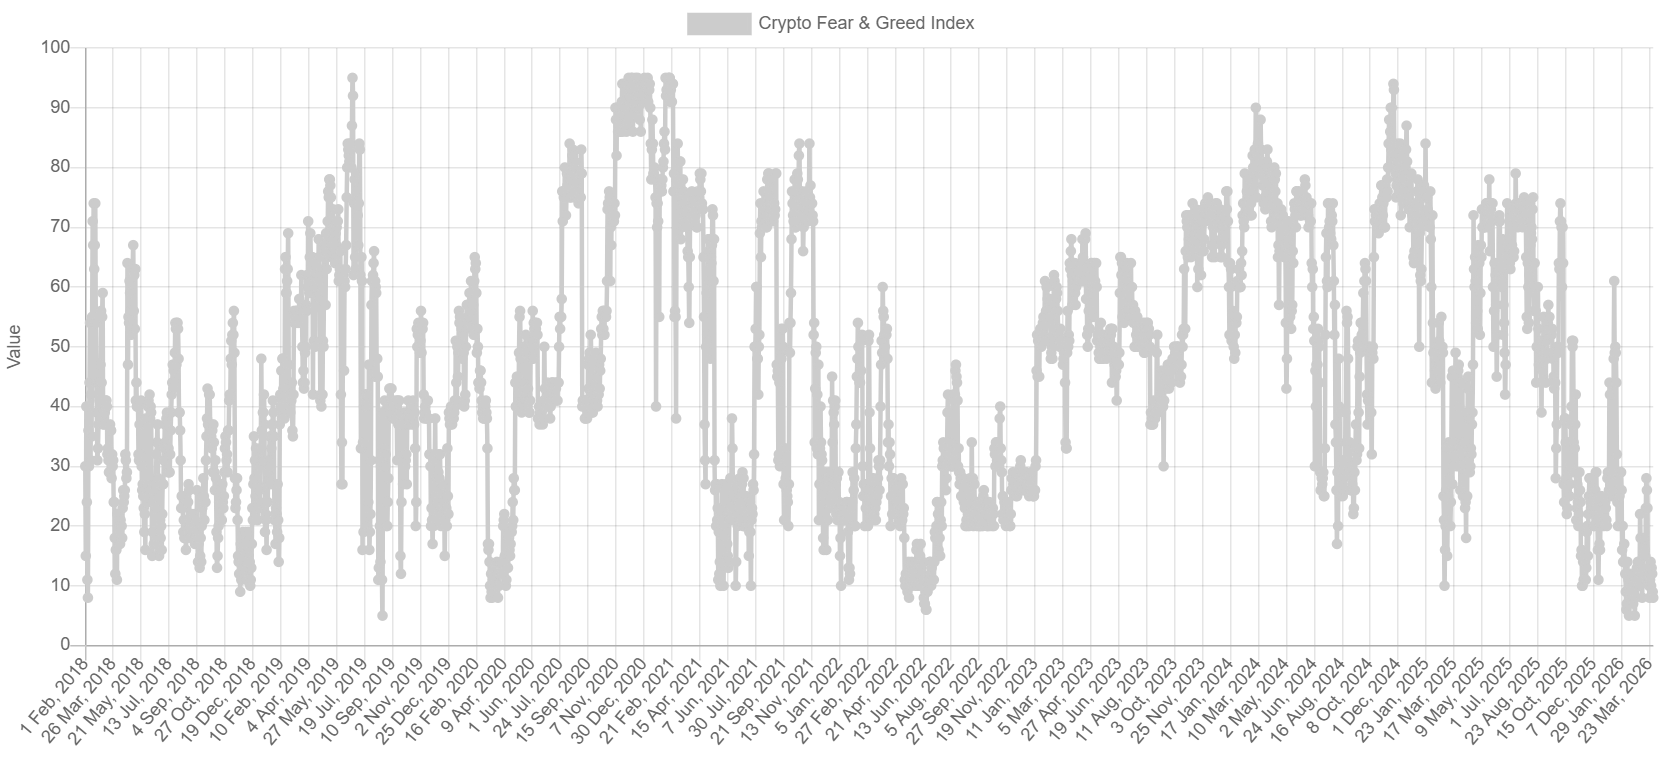
    The Crypto Fear & Greed Index stands at 8 today, deep in Extreme Fear. It marks the 59th consecutive day below 25, the longest stretch of pessimism since the FTX collapse in late 2022. The low was recorded on February 6 at 5, the lowest level since tracking began in 2018.

    The contrast is striking: as recently as October 5, 2025, the index was in Extreme Greed. In less than five months, market sentiment fully reversed. Since then, any recovery has been short-lived, with the current level of 10 marking the lowest reading outside the three historical capitulation phases on record.

    Subscribe to our newsletter

    The best articles of the week, directly delivered into your mailbox.

    Bitcoin Fear & Greed Index: What it measures and what it doesn’t

    The Fear & Greed Index aggregates multiple inputs, including price volatility, market momentum, social media activity, Bitcoin dominance and Google Trends data. The result is a sentiment gauge, not a pricing model. A reading of 10 indicates that nearly all market participants are positioned defensively.

    Ongoing liquidations reflect the pressure. On March 29, around USD 312 million in leveraged positions were liquidated within 24 hours, including USD 218 million on the long side. During the initial sell-off in early February, 24-hour liquidations exceeded USD 2.6 billion. The decline in open interest to significantly lower levels suggests that a large share of leverage has already been flushed out, historically a prerequisite for durable bottom formation.

    Bitcoin spot ETFs recorded combined outflows of USD 396.8 million on March 26 and 27, marking the largest two-day outflow since early March. Unlike previous Extreme Fear episodes, selling pressure is not limited to retail but also reflects activity from institutional participants.

    Historical context: three precedents, three different paths

    Readings below 10 are rare. Since 2018, they have occurred in three distinct phases: March 2020 during the COVID crash, June 2022 following the Terra/Luna collapse, and the current episode. All three ultimately preceded major upside moves, with gains ranging from 150% to over 1,400% from the respective lows. The time required for recovery, however, varied significantly.
    Bitcoin Fear Greed Index
    Bitcoin Fear & Greed Index

    Following the COVID low in March 2020, Bitcoin rose by around 133% within six months. After the FTX collapse in November 2022, when the index stood at 12, Bitcoin traded sideways for months and only returned to USD 40,000 by the end of 2023, a 150% increase that took nearly a year to materialise. The Terra/Luna collapse in June 2022, which pushed the index down to 6, marked the beginning of a prolonged bear market. The 2018 bottom, when the index remained in extreme pessimism for weeks, was only identifiable in hindsight.


    Ray Dalio’s Bridgewater Associates Minds

    Star investor Ray Dalio considers Bitcoin inferior to gold

    CLARITY Act DeFi Background

    CLARITY Act: The year’s most important crypto deal heads for a decision

    Hyperliquid ETFs post record daily inflows of 25.5 million USD. HYPE token gains double digits and beats Bitcoin on a market-adjusted basis. Financial Products

    HYPE all-time high: Hyperliquid ETFs post record inflow of 25 million USD

    Digital finance transparency relies on Proof of Reserves, Merkle trees, MPC custody and 24/7 monitoring to verify solvency and user assets. Basics

    Transparency as the foundation of security in digital finance

    Ray Dalio’s Bridgewater Associates Minds

    Star investor Ray Dalio considers Bitcoin inferior to gold

    CLARITY Act DeFi Background

    CLARITY Act: The year’s most important crypto deal heads for a decision

    Structural differences vs previous episodes

    What often gets overlooked is a key distinction from 2022. Back then, the downturn was driven by clearly identifiable catalysts, including Terra/Luna, Three Arrows Capital and FTX. The 2026 drawdown has no single trigger. Instead, it reflects a combination of macro pressure from persistently restrictive Fed policy, escalating trade tensions and a strong US dollar. According to Bloomberg, the 30-day correlation between Bitcoin and the S&P 500 rose to 0.74 in early March, the highest level of the year, indicating that Bitcoin is once again behaving like a risk asset rather than a hedge.

    Bitcoin funding rates on Binance recently stood at -0.0002%, pointing to a clearly bearish derivatives positioning. At the same time, token unlocks of nearly USD 473 million are scheduled for today alone, led by HYPE, SUI, ENA, EIGEN and OP. US labour market data on April 4 could act as a near-term catalyst in either direction. With negative funding rates, any positive macro surprise could trigger significant short squeeze dynamics.

    Historical data shows that since 2018, buying below an index level of 25 has resulted in positive 30-day returns in 68% of cases, with an average gain of 18.4%. In the remaining 32%, prices declined by a further 12% to 25% before a durable bottom was established.


    Share. Facebook Twitter LinkedIn Email Telegram WhatsApp

    About the author

    Editorial Office CVJ.CH
    • Website
    • Twitter
    • LinkedIn

    Since 2018, the editorial team at Crypto Valley Journal has been reporting from Zug - the heart of Switzerland’s Crypto Valley - on Bitcoin, cryptocurrency, blockchain, and regulatory developments in digital assets. Behind the publication’s collective editorial voice is a team of writers with backgrounds in financial markets, law, and technology.

    Related Articles

    cvj weekly review

    Weekly review CW 21: SpaceX reveals $1.5 billion Bitcoin investment

    Polymarket exploit on Polygon: the UMA CTF Adapter loses more than 520,000 USD to labelled exploiter addresses.

    Polymarket exploit: prediction market loses $520k to attackers

    Trump Media bitcoin holdings shrink: 2,650 BTC moved to Crypto.com, remaining 6.8k BTC sit 34% below the cost basis.

    Trump Media sells more bitcoin at a 34% loss

    cvj weekly review
    23. May 2026

    Weekly review CW 21: SpaceX reveals $1.5 billion Bitcoin investment

    Polymarket exploit on Polygon: the UMA CTF Adapter loses more than 520,000 USD to labelled exploiter addresses.
    22. May 2026

    Polymarket exploit: prediction market loses $520k to attackers

    Trump Media bitcoin holdings shrink: 2,650 BTC moved to Crypto.com, remaining 6.8k BTC sit 34% below the cost basis.
    22. May 2026

    Trump Media sells more bitcoin at a 34% loss

    twitter image button instagram image button linkedin image button youtube image button

    About Crypto Valley Journal
    About Crypto Valley Journal

    On the pulse of the movement

    • Academy
    • Contact
    • Advertising
    • About us
    • Partner
    • Imprint
    • Privacy
    • Disclaimer
    Search

    Type above and press Enter to search. Press Esc to cancel.