
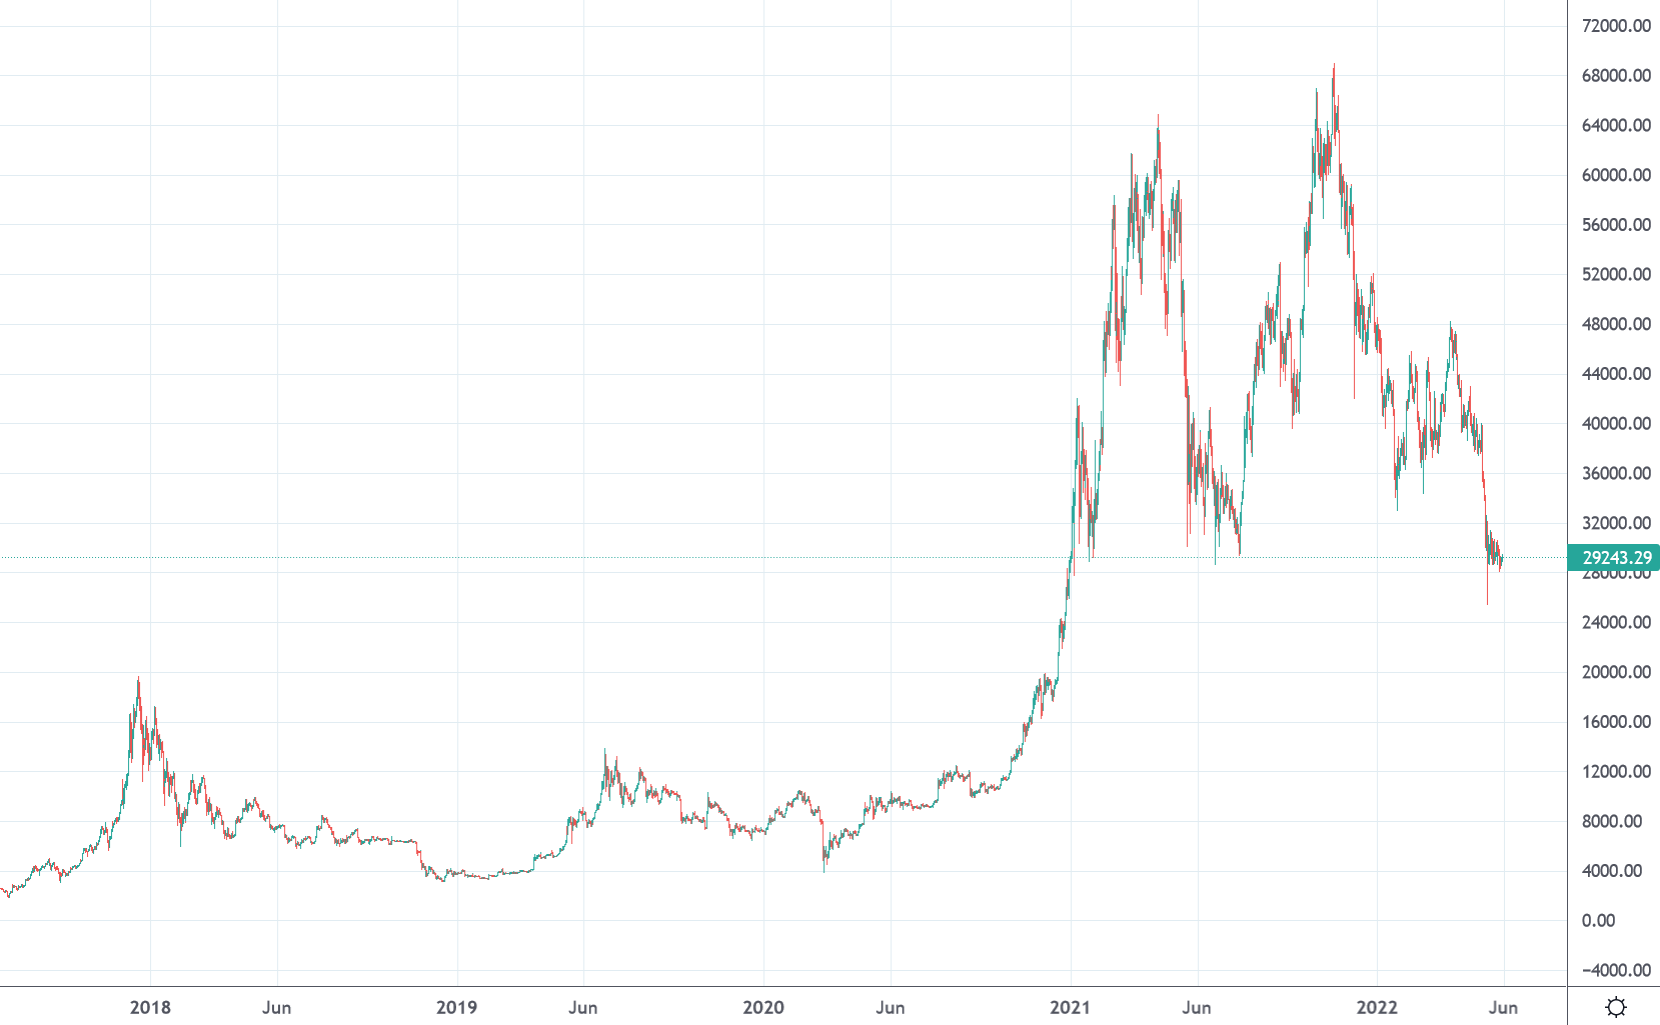
Bitcoin USD daily basis
Bitcoin USD weekly review: Consolidation in the area USD 29'000
During the reporting week, it was important to determine whether the bottoming out around the 30'000 zone, which was indicated in the previous week, would hold. In short: it did, and this in Bitcoin terms, in relatively narrow ranges. But first things first. Monday was characterized by a trading pattern that has been seen a lot lately. Price gains from the previous day were leveled off again. Accordingly, the market started Tuesday at the 29'100 level and closed the day only slightly higher at USD 29'463. A short excursion to USD 30'196 was leveled again on Wednesday by the close of trading. On Thursday, the market tested the other side of the spectrum with a daily low in the 28'000 range. However, this test also ended at the close of trading at USD 29'141 back in the 29'000 area. A weaker Friday was followed by a slight recovery over the weekend, which ultimately let the week, you guessed it, close in the area of USD 29'000.
First signs of trend reversal negated
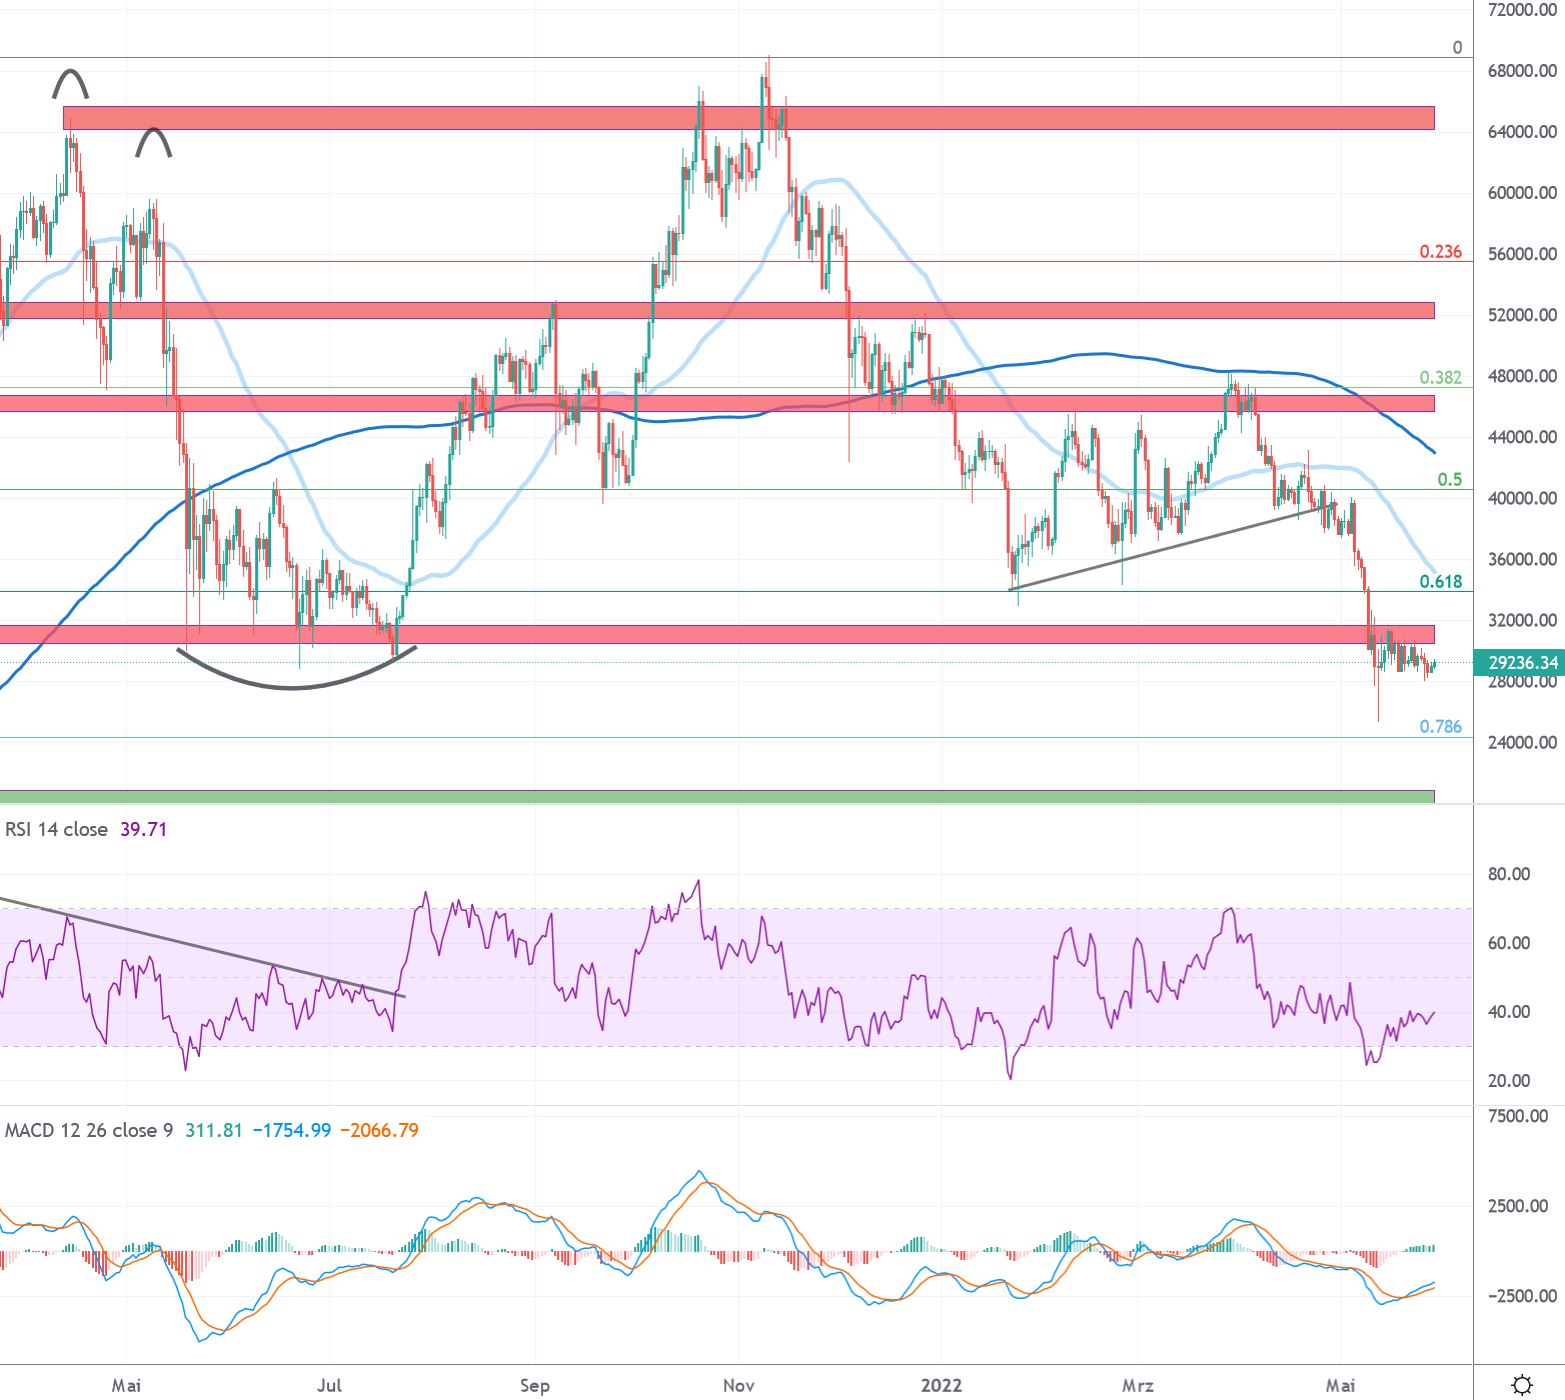
Daily Interval Review
After the mid-March 2020 price plunge, a veritable countermovement established itself. This led to the resistance zones above USD 10'000. After an initial rejection and a consolidation phase of almost two months, a breakthrough through the fundamental resistance zone followed on July 27, 2020, which persisted since August 2019 and accordingly caused Bitcoin to fail several times already.
The area around USD 10'000, which served as resistance, was interesting in several respects. On the one hand, the 0.618 Fibonacci point of the entire downward movement, which was initiated at the end of June 2019 just below USD 14'000, was located in this price area. On the other hand, the zone around USD 10'000 simultaneously acted as a witness of the still bearish trend from lower highs since December 2017 (see macro view on weekly basis). Bitcoin was able to establish itself above the newly created support in the USD 10'000 area since the end of July 2020 and provided the first confirmation of a trend reversal of the bear market that had persisted since 2018 with the break of the resistance zone around USD 12'200 towards the end of October 2020. In the following weeks, the positive trend accentuated and led Bitcoin through the 14'000 resistance in early November 2020 and close to the then all-time highs around USD 20'000 for the first time in early December, which remained untouched for 158 weeks since the bull market in 2017.
With the breakthrough of the old all-time high at USD 20'000, the trend reversal was definitely heralded. Accordingly, there was a strong accentuation of the uptrend, which brought the Bitcoin price to its new all-time high just below USD 65'000 in just over 4 months. However, the rapid upward movement was abruptly halted in mid-May 2020, taking Bitcoin back to the USD 30'000 areas. After a three-month consolidation phase, the upward movement was continued no less spectacularly after a "rounding bottom" in the 0.61 Fibonacci area, which finally ended with a new all-time high at USD 69'000 in October 2020 after a "retest" of the 40'000 zone. Since then, a strong correction phase dominated once again, which led the Bitcoin price back to the USD 34'000 area and thus to trend-determining price territories. However, a bottom formation lasting more than 70 days, marked by higher lows, led Bitcoin above the stubborn 45'000 resistance.


Outlook Daily Interval
Just 73 days after reaching an all-time high at USD 69'000, the break of the 40'000 support zone at the end of the previous month suggests a change of course. The bull run, which has lasted over 401 days, seems to be running out of steam. The further direction of travel could accordingly turn out to be a longer sideways movement with a negative tendency.
The Bitcoin price fell below the lows of the previous week's bottom formation in the reporting week. The correction back below the 30'000 zone followed logically from the break of the price structure created over the past 3 months of higher lows. The current level is seen as the last line of defense for the bulls and should give clues about the macro situation. The current price area served as support in January 2021 and June 2021. A hold of this price area suggests an initial sideways movement in the corridor USD 28'000 - 38'000, while a continued break suggests a visit to the area around the old all-time high at USD 20'000 is likely.
New price discovery phase shows weakness
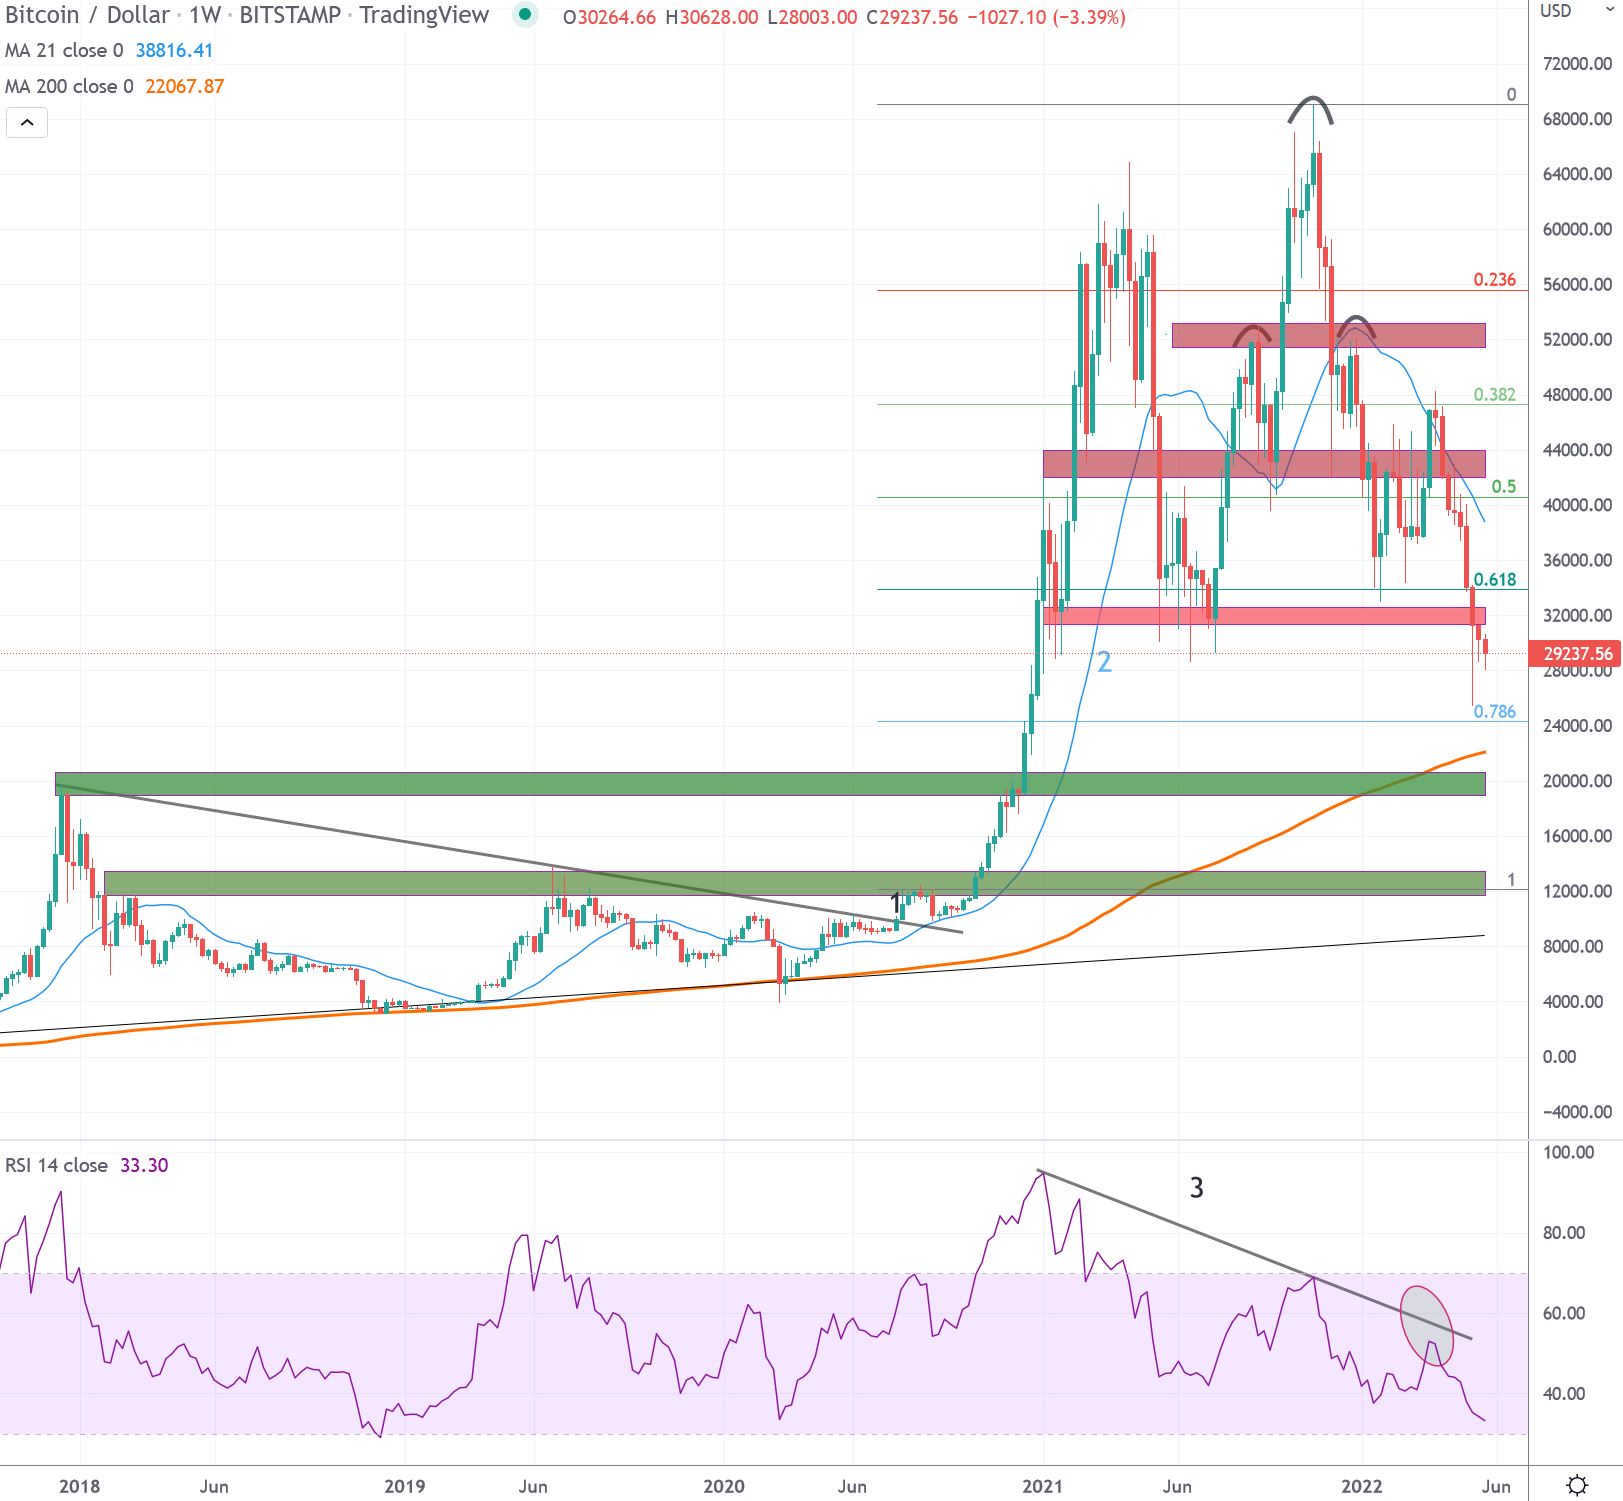
Review Weekly Interval
Bitcoin was able to set a higher high above USD 10'000 for the first time in the weekly interval in 2020, which broke the prevailing bearish trend since December 2017. This broke the series of lower highs that lasted for 135 weeks (1).
Since this first overcoming of the bearish trend, the signs for a valid trend reversal became stronger. With the push through important resistance zones and a continuous development above the 21-week average (2), the probabilities for a renewed reaching of the all-time high created in 2017/18 increased visibly. This scenario was completed in mid-December 2020. This was followed by a strongly accentuated price discovery above this historical zone, which produced a new all-time high of USD 65'000 in mid-April. A consolidation initiated since then ended in a veritable price slide that brought Bitcoin back to the USD 30'000 mark in just two weeks, even below the 21-week average (2) that has defined reliable bull or bear market phases in the past.
However, a subsequent breakout from the 10-week USD 30'000 - 40'000 consolidation area and a subsequent successful "retest" of the upper range of this channel most recently took Bitcoin above the all-time high created in April in an impressive counter-movement. After the creation of the new all-time high in the USD 69'000 area in November 2021, a vehement correction phase set in again, analogous to the pattern observed in May. This initially led to the break of the 50'000 support zone, which then promptly caused a bounce in this area, which now acts as resistance. Since then, a trend of accentuating lower weekly highs and lows has been observed, which is bringing Bitcoin back into the USD 30'000 zone.
Outlook weekly interval
The massive bull phase, which has lasted since July 2021 and originated from the healthy 0.618 Fibonacci area, which has been calculated since the start of the bull market and the all-time high of April, has recently been put to the test. The undershooting of the 40'000 area makes a rapid continued price discovery beyond the 69'000 all-time high a distant prospect for now. The market is setting a slower pace with the risk of falling into a bear market.
The series of higher lows and highs since October 2020 was not able to be continued, resulting in a short-term visit to the area above USD 25'000. A sustained move above USD 28'000 would suggest a low similar to mid-2021 price action and open up a robust sideways range in the USD 30'000 - USD 60'000 corridor.
Bitcoin's recent rally has failed to continue higher weekly lows. The current price action in the USD 30'000 area is a test of the last major support area. This is likely to be where the ultimate battle between bulls and bears will take place, as this is the 0.618 Fibonacci zone, which has been calculated since the beginning of the bull market and the all-time high. A sustained move below this area would also undercut the July 2021 price area, which would be close to a bear market confirmation.
Disclaimer
All information in this publication is provided for general information purposes only. The information provided in this publication does not constitute investment advice and is not intended as such. This publication does not constitute and is not intended as an offer, recommendation or solicitation to invest in any financial instrument, including cryptocurrencies and the like. The contents contained in the publication represent the personal opinions of the respective authors and are not suitable or intended as a basis for decision-making.
Risk notice
Investing in cryptocurrencies, is fundamentally associated with risk. The total loss of the invested capital cannot be excluded. Cryptocurrencies are very volatile and can therefore be exposed to extreme price fluctuations in a short period of time.

