
Good Morning!
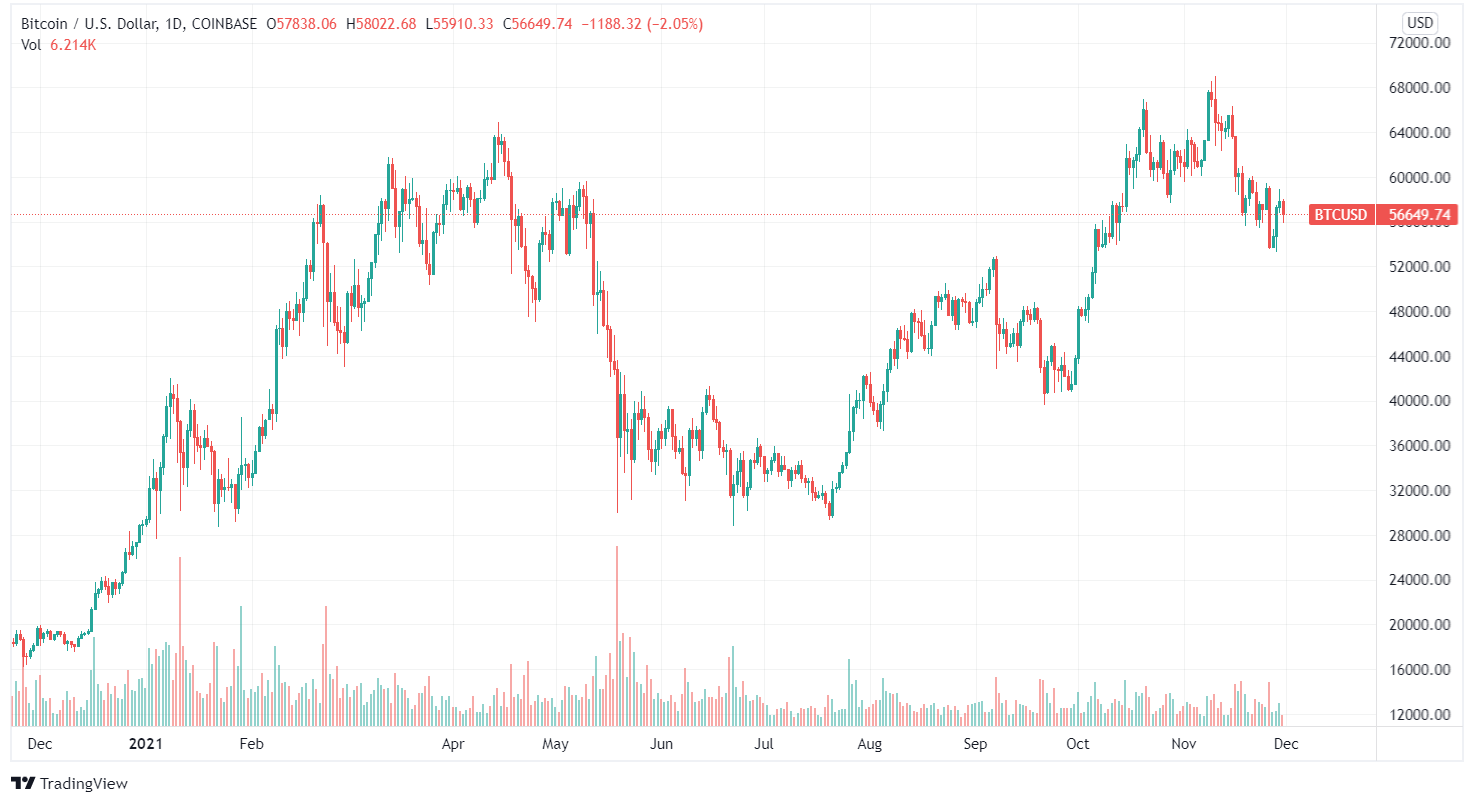
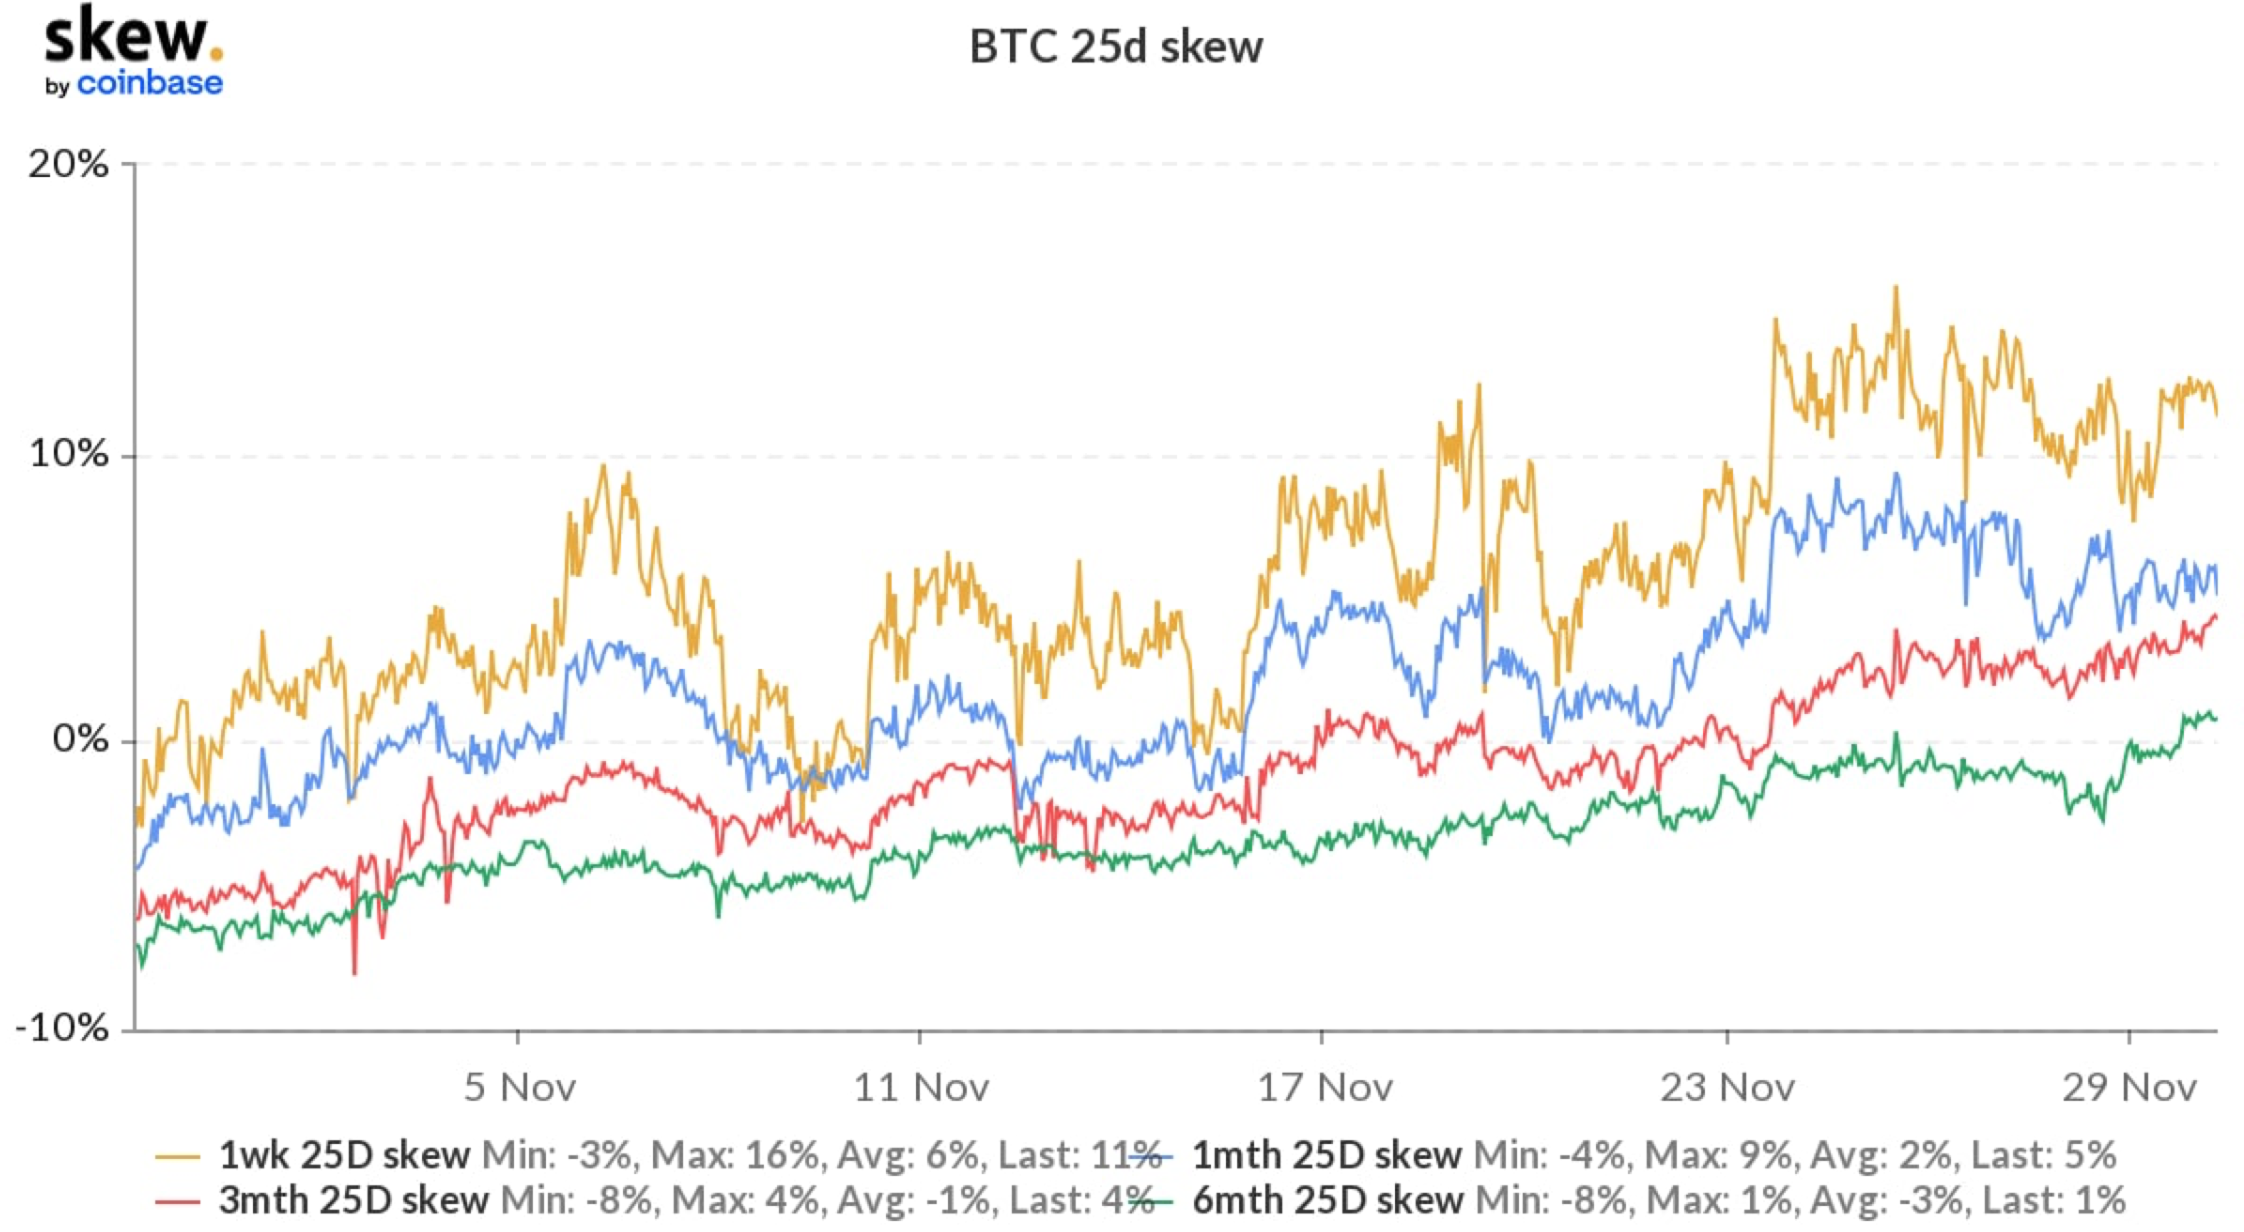
At the time of writing, Bitcoin (BTC) is trading at $56,145, after Monday’s recovery as bearish sentiment waned. BTC option skews became very positive this week as spot prices (alongside traditional markets) dipped following new Covid concerns.
The term structure keeps flattening Week-on-Week, but the contango shape persists overall, with both the BTC funding rates and the USD lending rates being almost 0% in the different venues. During the week we saw a strong shift in sentiment: there was a strong demand for the 60k and 48k puts expiring on December 31.
Options dynamics
Realized volatility (RV) increased on the back of the spot price sell-off, but not enough to change the shape of the term structure. A sharp sell-off is likely the only catalyst for sharply higher RV, justifying current option skews. Otherwise, I expect muted RV reactions to the upside. From now on, all eyes are on December 31. I still believe that there is still the opportunity for an end of year bull run towards 70k, as BTC showed strong support at $54k, and quickly recovered from Black Friday’s discounts.
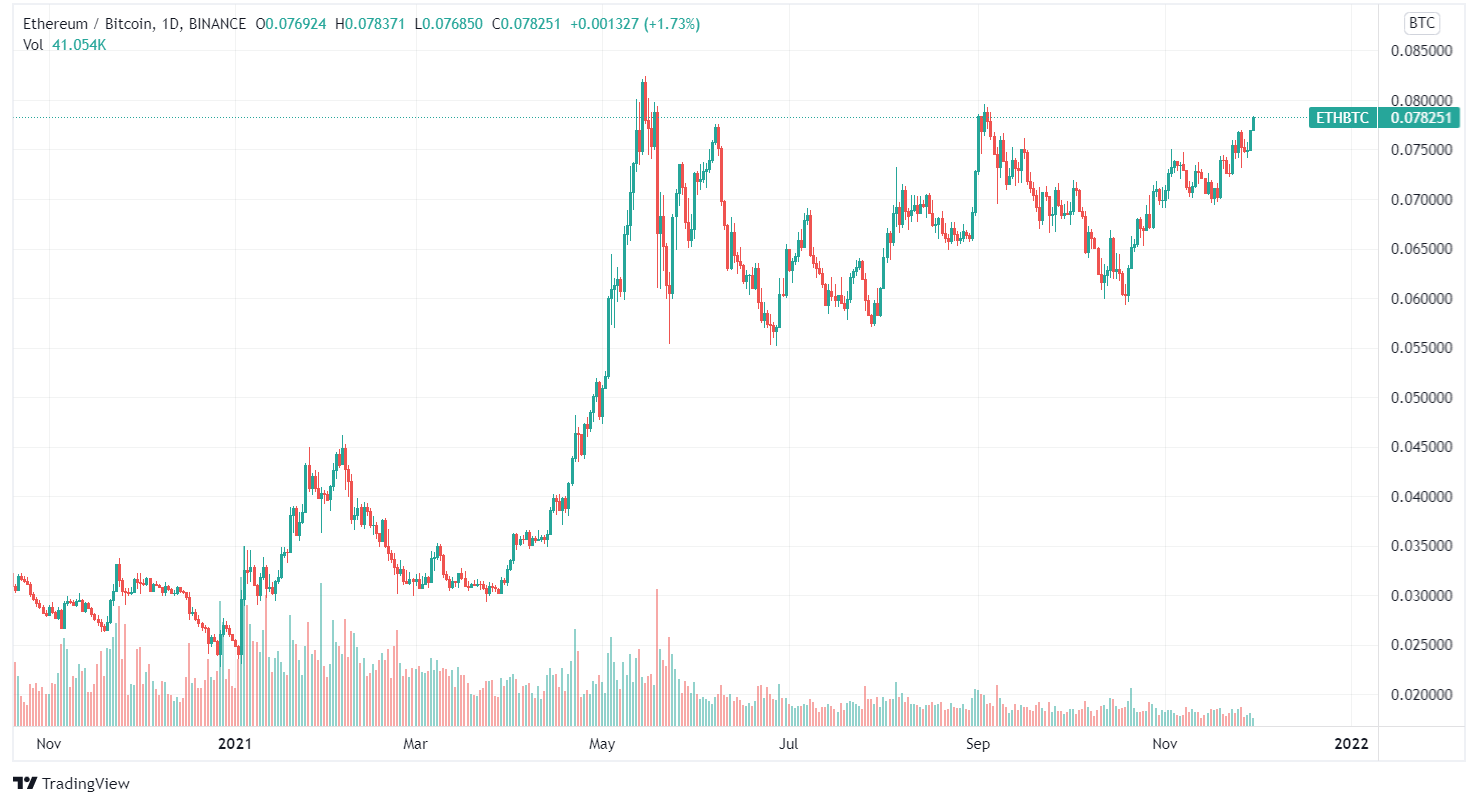
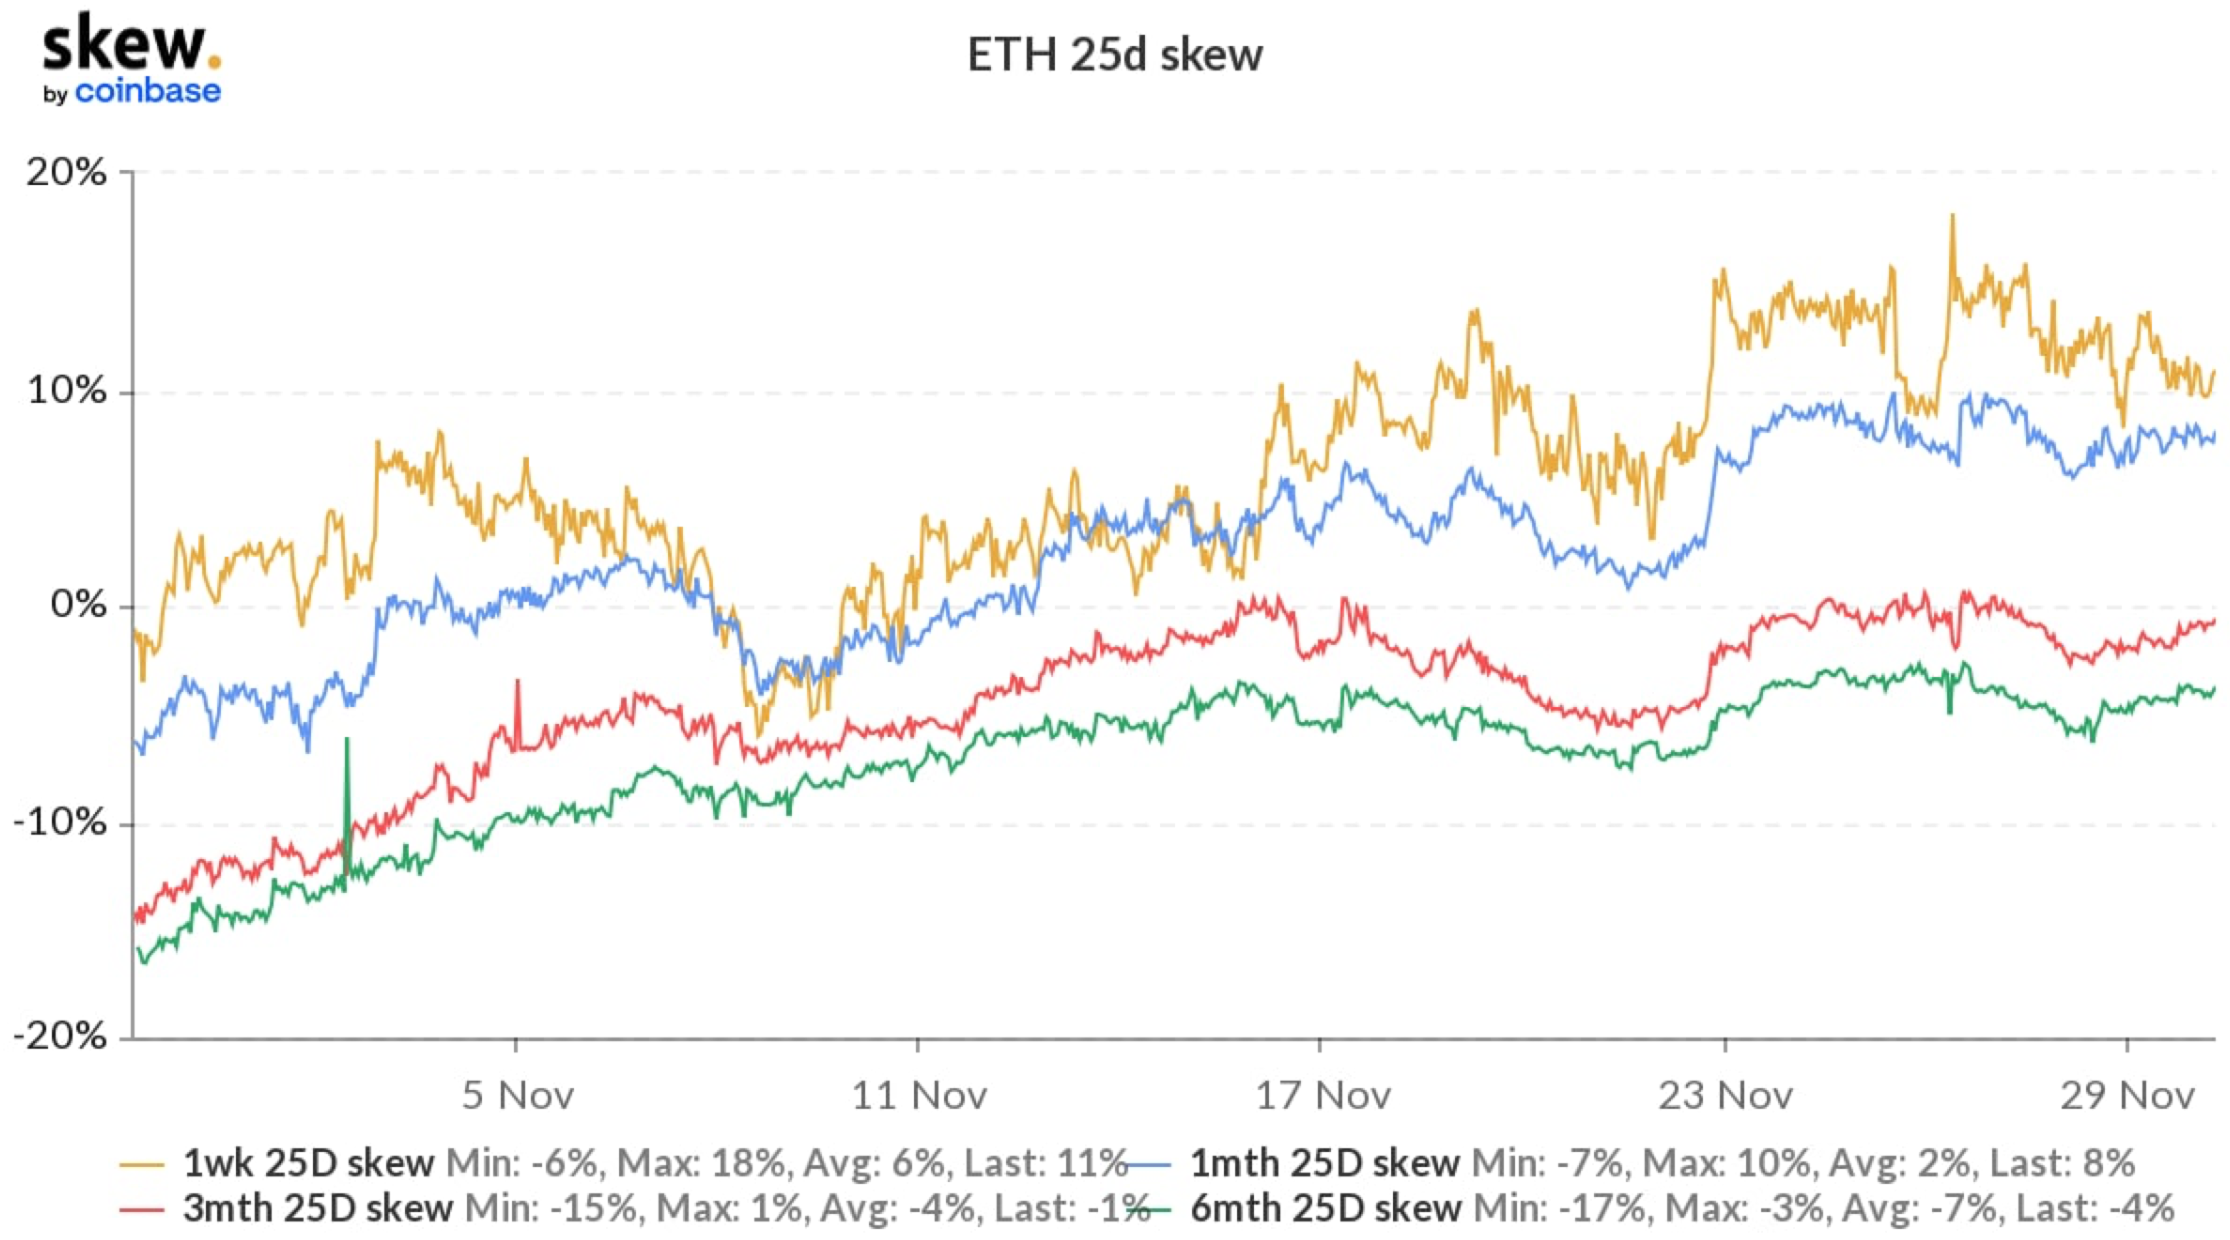
Ethereum (ETH) is currently trading at $4,357, having extended its outperformance versus BTC by 3.94% over the past week. ETH skews have finally returned all their gains, turning positive for all maturities 60 days and under. Sunday showed a sign of relief as $4k spot prices proved to hold up, causing skews to inch higher.
Traders are aware of the negative spot/volatility correlation and are hedging any potential ETH crash. The term structure flattened slightly, and the contango structure remained very steep. At the moment, there are massive bets on $5k calls expiring on December 31 (and we know that volume attracts volume...)
ETH RV is increasing, and I am confident that a break of $4k could spike RV higher. In my opinion, downside volatility carries the volatility risk, while upside volatility will likely be subdued.


Ethereum Layer 2
It has been three months now since the Ethereum network rolled out the London Hard Fork update, where developers were hoping to reduce gas fees. However, according to Dune Analytics, over the last 111 days, the network has burned over 1 million ether (this equals $3.8 billion!). Given this scenario, I am still convinced that Layer 2 (L2) tokens will rise and outperform ETH.
In the chart below, I have backtested a trading strategy that on a weekly basis reinvested capital in all of the L2 tokens with an equally weighted scheme and short ETH for the same notional amount. At the time of creation, the portfolio is assumed to be equal to one. In grey are shown the ETH Average Transactions Fees in Native Units according to Messari.io data.
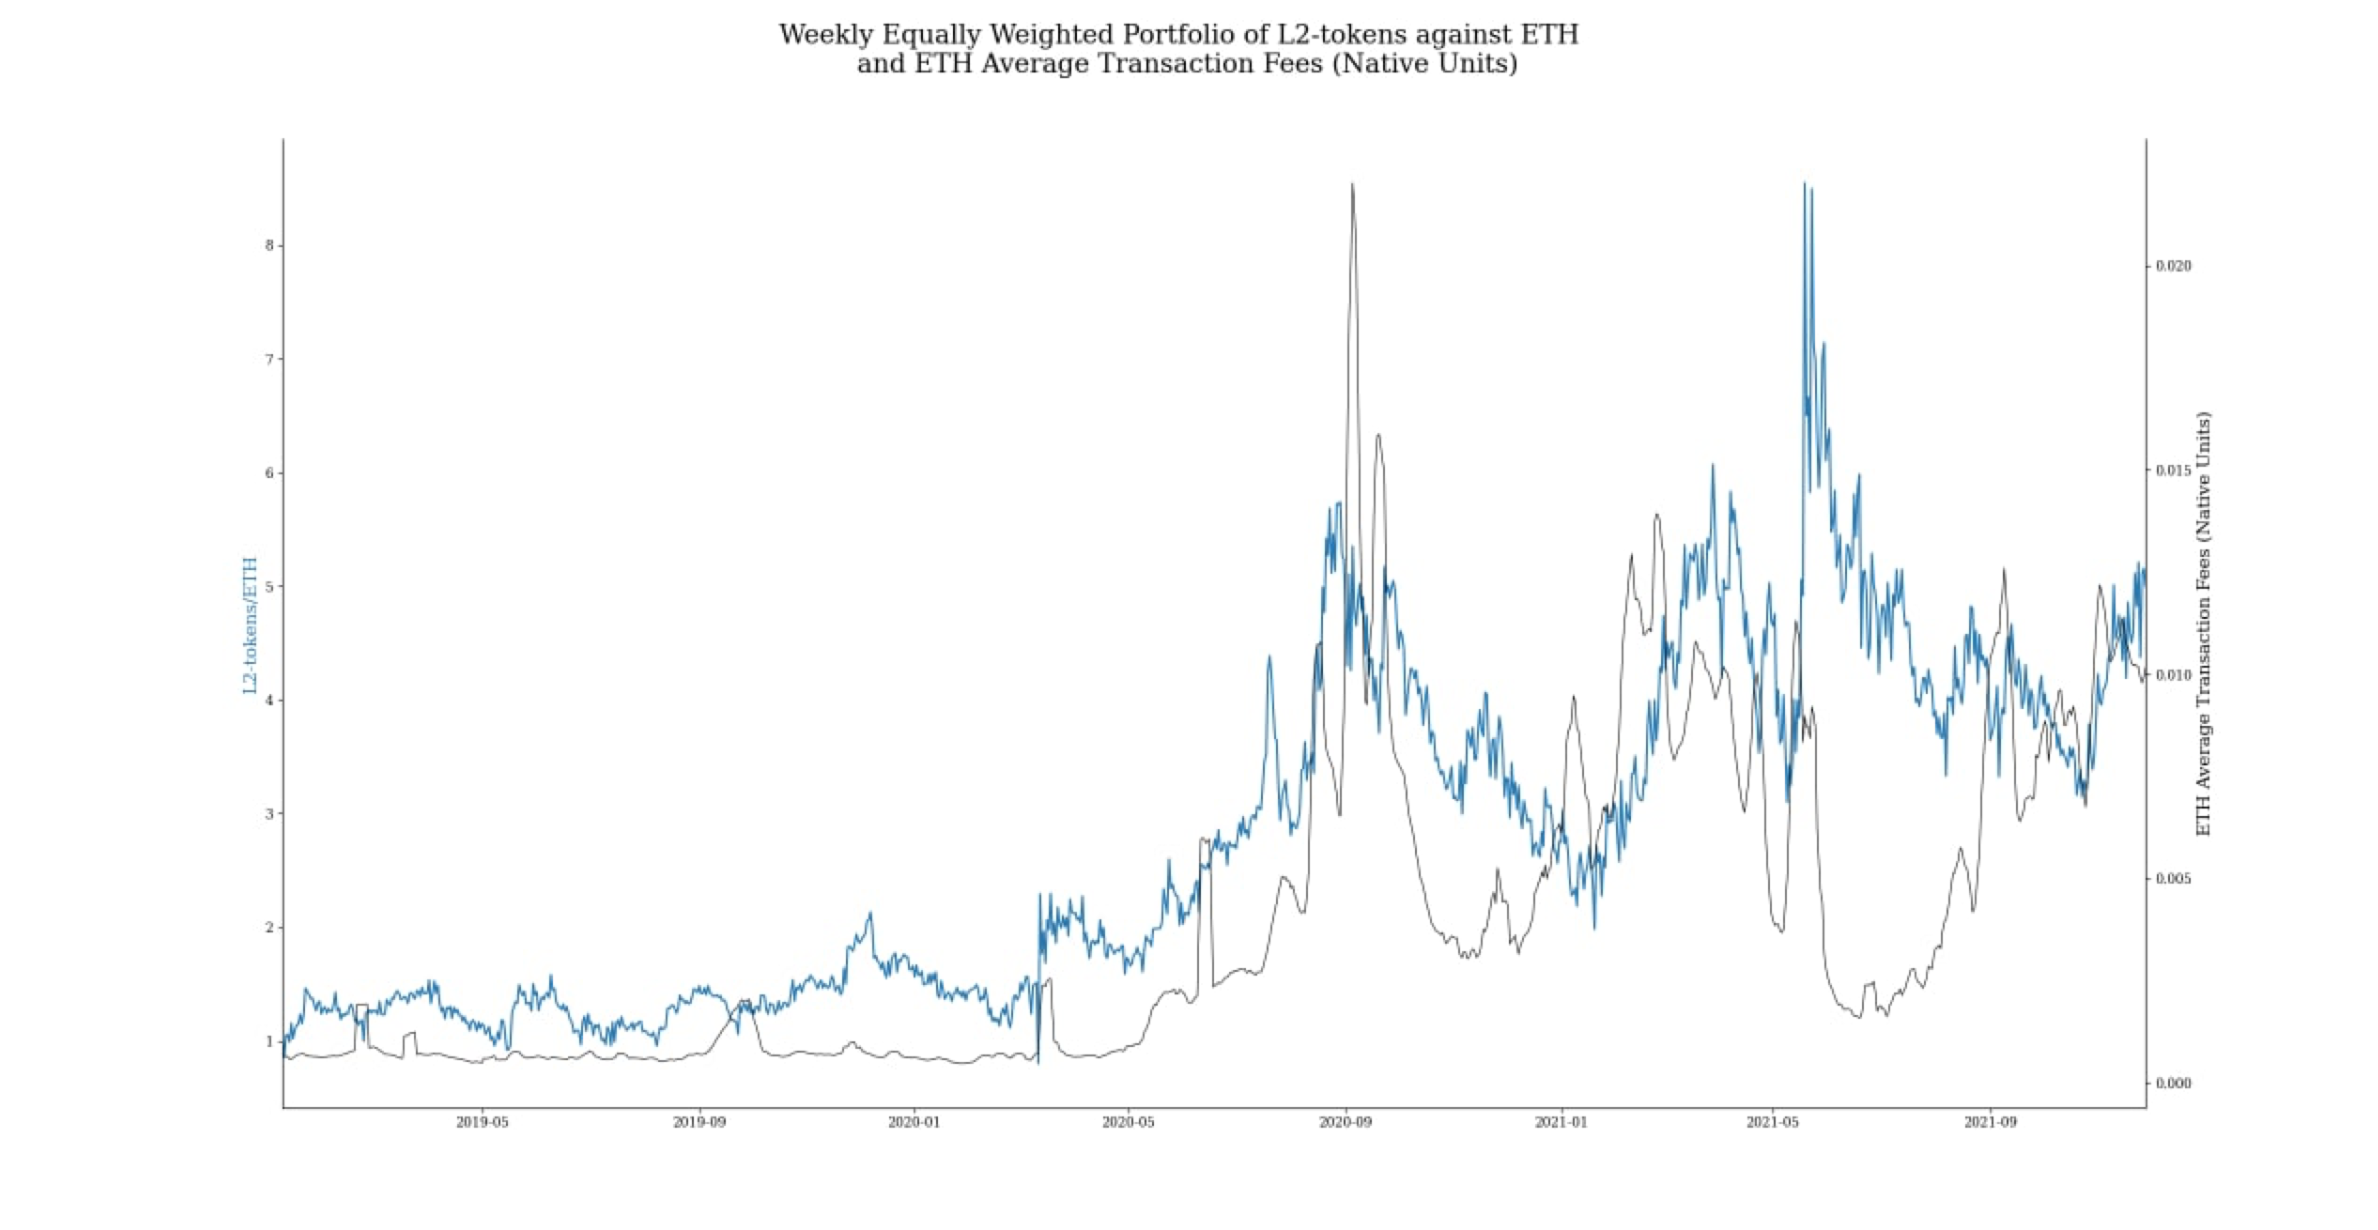
For all of you who can find different patterns, I would like to highlight this simple fact: when fees are high, L2 tokens outperform ETH and vice-versa. As long as average transaction fees stay this high (currently, 0.01 ETH ~ 43$ !!), I am betting that L2 tokens (e.g. MATIC, CTSI, LRC, RDN, SYS, etc. ...) will outperform ETH.
Please keep in mind that fees cannot increase infinitely… so, time will tell!
Happy Trading!
All intellectual property, proprietary and other rights and interests in this publication and the subject matter hereof are owned by Crypto Broker AG including, without limitation, all registered design, copyright, trademark and service mark rights.
Disclaimer
This publication provided by Crypto Broker AG, a corporate entity registered under Swiss law, is published for information purposes only. This publication shall not constitute any investment advice respectively does not constitute an offer, solicitation or recommendation to acquire or dispose of any investment or to engage in any other transaction. This publication is not intended for solicitation purposes but only for use as general information. All descriptions, examples and calculations contained in this publication are for illustrative purposes only. While reasonable care has been taken in the preparation of this publication to provide details that are accurate and not misleading at the time of publication, Crypto Broker AG (a) does not make any representations or warranties regarding the information contained herein, whether express or implied, including without limitation any implied warranty of merchantability or fitness for a particular purpose or any warranty with respect to the accuracy, correctness, quality, completeness or timeliness of such information, and (b) shall not be responsible or liable for any third party’s use of any information contained herein under any circumstances, including, without limitation, in connection with actual trading or otherwise or for any errors or omissions contained in this publication.
Risk disclosure
Investments in virtual currencies are high-risk investments with the risk of total loss of the investment and you should not invest in virtual currencies unless you understand and can bear the risks involved with such investments. No information provided in this publication shall constitute investment advice. Crypto Broker AG excludes its liability for any losses arising from the use of, or reliance on, information provided in this publication.

