
A summarizing review of what has been happening at the crypto markets of the past week. A look at trending sectors, liquidity, volatility, spreads and more. The weekly report in cooperation with market data provider Kaiko.
The last 7 days in the cryptomarkets:
- Price Movements: Intraday Bitcoin price movements are becoming more extreme and constant, with hourly returns of +/- 2% occurring nearly every day since mid-December.
- Trading Volume: The average trade size on Coinbase has doubled since March. Also, Bitcoin markets recorded their highest daily volume ever.
- Order Book Liquidity: Market depth and spreads recovered more quickly after the January 11th price crash compared with the March crash, suggesting markets have become more resilient. Nonetheless, there still appears to be an overall shortage of bids and asks on Bitcoin order books.
- Volatility and Correlations: Measures for BTC volatility have not come close to all time highs despite the past few months' extreme price movements.
Intraday price movements are becoming more extreme
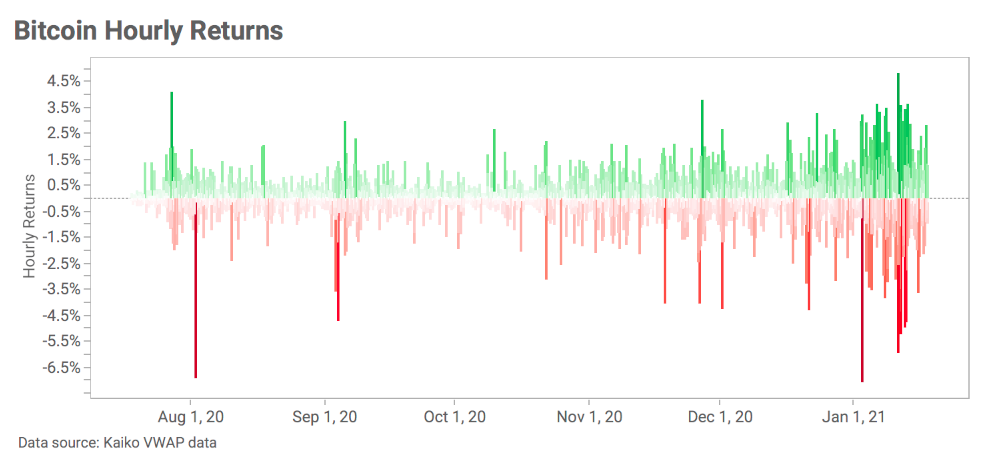
Bitcoin's record-breaking rally has resulted in one of the longest sustained periods of extreme intraday volatility ever recorded. Nearly every day since mid-December has seen at least one hourly price movement of +/-2%, a rare occurrence over the previous five months. In general, Bitcoin's positive price movements have been less extreme and more consistent than its negative movements, observable in the chart above.
Average trade size (in $) has doubled since March
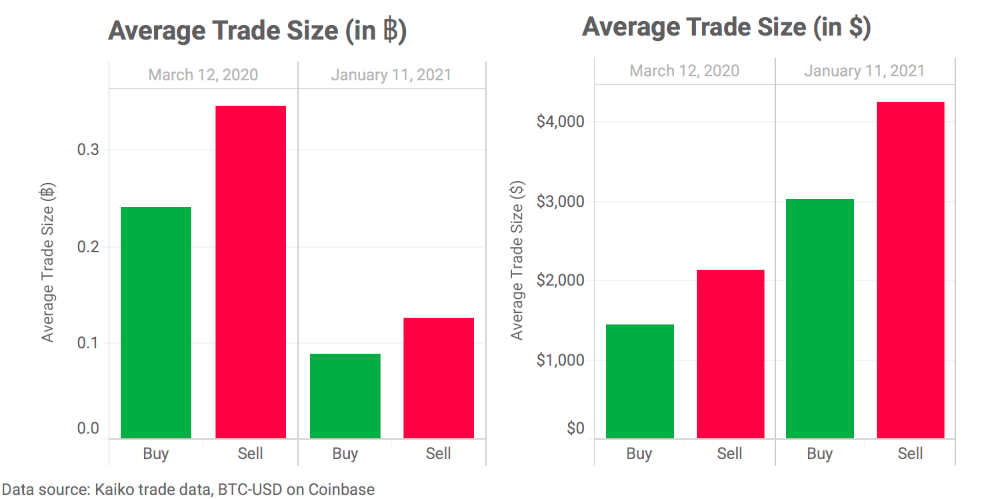
Typically, the more traders transacting on an exchange, the smaller the average trade size (which we observed in a research piece analyzing trade size on 11 exchanges). Although trade count and volumes have soared on Coinbase over the past few months, average trade sizes have nearly doubled since March. In the above chart, we compare the average trade size measured in $ and in BTC on March 12 and January 11, two days where large price crashes occurred. We analyzed the days surrounding the price crash (not shown), and found that the average trade size showed similar trends.
While the average trade size as measured in Bitcoin has dropped precipitously (which is expected as the price climbed), the dollar value of these trades has nearly doubled, which was a surprising observation. The data could indicate that the proportion of institutional traders to retail traders on Coinbase has increased since March. Many institutional traders break apart their large trades into smaller trades, which has likely influenced the overall average trade size.
Markets have become more resilient since March
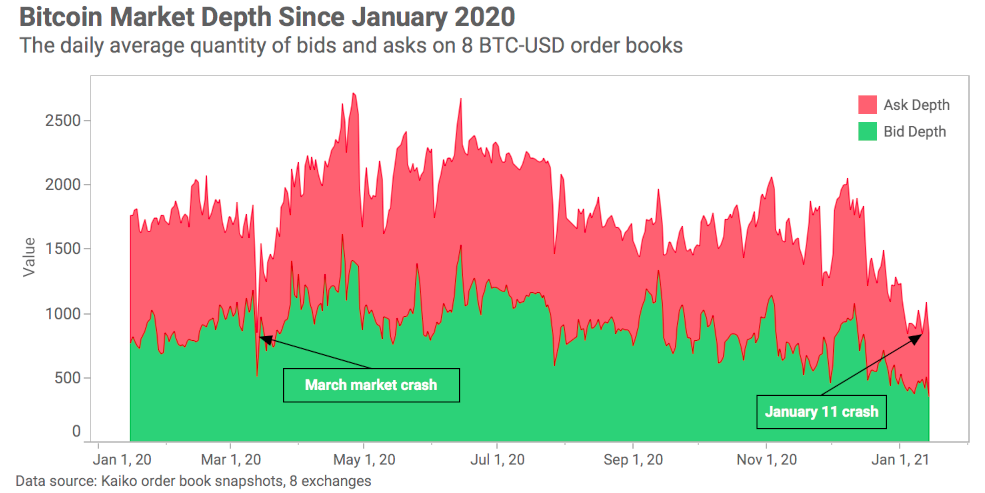
On January 11th, the price of Bitcoin fell more than $9k over the course of a day, resulting in the single highest daily trading volume in Bitcoin's history. During a typical extreme price movement, market makers adjust their positions to hedge for increased risk which can result in a temporary fall in market depth. During the March market crash, market depth all but dried up as the price of Bitcoin plummeted, observable in the chart above. During the most recent price crash, we can barely observe a dent in market depth, which is quite remarkable considering the sheer volume of trades that were executed. This suggests that markets have evolved since March and are better able to absorb extreme price movements without significant disruption to overall market liquidity.
Shortage of bids and asks persists
Although the price crash did not severely disrupt market liquidity, there still appears to be a longterm downturn in market depth. This trend has grown stronger over the past couple of months, which can be observed in the chart above starting around November.
Bitcoin's volatility is well below all time highs
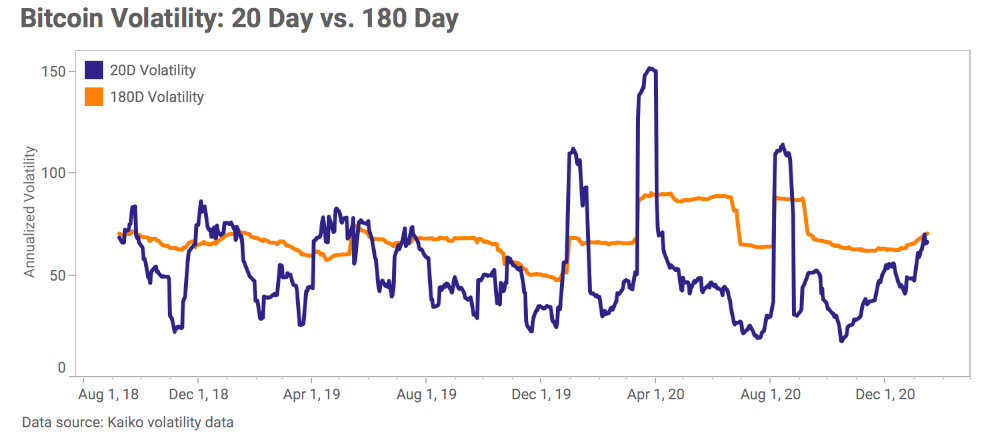
Despite extreme price movements over the past few months, Bitcoin's 20D and 180D volatility curves are still well below all time highs. One reason why volatility measures haven't increased as much as expected is because they are calculated using daily returns. Bitcoin has undergone extreme intraday price movements but has often ended the day close to where it began, which is why these price movements would not be reflected in volatility calculations. You can read a more in-depth analysis of the various methodologies for calculating volatility here.


