Close Menu
Crypto Valley Journal
    Facebook X (Twitter) Instagram
    Crypto Valley Journal
    • Hot Topics
      • News
      • Minds
    • Focus
      • Background
      • Blockchain
      • Legal & Compliance
      • Non-Fungible Token (NFTs)
    • Investing
      • Markets
      • Financial Products
      • Decentralized Finance (DeFi)
      • Exchange overview
    • Education
      • Basics
      • Glossary
      • Politicians on crypto
    • Statistics
      • Bitcoin-ETF-Flows
      • Ethereum-ETF-Flows
      • Crypto market data
      • On-chain data
    • Academy
      • Overview
      • Part 1: Blockchain
      • Part 2: Money
      • Part 3: Bitcoin
      • Part 4: Cryptocurrencies
      • Part 5: Decentralized Finance
      • Part 6: Investing
    • English
      • Deutsch
    Crypto Valley Journal
    You are at:Home » Markets » Monthly Rotationreport
    rotationreport

    Monthly Rotationreport

    By Patrick Heusser on 15. October 2020 Markets

    Monthly Rotationreport from Patrick Heusser, Crypto Finance AG

    Content

    • 1 Rotation Analysis
    • 2 Altcoin Futures Basis Analysis
    • 3 Top Ten Comparison
    • 4 Volatility and Correlation Comparison
    • 5 ETHBTC 4h Technical Chart Analysis
    • 6 Market Cap Overview
    • Glossary

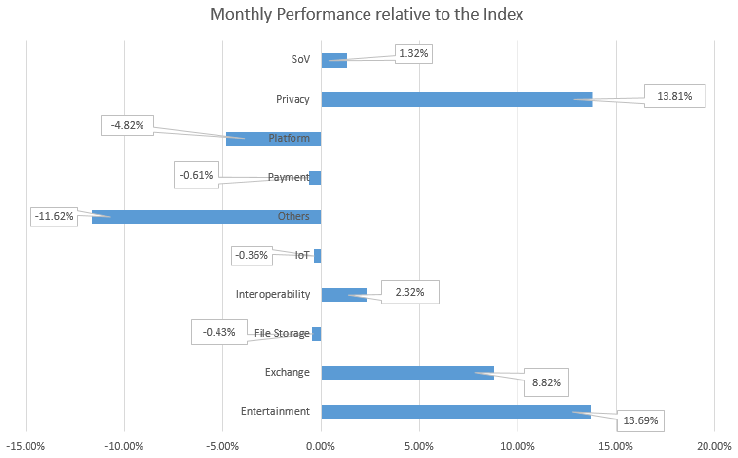
    1. Rotation Analysis

    Bitcoin is outperforming all sectors

    ALT, MID, and SHIT coins breached the support lines and traded lower without any substantial recovery. All three indices are currently trading on the recently revised support levels. The DeFi space saw a solid correction against bitcoin and the major altcoins. Market volatility within the DeFi space remains very high, and substantial corrections are to be expected.

    There has been quite a shift in the sectors. Entertainment, Exchange, and Privacy managed to outperform the Index. The losing sector was yet again Platform, while others performed similar to the index. The top performing coin was THETA, with am absolute gain of 43.5%. The worst performing coin was BTS, with an absolute loss of 65%. The FTX exchange announced a rebalancing of several indices going into effect on October 21st. Proposed changes are constituent composition, weights, and market caps.

    Attached you will find our short-term view on support and resistance levels for all three indices:

    Alt: Support 60.00 / Resistance 70.00 / Alt (4h)
    Mid: Support 72.00 / Resistance 82.50 / Mid (4h)
    Shit: Support 93.50 / Resistance 122.00 / Shit (4h)

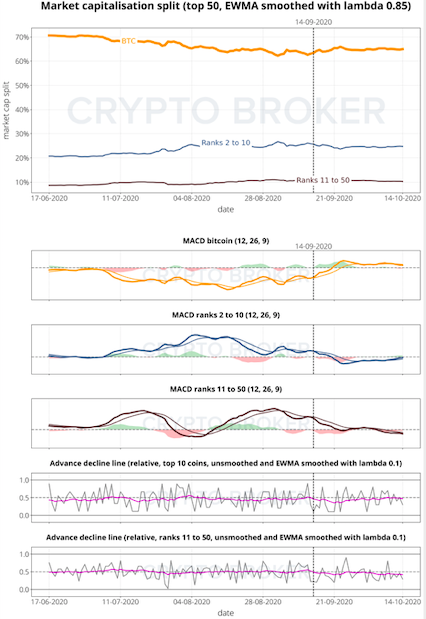
    Overall trading volume remained high. The MACDs for BTC increased and stabilised in a neutral zone. Bitcoin has basically outperformed all sectors and has stood its ground. Coins ranked between 2 and 50 corrected and are trading in a neutral to a slightly oversold zone.

    Figure 1: Sector Rotation

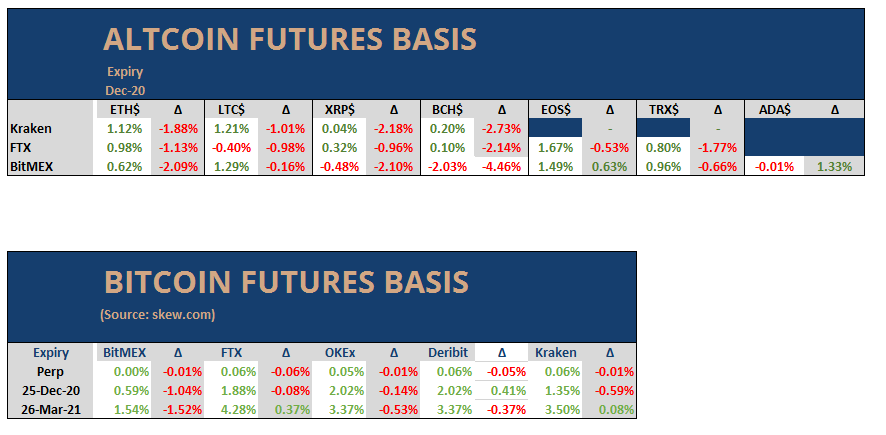
    2. Altcoin Futures Basis Analysis

    Due to the September contracts that rolled off the board, we had a bit of a hiccup. The delta percentage numbers do not make much sense. We apologise for this, and we will make sure to get this fixed in time for the next maturity in December.

    What we can say,though, is that all bases have turned from neutral (or slightly in backwardation) into contango. Only LTC is not playing along. I am explicitly excluding the BitMEX numbers since those bases are not market driven, but rather structural due to their legal issues and their single collateral setup.

    Our call from last month was spot on: the premium will build up again. Now, it is a question of how bitcoin performs. My guess is that if we see a steady increase in price, all bases will widen in their contango premiums. In case bitcoin has an explosive rally, altcoins could get crushed due to the massive liquidity vacuum bitcoin will then create. In case bitcoin moves back down towards 10.5k (or below), I expect the premium to turn flattish or even negative for some coins.

    Figure 2: Altcoin Futures Basis Overview

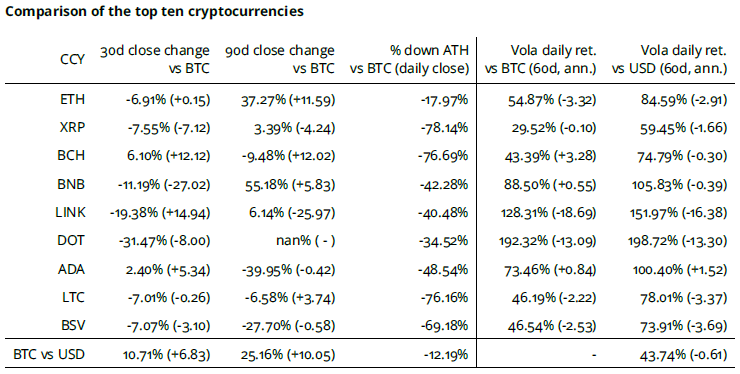
    3. Top Ten Comparison

    Table 1: Datasource: Coinmarketcap; change to last month in parentheses
    Table 2: Datasource: Coinmarketcap; change to last week in parentheses

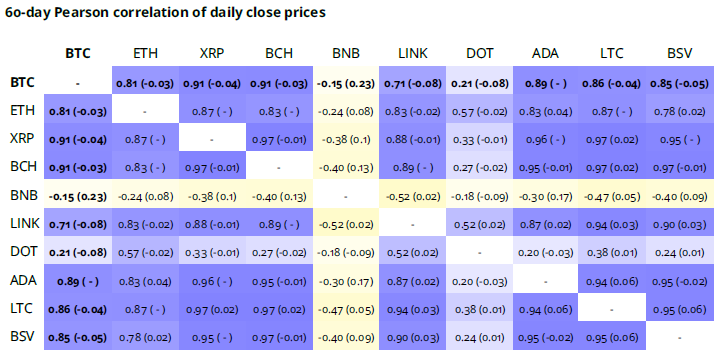
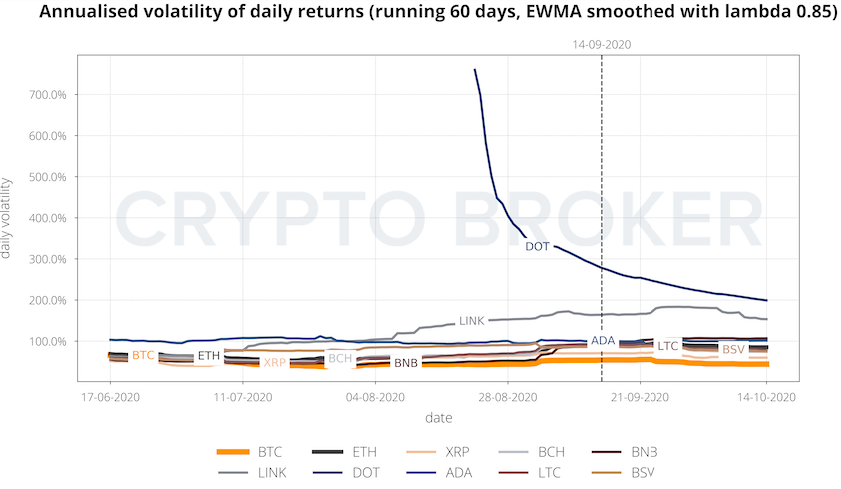
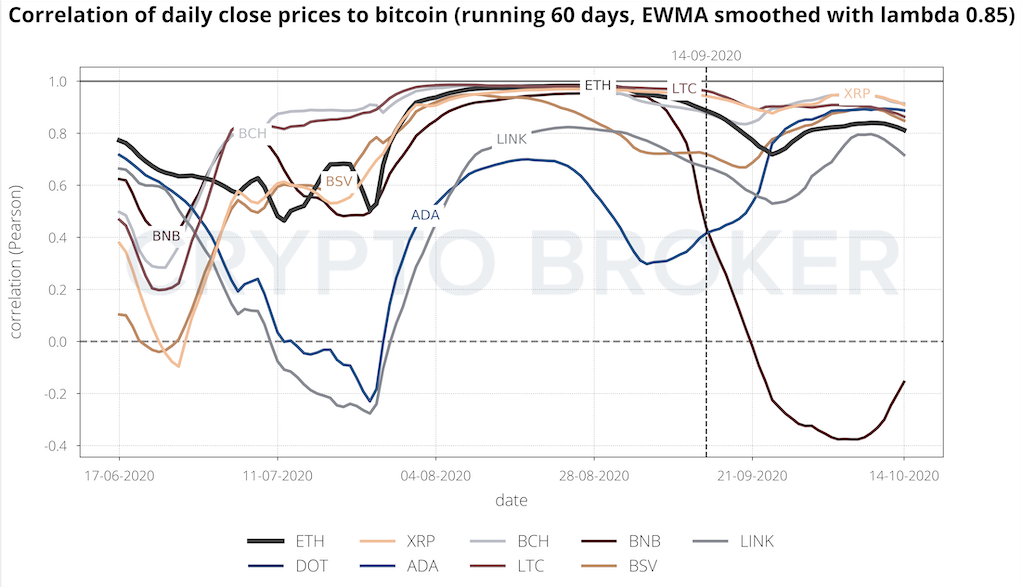
    4. Volatility and Correlation Comparison

    Figure 3: Volatility Comparison; Datasource: Coinmarketcap
    Figure 4: Correlation Comparison; Datasource: Coinmarketcap

    5.  ETHBTC 4h Technical Chart Analysis

    Figure 5: Datasource: Bitfinex; Chartsystem: Tradingview

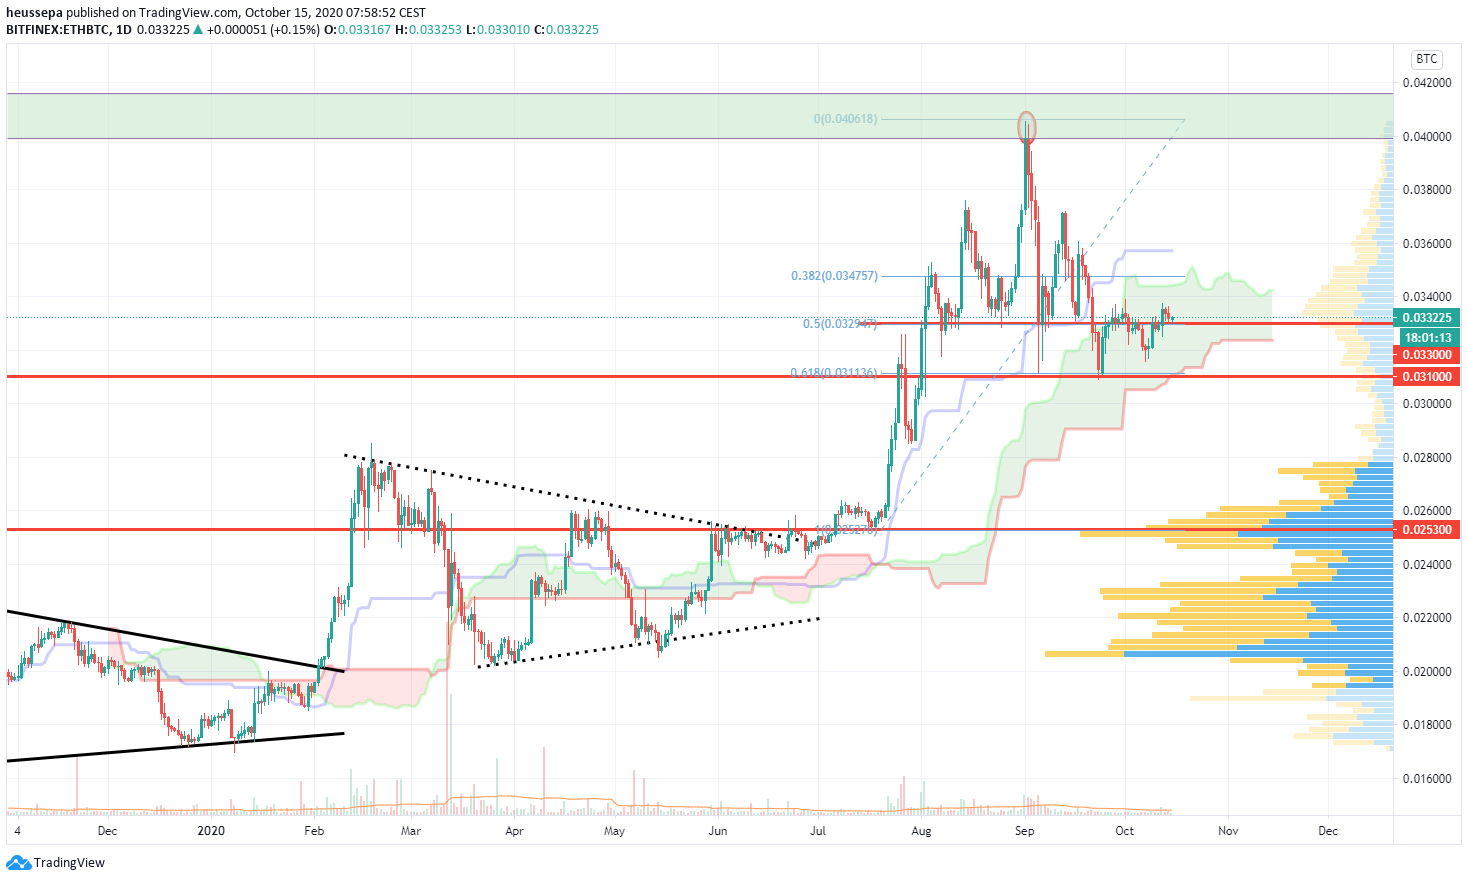
    ETHBTC is hanging in there...

    Today, we will be focussing on the daily chart (image above) instead of on the 4h one. It makes more sense to do this due to the new monthly cycle.

    The parabola break is providing a good support point. We touched the 0.03100 level three times. To me, the neutral zone is around 0.03300, which is where we are currently trading. It is also in the middle of the Ichimoku cloud, which is still bullish. We are rather far away from the baseline (blue line), which leads me to believe that we might see some consolidation at the current levels for a bit longer.

    To establish fresh long positions I need to see the price pushing through the upper band of the cloud, and (if possible) also through the baseline.

    I will look for short setups below 0.03100.

    View the charts: ETHBTC (4h) | ETHBTC (daily)

    6. Market Cap Overview

    Figure 6: Market Cap Overview; Datasource: Coinmarketcap

    Glossary

    Advance Decline Line - the Advance Decline Line shows the ratio of coins for which the market cap increased relative to the market cap of BTC for each day.
    ATH - all time high (maximum lookback period of 730€ days).
    Data Source - tables and charts are based on daily close prices provided by Coinmarketcap.
    EWMA - exponentially weighted moving average.
    MACD - moving average convergence/divergence is a popular technical indicator to identify trends in the underlying instrument. It consists of the MACD and signal line, and the area shown in the background. The MACD line (strong) is the difference of two exponential moving averages, which are defined by the first and second parameter of the indicator. The signal line (weak) is the exponential moving average of the MACD line defined by the third parameter. The area in the background illustrates the difference between the MACD line and the signal line.
    Pearson Correlation - quantifies the linear relationship between two variables.
    Spearman Correlation - quantifies the monotonic relationship between two variables. As such, the Spearman Correlation is based on the ranked values of each variable and is used to detect non-linear relationships between the two.


    Copyright © 2021 | Crypto Broker AG | Alle Rechte vorbehalten.
    Diese Publikation und ihr Inhalt, einschliesslich aller Namen, Logos, Designs und Marken sowie aller damit verbundenen Immaterialgüter- und sonstigen Rechte sind Eigentum der Crypto Broker AG oder Dritter. Sie dürfen ohne deren vorherige Zustimmung nicht vervielfältig oder weiterverwendet werden.

    Haftungsausschluss
    Alle Angaben in dieser Publikation erfolgen ausschliesslich zu allgemeinen Informationszwecken. Die in dieser Publikation zur Verfügung gestellten Informationen stellen keine Anlageberatung dar und sind auch nicht als solche beabsichtigt. Diese Publikation stellt kein Angebot und keine Empfehlung oder Aufforderung für eine Anlage in ein Finanzinstrument einschliesslich Kryptowährungen und dergleichen dar und ist auch nicht als solches Angebot, Empfehlung oder Aufforderung beabsichtigt. Diese Publikation ist nicht für Werbezwecke bestimmt, sondern dient nur der allgemeinen Information. Die in der Publikation enthaltenen Inhalte stellen die persönliche Meinung der jeweiligen Autoren dar und sind nicht als Entscheidungsgrundlage geeignet oder beabsichtigt. Alle Beschreibungen, Beispiele und Berechnungen in dieser Publikation dienen nur der Veranschaulichung. Obwohl bei der Erstellung dieser Publikation mit üblicher Sorgfalt darauf geachtet wurde, dass die Angaben zum Zeitpunkt der Veröffentlichung zutreffend und nicht irreführend sind, übernimmt die Crypto Broker AG keinerlei Gewähr oder Garantie, weder ausdrücklich noch stillschweigend, in Bezug auf die darin enthaltenen Informationen, deren Marktfähigkeit oder Eignung für einen bestimmten Verwendungsweck oder hinsichtlich ihrer Genauigkeit, Richtigkeit, Qualität, Vollständigkeit oder Aktualität. Die Crypto Broker AG schliesst jede Haftung und Verantwortlichkeit für die Verwendung der in der Publikation enthaltenen Informationen, auch durch Dritte, im Zusammenhang mit Handels- oder anderweitigen Aktivitäten aus und ebenso für allfällige Fehler oder Unvollständigkeiten, welche in dieser Publikation enthalten sind.

    Risikohinweis
    Anlagen und Investitionen, insbesondere in Kryptowährungen, sind grundsätzlich mit Risiko verbunden. Der Totalverlust des eingesetzten Kapitals kann nicht ausgeschlossen werden. Kryptowährungen sind sehr volatil und können daher in kurzer Zeit extremen Kursschwanken ausgesetzt sein. Eine Nutzung der Informationen aus dieser Publikation erfolgt ausschliesslich und einzig auf eigenes Risiko des Nutzers. Ein Nutzer sollte sich in jedem Fall vor einer Anlage- und Investitionsentscheidung über die damit verbundenen Risiken im Klaren sein und sich bei Bedarf geeignet beraten lassen.

    Share. Facebook Twitter LinkedIn Email Telegram WhatsApp

    About the author

    Patrick Heusser

      Patrick Heusser is Head of Trading at Crypto Broker AG. Prior to joining the company, Patrick worked as an Interest Rate Trader at UBS and held various positions in the IRCC (interest rate, commodity and foreign exchange trading) in London, New York, Singapore and Zurich. Patrick is an expert in trading and risk management. He also gained experience in other areas, such as building start-up companies. Patrick has a degree in banking from a business school. He has also taken various courses in technical chart analysis.

      Related Articles

      Crypto Market 2026: Bitcoin Supply Tightens, Altcoins Remain Fragmented

      Bitcoin regime shift in question as April rally pushes BTC above $80k, with $2.4 billion in ETF inflows and patient capital building support.

      Spring cleaning: Bitcoin tests the regime shift above $80k

      Bitcoin fails again at the 80'000 USD mark, profit-taking weighs on ETH, SOL and XRP despite Strategy purchase and ceasefire.

      Bitcoin price climbs to 80’000 USD – profit-taking hits ETH, SOL and XRP

      Heatmap
      Search
      Senator Warren accuses the OCC of granting illegal trust bank charters to nine crypto firms, including Coinbase and Ripple, citing the National Bank Act.
      19. May 2026

      Warren accuses OCC of illegal crypto trust charters

      Die Bank of England prüft Alternativen zu Haltelimits für Sterling-Stablecoins. Branchenkritik trifft auf konservative Reservepflichten.
      19. May 2026

      Bank of England opens up to alternatives for stablecoin holding limits

      PostFinance opens its crypto offering with 22 coins to Swiss corporate clients. Custody runs via Sygnum, execution only, starting in May 2026.
      19. May 2026

      PostFinance opens crypto offering to corporate clients

      Latest Crypto Fear & Greed Index

      twitter image button instagram image button linkedin image button youtube image button

      About Crypto Valley Journal
      About Crypto Valley Journal

      On the pulse of the movement

      • Academy
      • Contact
      • Advertising
      • About us
      • Partner
      • Imprint
      • Privacy
      • Disclaimer
      Search

      Type above and press Enter to search. Press Esc to cancel.