
A summarizing review of what has been happening at the crypto markets of the past week. A look at trending sectors, liquidity, volatility, spreads and more. The weekly report in cooperation with market data provider Kaiko.
The last 7 days in cryptocurrency markets:
- Price Movements: Cryptocurrency markets experienced a sharp pullback over the weekend, with BTC dipping below $50k.
- Volume Dynamics: Centralized stablecoins account for a majority of all volume on the leading DEXs.
- Order Book Liquidity: Spreads spiked on all exchanges and have yet to recover.
- Derivatives: Open interest plunged and funding rates turned negative following a wave of long liquidations.
- Macro Trends: The ProShares Bitcoin ETF has surpassed the largest Canadian spot ETF in AUM.
Crypto markets take a tumble
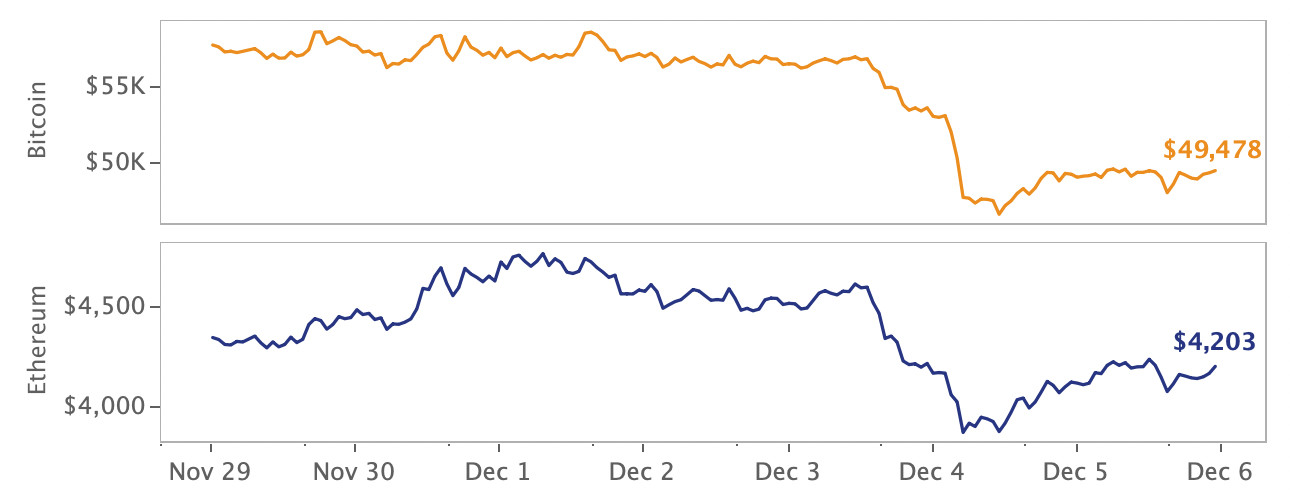
Bitcoin closed the week down 14% and Ethereum down 3% following a sharp market-wide pullback over the weekend. Bitcoin is acting more like a risk asset, dipping alongside equities, while Ethereum appears less affected by global market jitters, recovering most losses as of Sunday night. Markets are on edge following the Fed's statement acknowledging that inflation is no longer transitory, disappointing job growth in the U.S., and the new Omicron variant.
In more positive industry news, an ex-Citi exec launched a $1.5b crypto fund, DEX aggregator 1inch closed a $175m Series B (1inch market data is now available through Kaiko's DEX Data Feed), and payments company Square changed its name to Block to reflect its crypto focus.
Tether trades at a premium following market crash
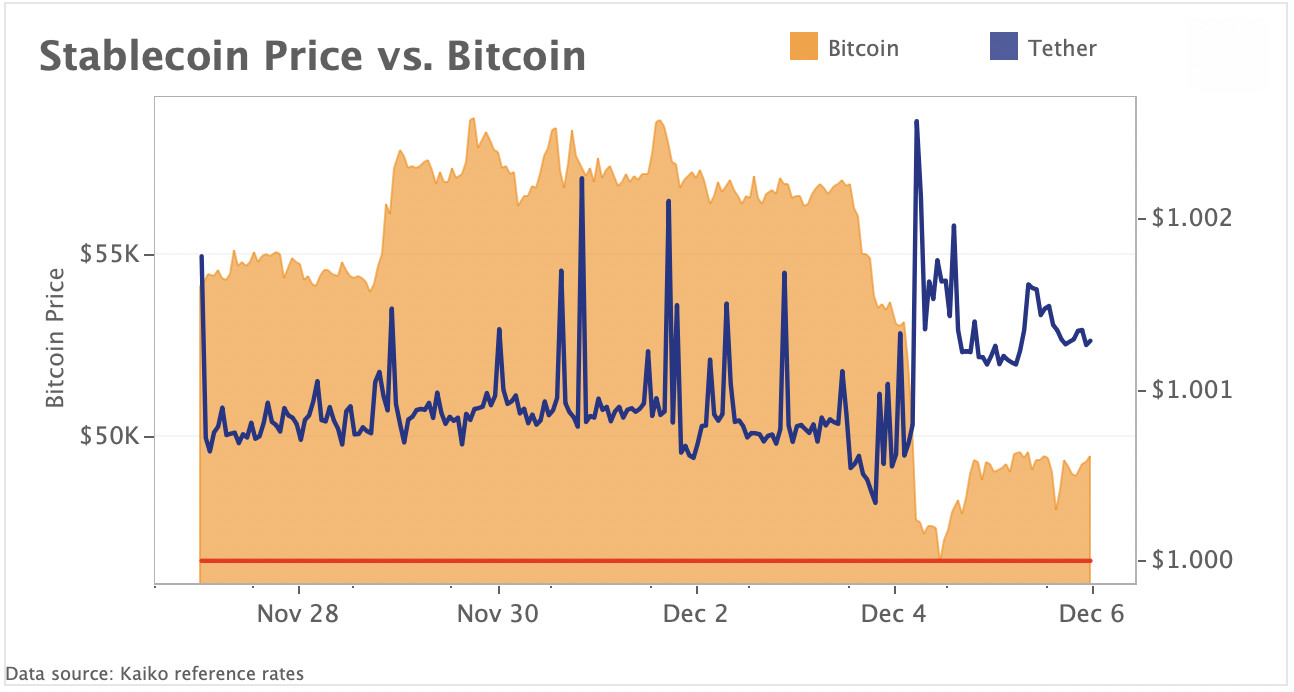
Tether (USDT), the largest stablecoin by market cap, traded at a premium as Bitcoin plummeted $6.5k over 24 hours. USDT is pegged 1-to-1 to the U.S. Dollar. However, its price often fluctuates based on market volatility because stablecoins are treated like risk-off assets during times of market turmoil as traders rotate funds from Bitcoin to Tether. This weekend’s sell-off was no different, causing Tether’s USD exchange rate to rise to $1.003. Tether’s premium persisted over the weekend suggesting strong BTC selling pressure and continued market uncertainty.
Centralized stablecoins pose a risk to DeFi
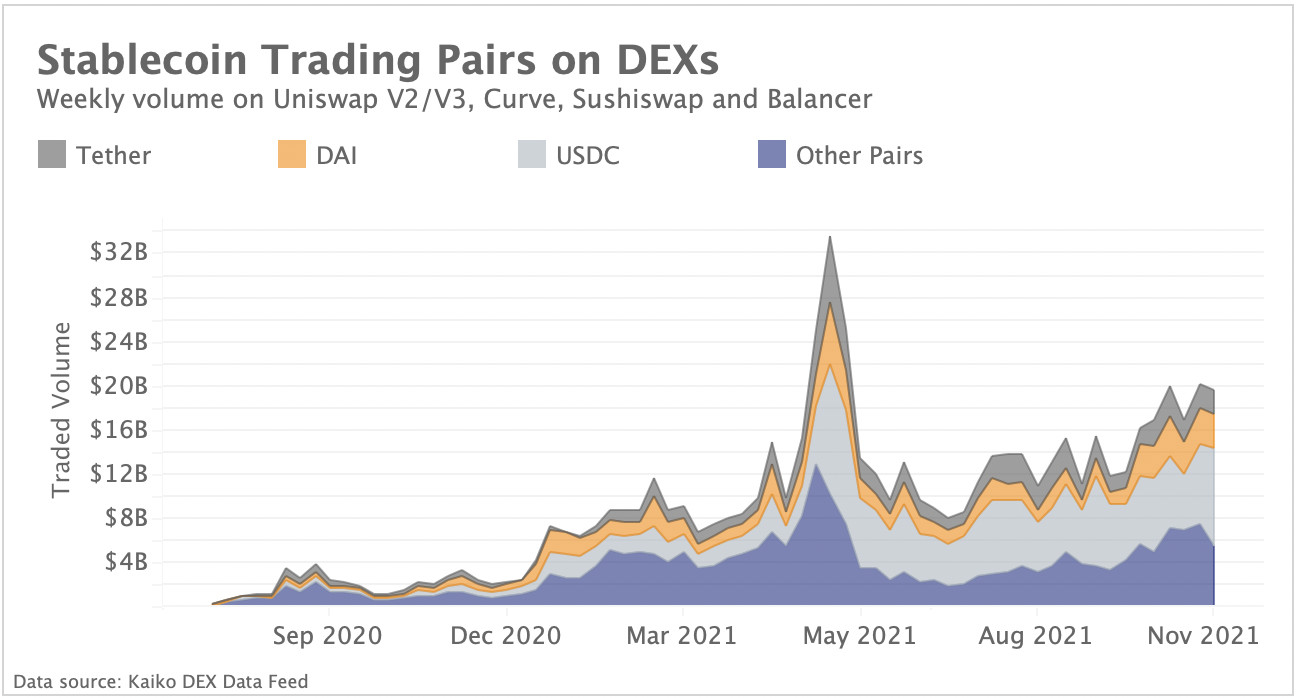
The top three stablecoins on decentralized exchanges (DEXs) today account for ~75% of total trading volume, which poses a potent risk for all decentralized markets should any of the three de-peg or collapse. Tether and USDC are issued by centralized entities which are both facing heavy regulatory scrutiny, particularly surrounding the makeup of their reserves. DAI is a decentralized algorithmic stablecoin, but USDC accounts for a significant portion of collateral, which makes the stablecoin also subject to the risks of centralization. A potential stablecoin collapse could seriously harm decentralized markets.
Today, USDC is the largest stablecoin used on DEXs and accounts for 45% of total volume (~$9b in weekly volume) across all pairs of which it is either the base or quote asset. Circle, the company behind USDC, has taken the regulatory-friendly route, which means that they could technically blacklist holders of USDC, an ability counter to the ethos of decentralized finance. The stablecoin problem is evidence that it is very hard to build a completely decentralized financial system without the inherent risks of centralization.
Uniswap is the dominant DEX
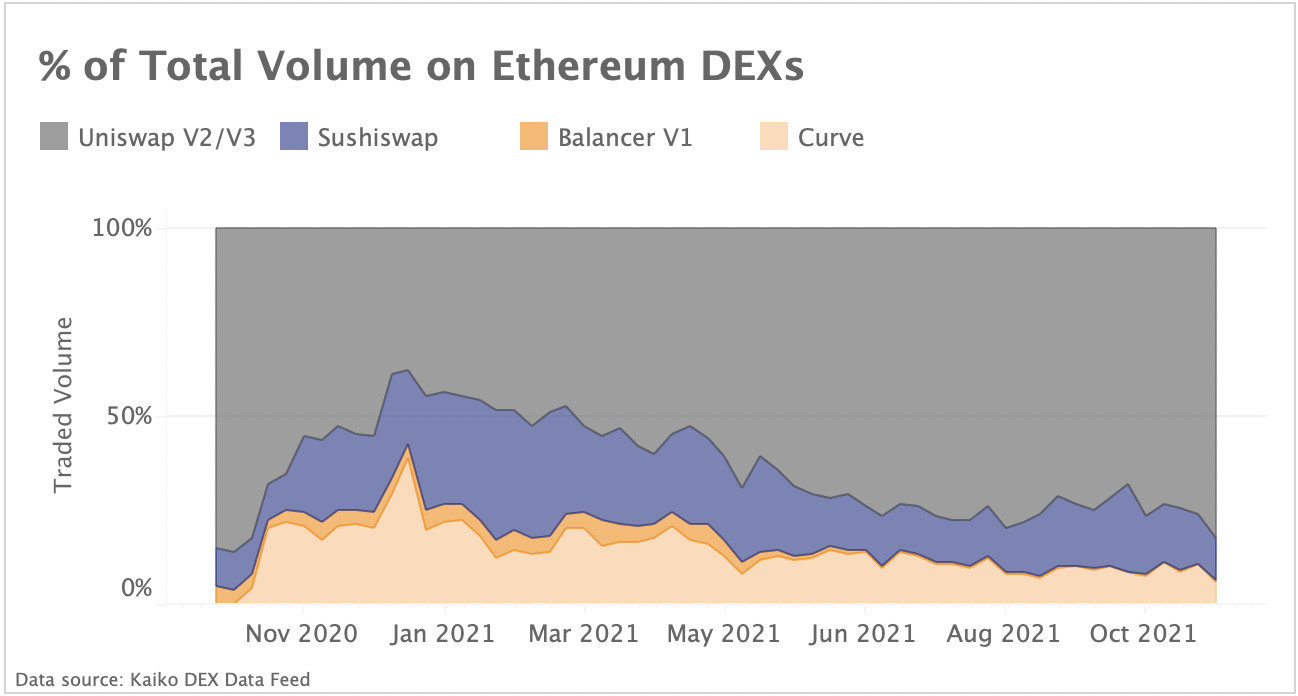
The vast majority of DEX volume today is executed on Uniswap (both V2 and V3). Kaiko's DEX Data Feed tracks the largest Ethereum DEXs, covering 95% of total volume, and Uniswap accounts for 80% of this with a market share rising sharply since January of 2021. Sushiswap's market share peaked in January at 30%, and since then has fallen to 11%, while Curve's market share peaked at 39% and has since fallen to 6%. Uniswap has remained innovative in a highly competitive DEX environment by offering tiered fees and a unique liquidity model. However, high transaction fees on the Ethereum blockchain still pose a huge barrier to adoption for all DEXs, which could push users to other Layer 1s.
Bitcoin open interest plunges as markets crash
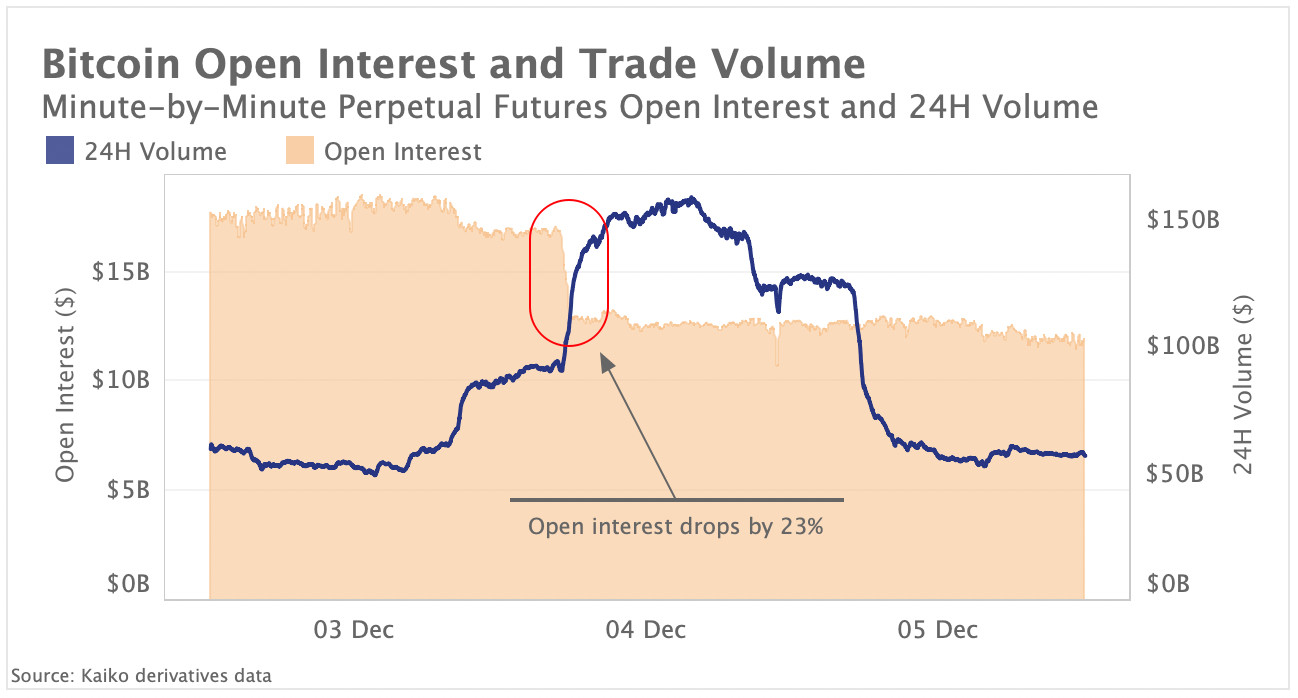
Bitcoin perpetual futures open interest plunged by -23% in just one hour this Saturday following a sharp drop in spot prices. More than $840bn worth of long positions were liquidated over 24h according to data from the Block. Above, we chart the minute-by-minute BTC open interest and trade volume on Dec 3-5. We can observe that trade volume surged by over 40% to $127bn in a single hour while the amount of open contracts decreased sharply. The drop was most dramatic on Bybit, which saw ~45% of open contracts wiped out. Funding rates turned consistently negative on all exchanges for the first time since early September (charted below).
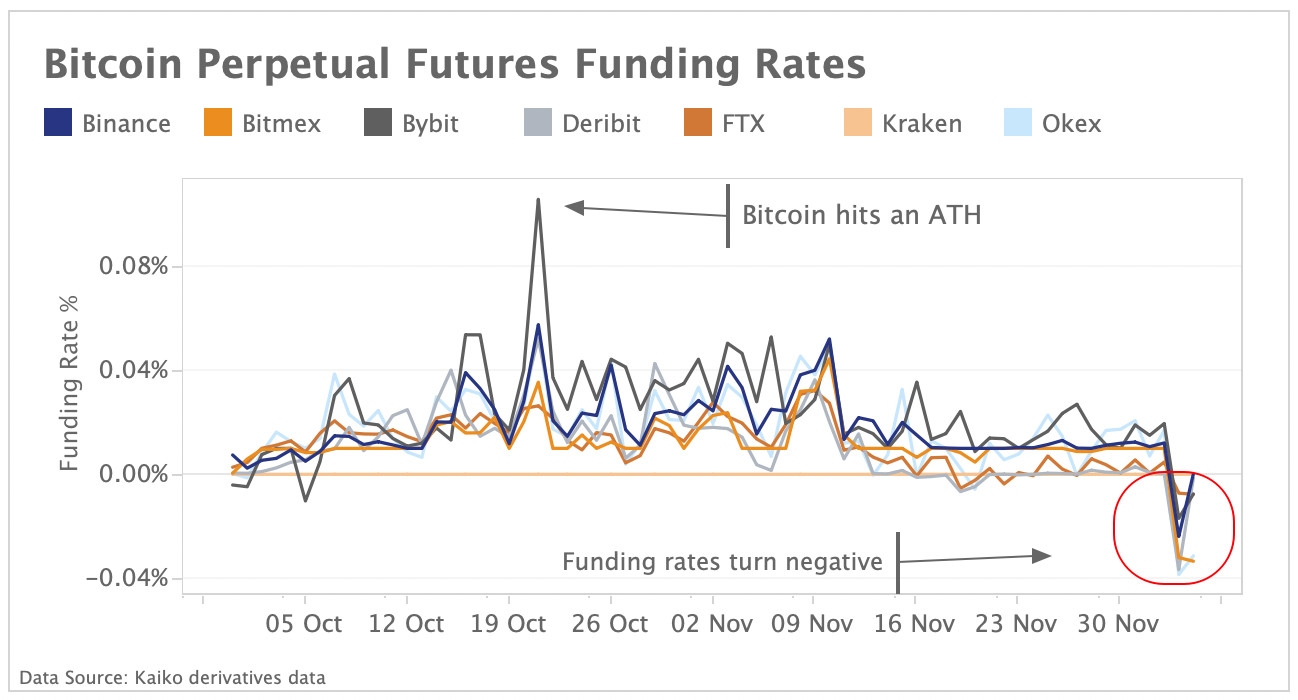
Funding rates are the cost of holding a long position and are seen as a gauge of market sentiment and leverage. Both open interest and funding rates have not recovered following the crash and are now near September lows, suggesting overall bearish sentiment.
ProShares ETF surpasses Canadian counterparts
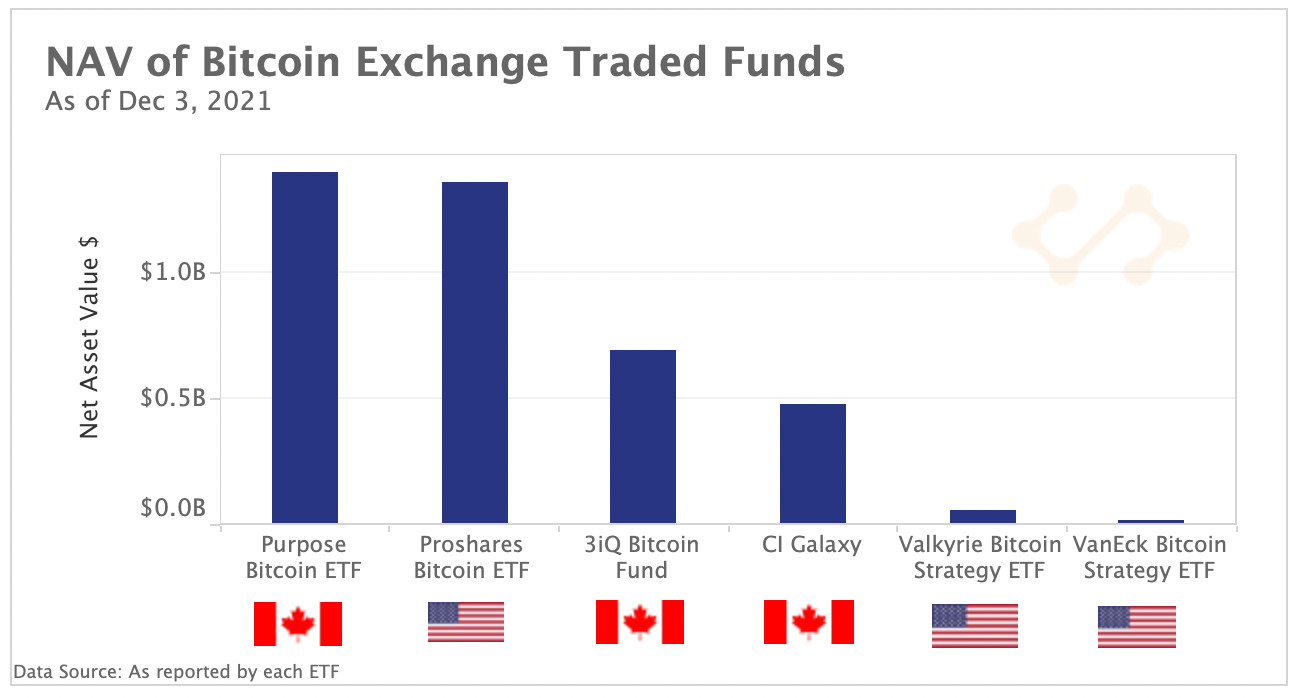
Above, we chart the net assets of the three futures-based ETFs trading on the NYSE in addition to the largest spot-based ETFs trading in Canada. Canada was the first country to approve a spot-based Bitcoin ETF in February 2021, yet we can observe that the American ProShares futures-based ETF has just overtaken the Purpose ETF in net assets. The ProShares ETF, which started trading in October, commands a market share of over 95% in the United States with NAV exceeding $1.4 Billion, evidencing its first mover advantage. VanEck's ETF, which started trading in November, has failed to capture investor attention despite lower fees of 0.65% relative to ProShares’ 0.95%. Valkyrie's ETF is fairing slightly better, with $58M in net assets. Last week, Fidelity launched a spot-based Bitcoin ETF in Canada after the SEC rejected yet another American spot-based ETF.


Markets grapple with rising uncertainty
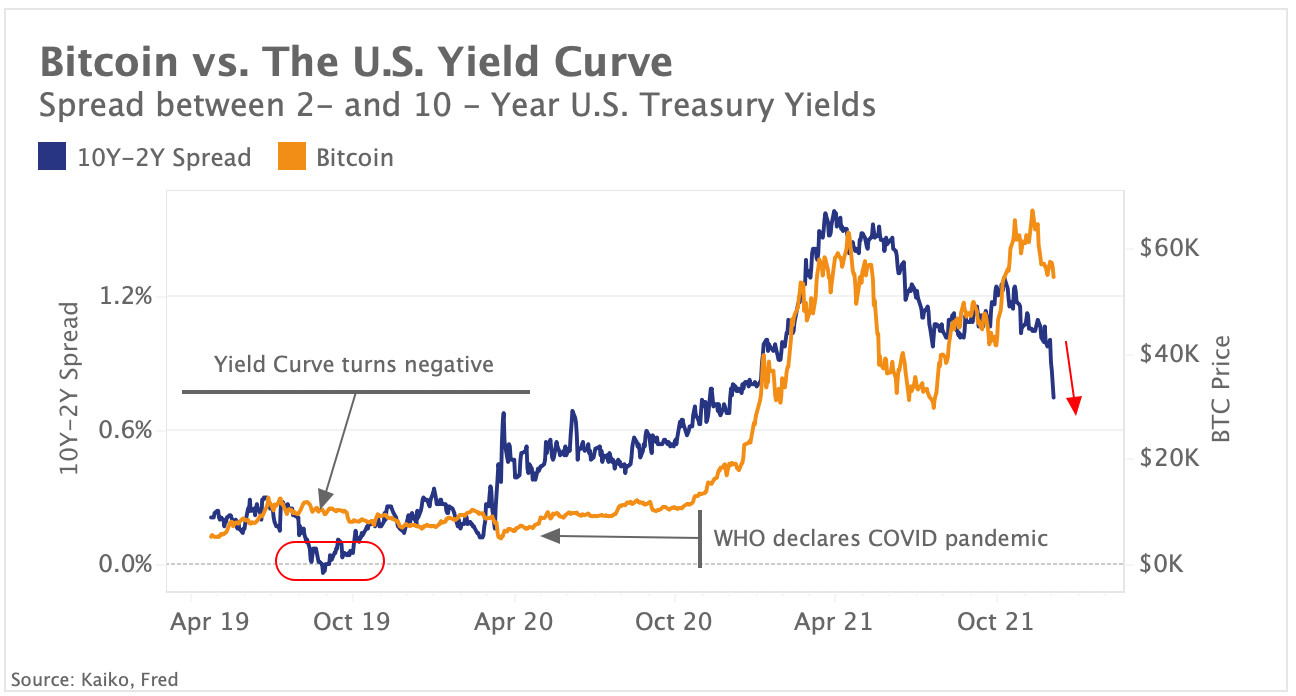
Risk assets had another choppy week as markets continued to grapple with rising uncertainty. Bitcoin tumbled over the weekend following a sell-off in traditional stocks on Friday. Above, we chart the spread between 2- and 10-year U.S. Treasury yields – the yield curve, along with the price of Bitcoin. The yield curve shows the relationship between long- and short-term interest rates of U.S. Treasuries. Typically, a negative or inverted yield curve is seen as a precursor to a recession while a positive (steep) yield curve has historically been correlated with stronger economic activity and a stock market rally.
We observe that despite being far from inverted, the yield curve flattened by 25 basis points last week, its largest weekly drop since 2012. Hawkish comments by the Fed chair Jerome Powell and a strong U.S. job report reinforced traders’ expectations for an earlier stimulus withdrawal, pushing policy-sensitive short-term yields up. Long-term interest rates extended their slide from end-November as the Omicron Covid variant - detected in the U.S. last week - is expected to negatively impact growth.


