


A summarizing review of what has been happening at the crypto markets of the past week. A look at trending sectors, liquidity, volatility, spreads and more. The weekly report in cooperation with market data provider Kaiko.
The last 7 days in cryptocurrency markets:
- Price Movements: Stablecoins have become a lot less volatile over time as their use throughout the industry grows.
- Volume Dynamics: Coinbase listed five times as many crypto assets in 2021 compared with 2020.
- Order Book Liquidity: Liquidity is fragmented across sectors, with Metaverse tokens possessing the best bid-ask spread.
- Derivatives: Open interest for Bitcoin perpetual futures fell by 10% following last week's market volatility.
- Macro Trends: The yield curve flattened to its lowest level since March 2020, which suggests rising concern about the Fed's policy.
Fragile recovery falters amid geopolitical tension
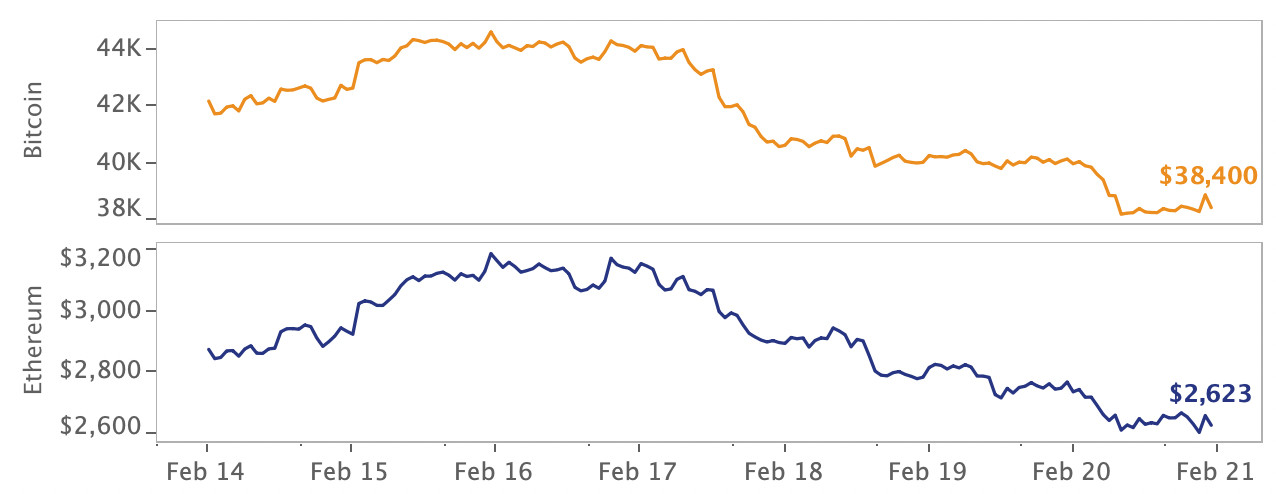
Risk assets had another choppy week fueled by rising geopolitical uncertainty and jitters over monetary tightening. Bitcoin fell below the psychological level of $40K and Ethereum below $2,800, losing all gains from the beginning of the month. Metaverse tokens, which have led February’s fragile crypto recovery, also lost traction despite outperforming both the broader crypto market and metaverse-related stocks. On the regulatory front, BlockFi reached a $100mn settlement with the U.S. Securities and Exchange Commission (SEC) and Canada sanctioned 34 crypto wallets tied to the funding of trucker-led protests against the country’s vaccine mandate. Meanwhile, JP Morgan became the first bank to launch in the Metaverse.
Stablecoins have become more stable over time
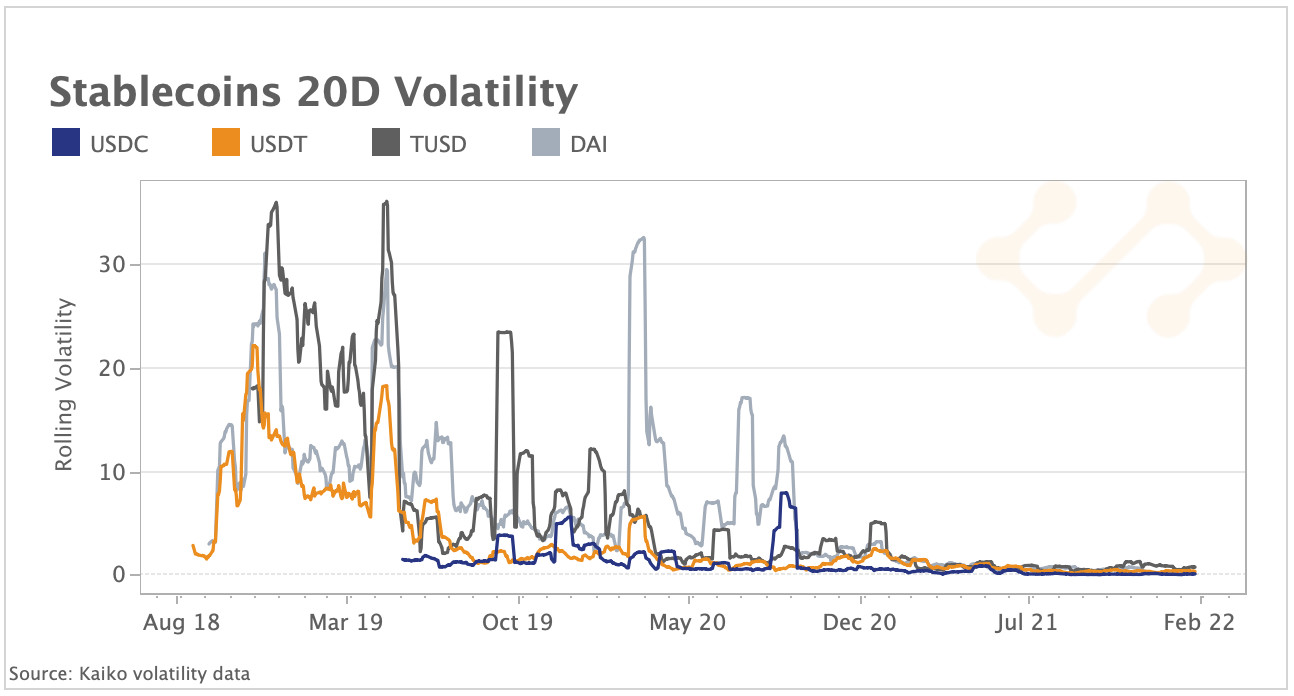
The stablecoin market has grown significantly since 2020 in large part due to their growing use in decentralized finance applications (DeFi), as margin for derivatives and as the denominating currency for centralized spot markets. Today, nearly 1/4th of all spot instruments listed on centralized exchanges are denominated in stablecoins. The top stablecoins are pegged 1:1 to the U.S. Dollar, using a collateralization by cash or securities as a stabilization mechanism.
In times of market volatility, stablecoins can deviate from their peg as traders rotate from riskier altcoins and rapidly exit their positions. However, although arbitrage opportunities still exist, volatility for stablecoins on centralized exchanges has declined significantly. Above we chart the 20-day rolling volatility for four of the largest stablecoins using USD-denominated pairs trading on crypto-to-fiat exchanges. We observe that until 2020, volatility varied between 10% and 35%. It has declined significantly since and is currently lower than 5%. Despite boasting a larger supply ($78bn) and higher liquidity, Tether’s USDT is slightly more volatile than its rival USD Coin – USDC ($52bn).
Metaverse crypto tokens fare better than equities
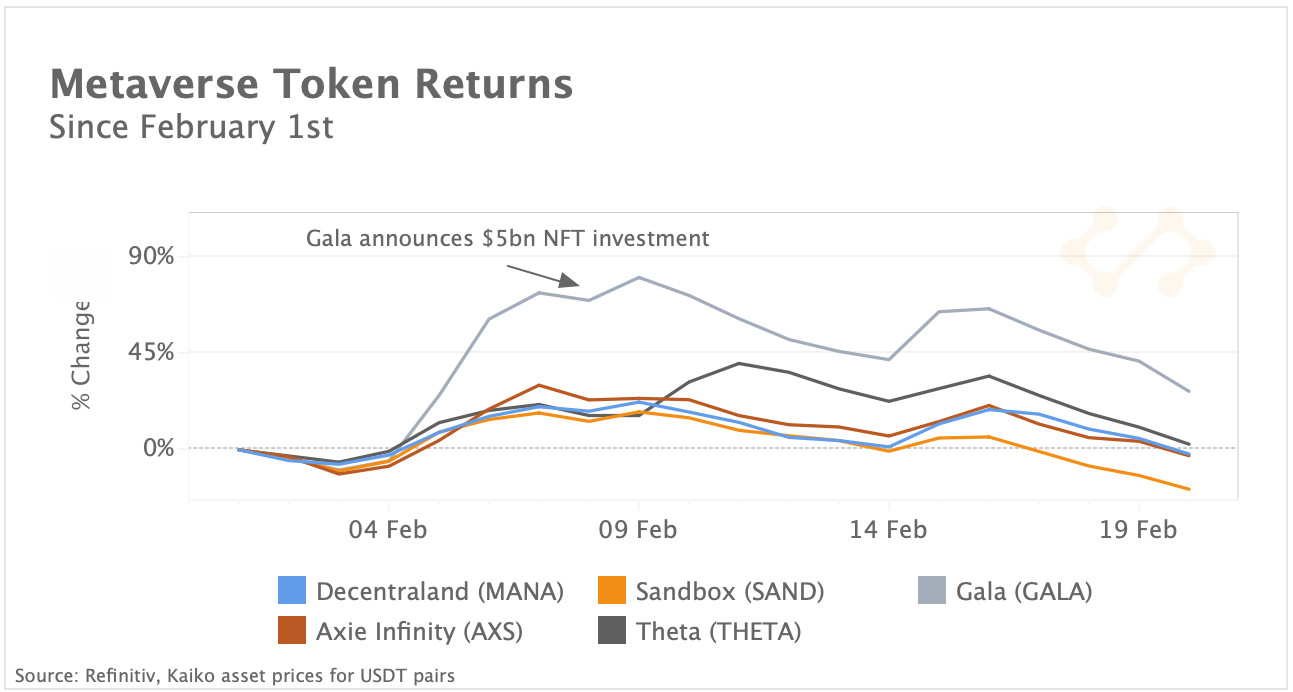
Last week, gaming platform Roblox followed Meta (ex. Facebook) in reporting disappointing earnings and plummeted by more than 25% in a single day. Since the start of the month, Meta’s stock price has fallen more than 30% in a sign that investors lack confidence in the company’s pivot towards the metaverse. By contrast, metaverse-related crypto tokens -encompassing the intersection of decentralized gaming, NFTs, and virtual worlds - have performed better, with several up for the month or recording limited losses.
Gala Games’s GALA jumped over 27% since the start of the month after the platform announced it will invest $5bn within the next year to boost its NFT offerings and build a theme park. Theta Network’s token THETA is still up 3% in February after inking a partnership with Samsung to offer digital collectibles. Decentraland’s MANA and Axie Infinity’s AXS lost some of their gains following last week’s sell-off and are down 3%.
Coinbase lists 5x more assets in 2021
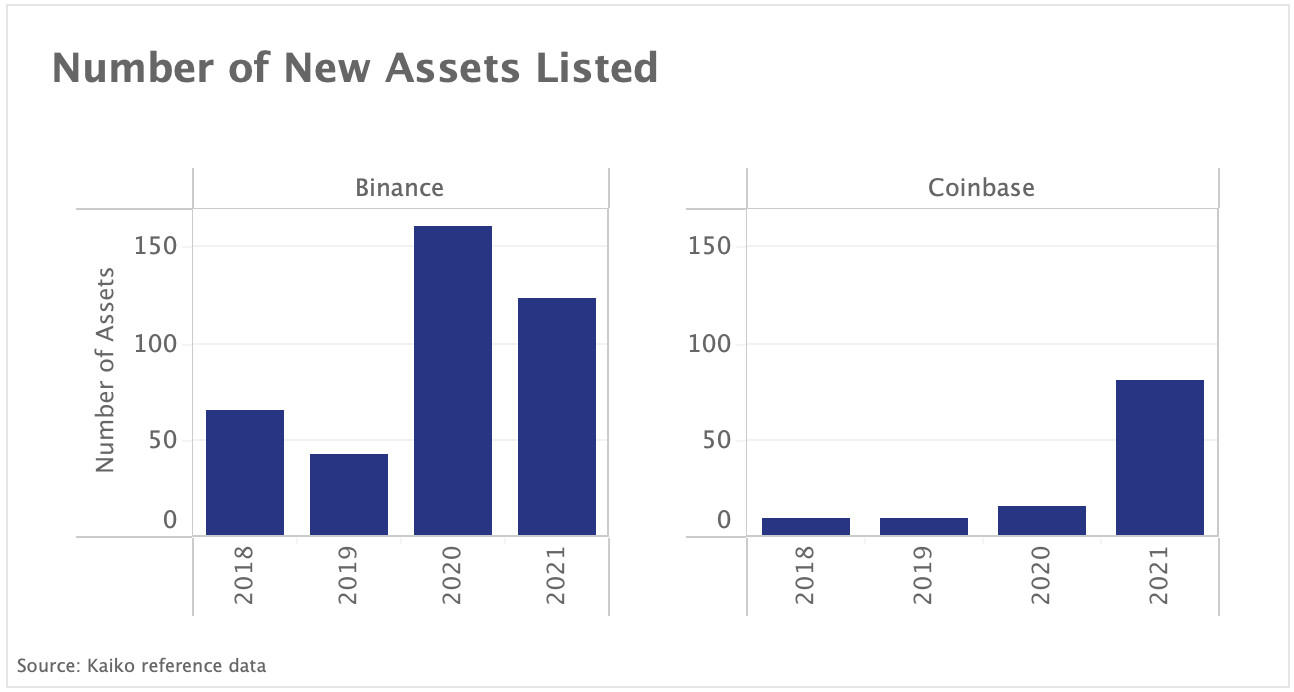
Coinbase listed five times as many new crypto assets in 2021 compared with 2020. Historically, Coinbase has been rather conservative in adding new assets to its platform, but the exchange’s strategy shifted in 2021 to more closely imitate its rivals like Binance and FTX, which employ rapid listing strategies. Binance listed assets at a quicker pace in 2021, although it saw a dip in listings compared with the previous year. Coinbase’s new listing approach is in line with growing investor interest in altcoins as well as rising competition from decentralized exchanges (DEXs) which allow anyone to list a token without permission.
However, it also coincides with rising involvement of centralized exchanges in venture activity. The venture arm of major exchanges such as Coinbase, Binance, FTX and Crypto.com are among the biggest investors in the nascent crypto ecosystem, including projects that offer tokens that are listed on their platforms, posing a potential conflict of interest.
Gold-backed stablecoins see uptick in volume amid geopolitical uncertainty
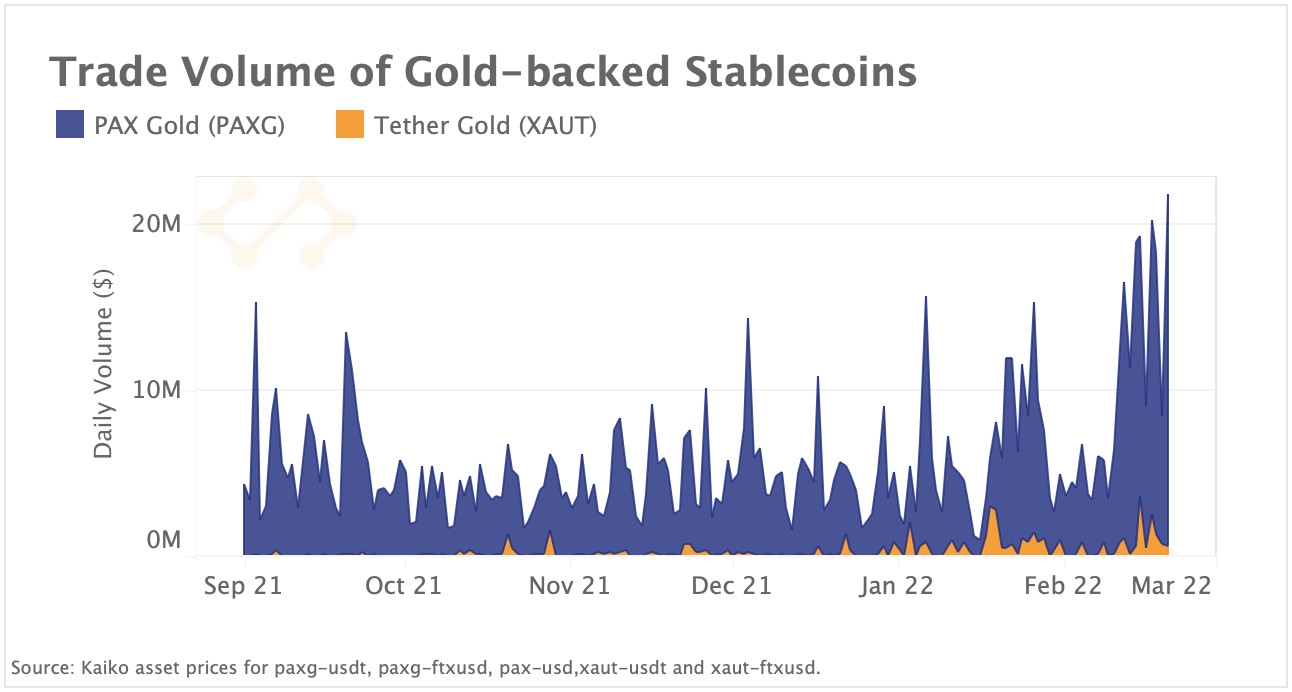
The past month’s geopolitical instability and high inflation has boosted the appeal of gold, which has gained 5% since the start of February, hitting a multi-month high. Gold-backed stablecoins - which are digital tokens backed by physical gold - have also undergone an uptick in trade volume on centralized exchanges. Above, we chart the daily trade volume for the two largest tokens by market cap, Tether Gold (XAUT) with a market cap of $200m, and PAX Gold (PAXG) with a market cap of $420m. We can observe that PAX Gold volumes have nearly doubled since September and Tether Gold volumes have also seen a slight surge in trading. Overall, USD-pegged stablecoins remain dominant in terms of market cap and trade volume, with gold-backed stablecoins offered on only a handful of exchanges. However, this unique investment product could serve as an alternative safe-haven more familiar to traditional investors.
Open interest falls while derivatives volume remains low
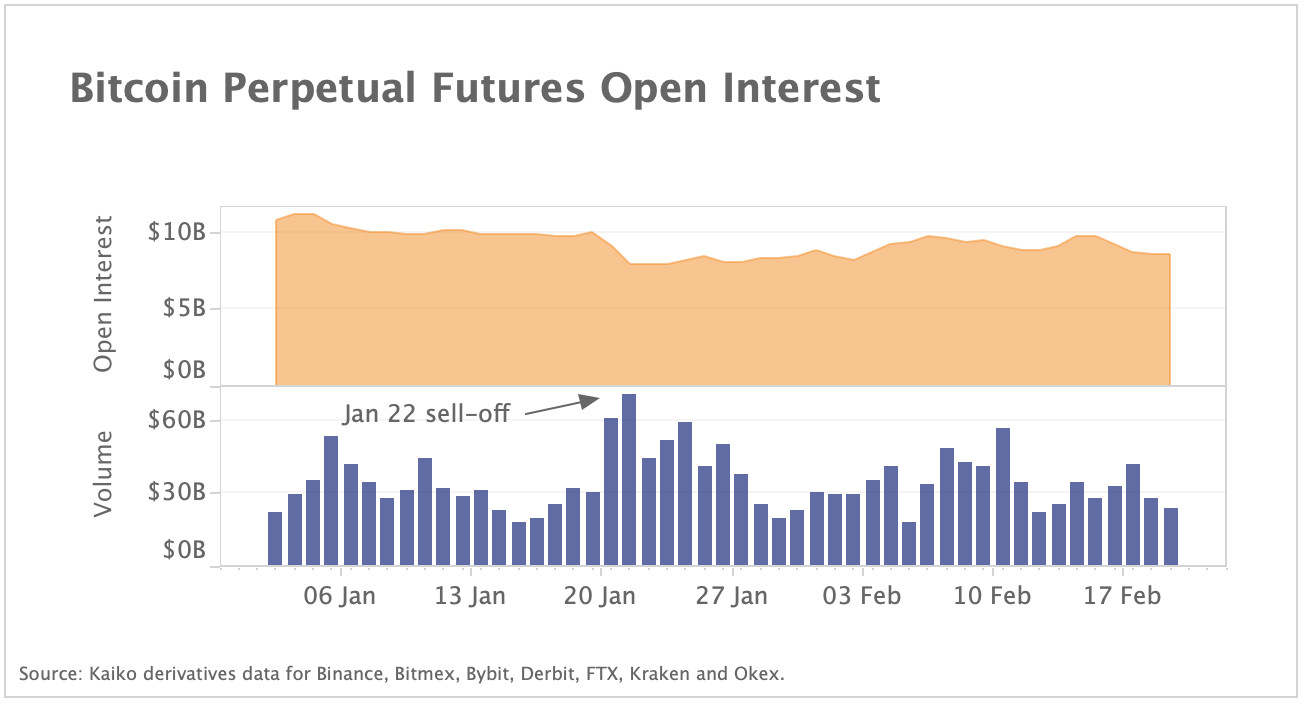
Last week’s market volatility resulted in another deleveraging event in Bitcoin derivative markets despite its scope remaining limited compared to previous crashes. Bitcoin perpetual futures open interest fell by 10% to $8bn between Feb 16-18 following a similar decline in spot prices as geopolitical tensions spurred a flight to safety among investors. This prompted over $200mn of long liquidations mostly on Okex and Binance. Open interest has been on a slight upward trend in February despite trade volumes remaining subdued since the January 21st sell-off, suggesting rising leverage. Funding rates turned negative on Feb 17, before resetting back to neutral. Despite bouts of volatility, Bitcoin’s hash rate hit a record high while its inactive supply is rising suggesting the network is robust and no panic-selling has taken place. However, the market is vulnerable to macro and geopolitical headwinds amid low trading volumes.


Yield curve flattens to lowest level since March 2020
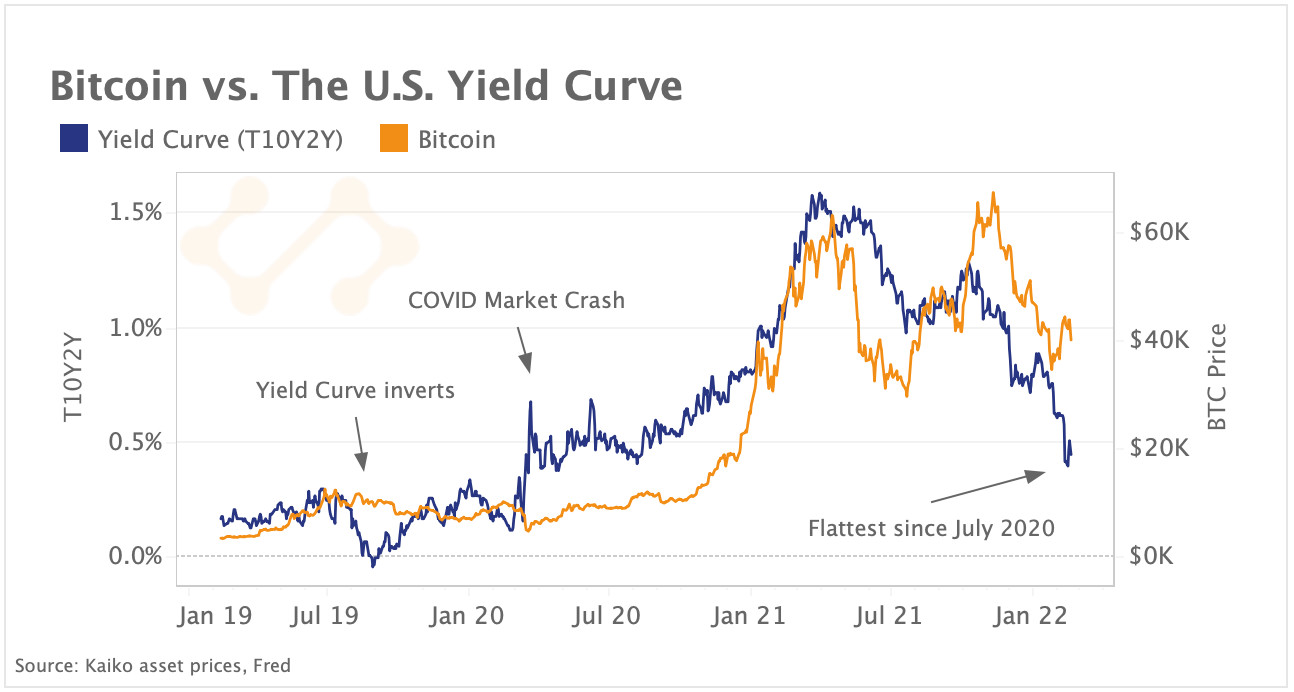
The U.S. yield curve - the gap between the 10-year treasury yield and its 2-year equivalent - flattened to just 40bps last week, its lowest level since July 2020. Typically, a negative or inverted yield curve is seen as an indicator of recession while a positive (steep) yield curve has historically been correlated with stronger economic activity and a stock market rally. We observe that, while the yield curve remains 50basis points away from inversion, it has been flattening rapidly since October. The trend suggests rising concerns of a Fed policy error and that aggressive tightening is expected along with a growth slowdown. Despite equity market volatility and geopolitical tensions, the Fed is holding strong on its hawkish policy as U.S. inflation shows no signs of easing. January’s U.S. PPI released last week - known as the price producers receive for their goods and services - jumped 9.7% year-over-year, suggesting companies are raising prices.
Bitcoin's correlation with European equities surpasses U.S. equities
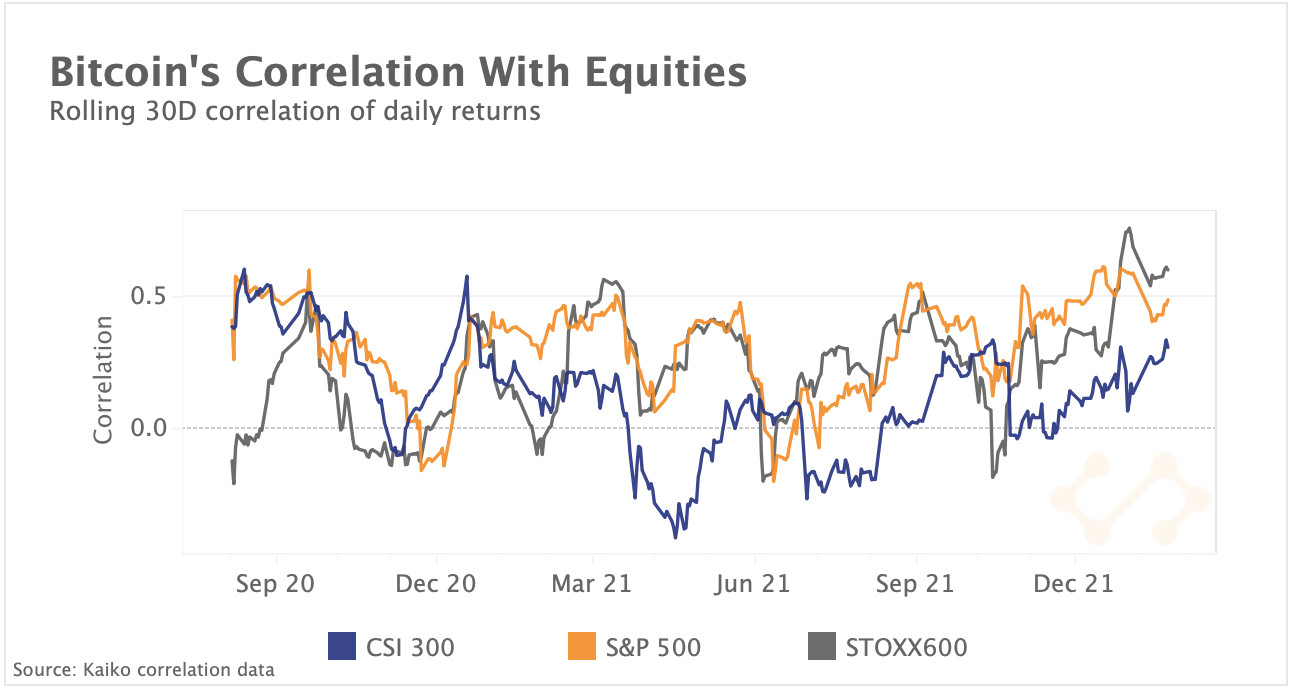
Both crypto and equities are increasingly behaving like “risk assets,” and have experienced a choppy start to the year as investors seek safe havens. Bitcoin’s correlation with the S&P 500 recently reached multi-year highs, but how has its correlation changed with other regional equity indices? Bitcoin’s correlation with Chinese equity markets (CSI 300 index) has been steadily declining, at just 0.3 down from 0.6 a year earlier. Chinese stocks decoupled from U.S. and European equities last year following Beijing’s crackdown on tech giants and concerns around China’s property sector, and the CSI 300 recently entered correction territory.
Meanwhile, Bitcoin’s correlation with European equities index STOXX600, which tracks the 600 largest companies across the European regions, is higher than its correlation to the S&P500.