
A summarizing review of what has been happening at the crypto markets of the past week. A look at trending sectors, liquidity, volatility, spreads and more. The weekly report in cooperation with market data provider Kaiko.
Bitcoin lost some ground this week, down about 2%, as crypto trade volumes slipped to yearly lows. In other industry news, Digital Currency Group missed a $630 million payment owed to crypto exchange Gemini last week, the SEC responded to Coinbase’s lawsuit and Tether announced it would start buying BTC with 15% of its excess profits. In this week's Debrief we explore:
- The logic behind Tether's market cap increase.
- Binance.US losing market share to LMAX Digital and Bitstamp.
- Sushiswap slowly fading into irrelevance.
Tether's market cap approaching an all time high
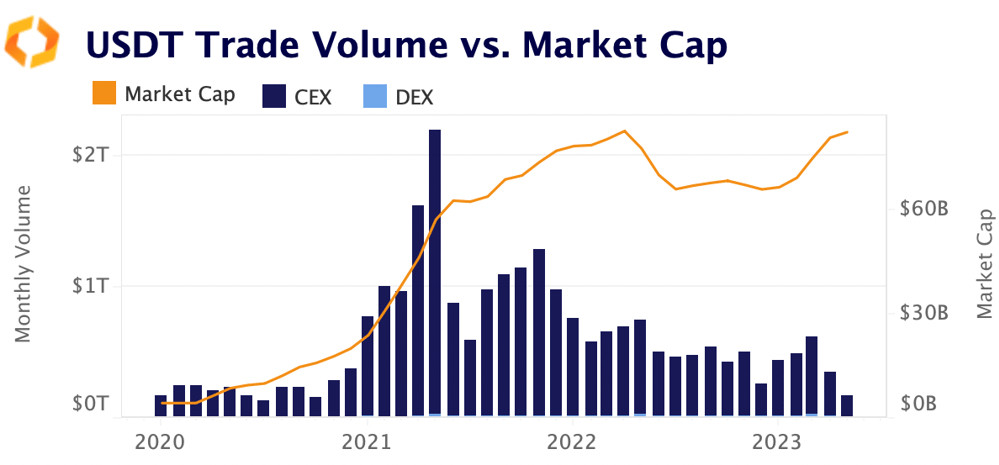
Ever since the March banking crisis, crypto trade volume and prices have been in the doldrums, with no strong movements in either direction. Over the weekend, daily volume dropped to multi-year lows.
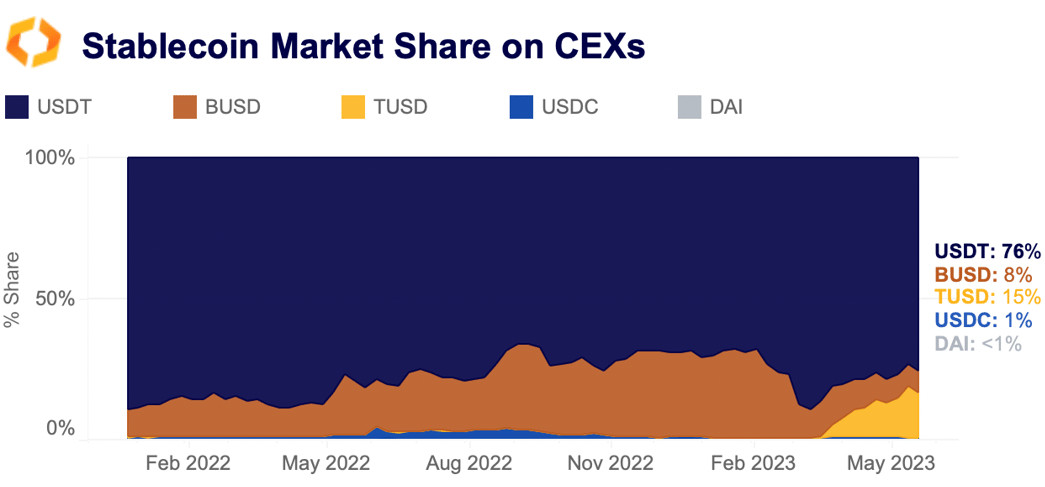
Yet, amid the lull, Tether’s market cap is quickly approaching a new all time high, with the total supply currently at $82.9 billion. Today, Tether’s primary use case is for trading on centralized exchanges, with more than 50% of all trades executed using USDT. On DEXs, USDC remains the dominant stablecoin, but USDT still possesses a healthy market share.
So why, with lackluster trade volume on both CEXs and DEXs, does Tether’s market cap continue to increase? One could argue that the imminent end of BUSD along with USDC’s March de-pegging event caused a rotation into USDT. Yet, the data doesn’t show any notable increase in USDT market share (as measured by trade volume) relative to other stablecoins over the past few months, in large part due to Binance’s promotion of TUSD as an alternative to BUSD.
On DEXs, USDT accounts for just 20% of non-stablecoin swap volume, an increase since the start of the year, but not necessarily enough to explain the more than $15bn increase in market cap over the same time period. The March banking crisis certainly saw a large rotation out of capital into USDT, but when looking at actual usage of the stablecoin on both CEXs and DEXs, the increase seems inordinate.
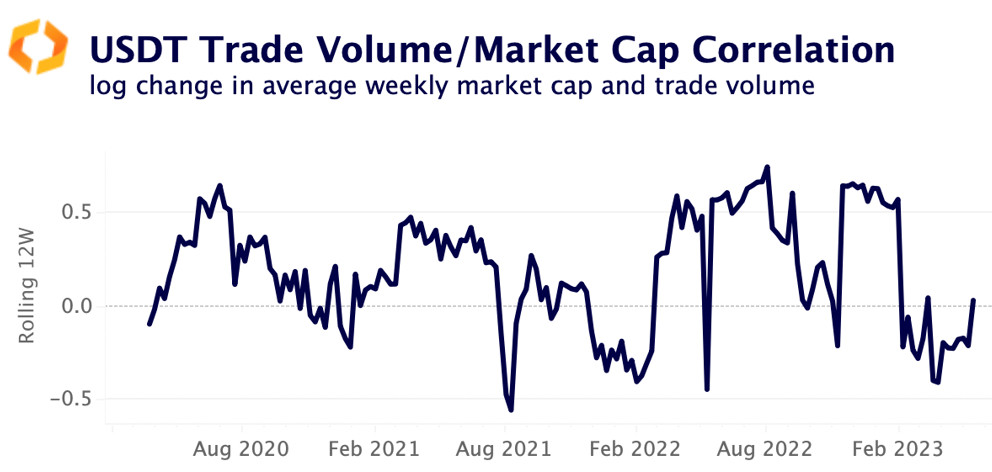
Historically, changes in trade volume have been loosely correlated with changes in Tether’s market cap, with occasional surges during periods of notable market activity. Today, the correlation is at zero.
One explanation for Tether’s climbing market cap could involve the Tron network. The majority of all USDT—$46bn— are issued on Tron, compared with just $36bn issued on Ethereum. Why are so many USDT issued on Tron when the network has minimal DeFi activity and several major exchanges such as Coinbase do not support it? Offshore exchanges like Binance and OKX possess the largest USDT balances on Tron, which suggests market makers and whales prefer this network for its low transaction fees.
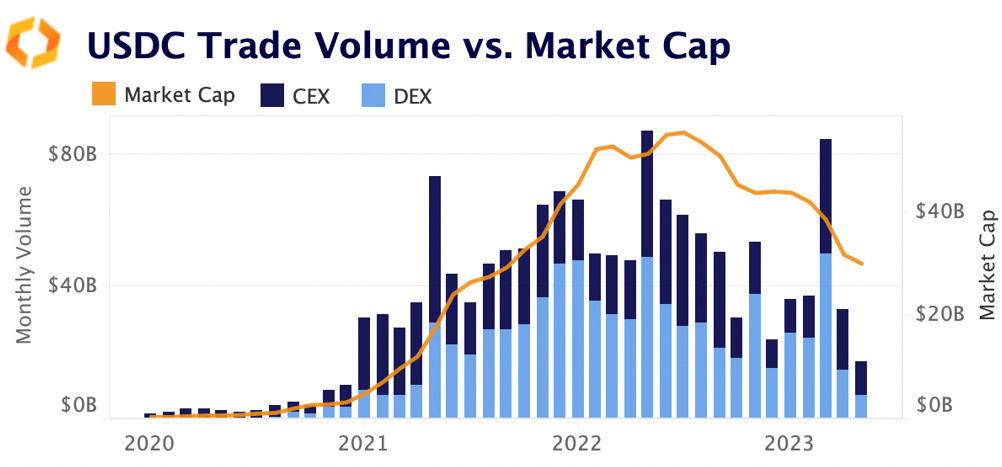
When looking at the same data, but for USDC, we can observe a starkly different trend. Overall, USDC has a clean correlation between trade volume and market cap. As USDC volume grew, market cap increased similarly, and vice versa. Overall, USDT’s market cap has little correlation with trade volume, which is questionable considering the primary use case for this stablecoin is trading.
"Real World" asset protocols offer mixed returns
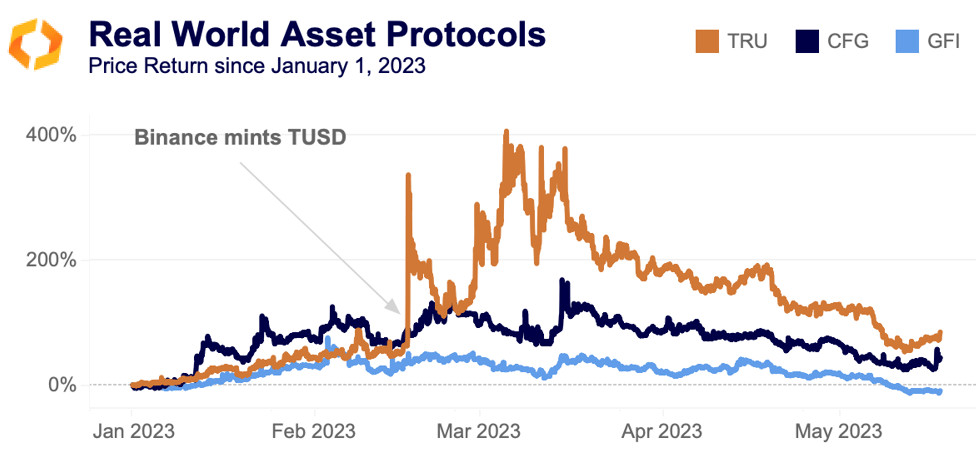
Way back in March, real world asset (RWA) protocols caught a strong bid as the market was cycling through narratives. Most RWA protocols allow users to generate yield on their stablecoins by providing loans to companies. Since March, their tokens have slumped, though Centrifuge (CFG) rallied this week.
The single biggest catalyst for these protocols this year came in February, when Binance minted the stablecoin TUSD. However, as reported by CoinDesk, TUSD is no longer a part of TrueFi (TRU), as parent company TrustToken sold the stablecoin to Techteryx and then separated itself from TrueFi to decentralize the protocol. In fact, TUSD has not been used for a loan on the TrueFi protocol since July 2022. Despite this mixup, TRU remains the best performer this year, up nearly 90%
Who is market making the memecoins?
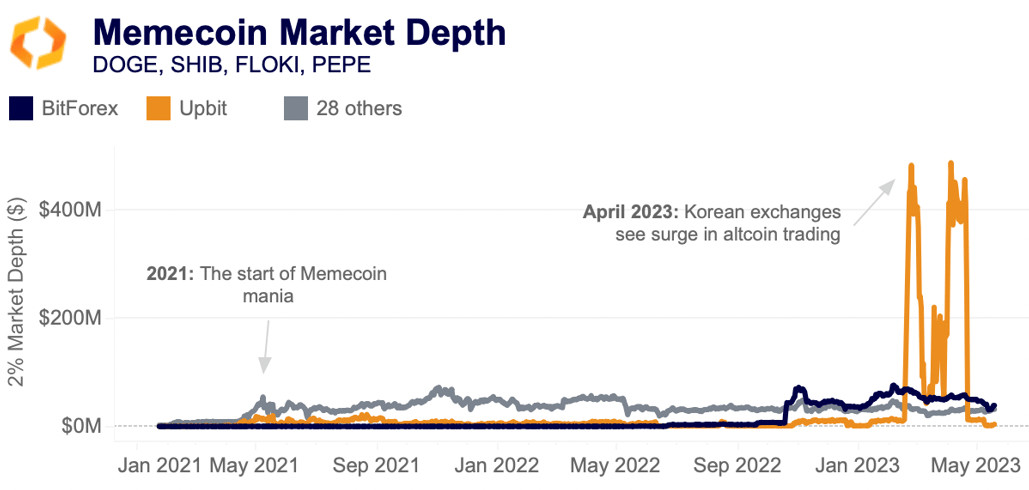
Crypto markets could hardly be described as "frothy" right now, but memecoins have picked up an unexpected bid, with the PEPE token, based off of the Pepe the frog meme, soaring to an astonishing $1bn market cap at the start of the month. Market makers are typically agnostic about the tokens they provide liquidity for, but it is still interesting to get an idea of the amount of capital deployed across memecoin order books. Using Kaiko's new "Asset Metrics" data type, which aggregates market depth across all pairs and all exchanges, we can get an idea of the global amount of capital supporting these markets.
Starting in April 2021 when memecoin mania first kicked off, around $55mn in liquidity has consistently supported memecoin order books, the majority for DOGE. We notice two outliers: the Korean exchange Upbit, which saw a massive surge in altcoin volume last month, and the exchange Bitforex, which has a less than stellar reputation.
Curve’s stETH-ETH pool loses liquidity since Shapella
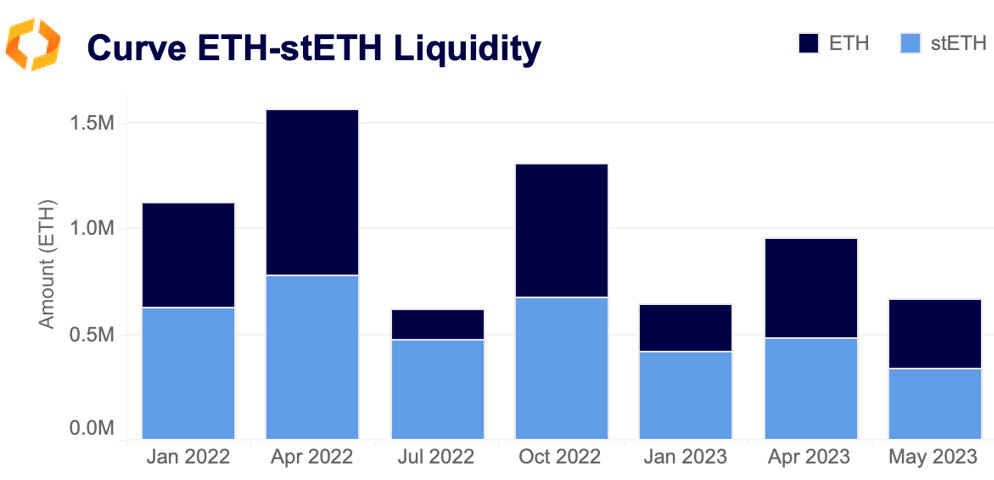
Curve’s main stETH-ETH pool, by far the largest source of liquidity for Lido Staked ETH (stETH), has lost 137k ETH and 145k stETH since April 1, 2023. In USD, this is about $500mn in total. Despite this, stETH-ETH remains by far the largest pool on Curve by TVL, at nearly $1.2bn compared to FRAX-USDC in second place at $500mn.
Importantly, the pool is almost perfectly balanced, as opposed to July 2022 and January of this year when the pool became skewed towards stETH as users swapped the token for ETH. By depositing liquidity in this pool, users are essentially holding both stETH and ETH, cutting the yield that they could generate by holding stETH alone in half, with the addition of swap fees and LDO rewards. The LDO rewards provided by the Lido DAO are critical to this pool; without them it would not be economically rational to provide liquidity in this pool.
Binance.US market share halves
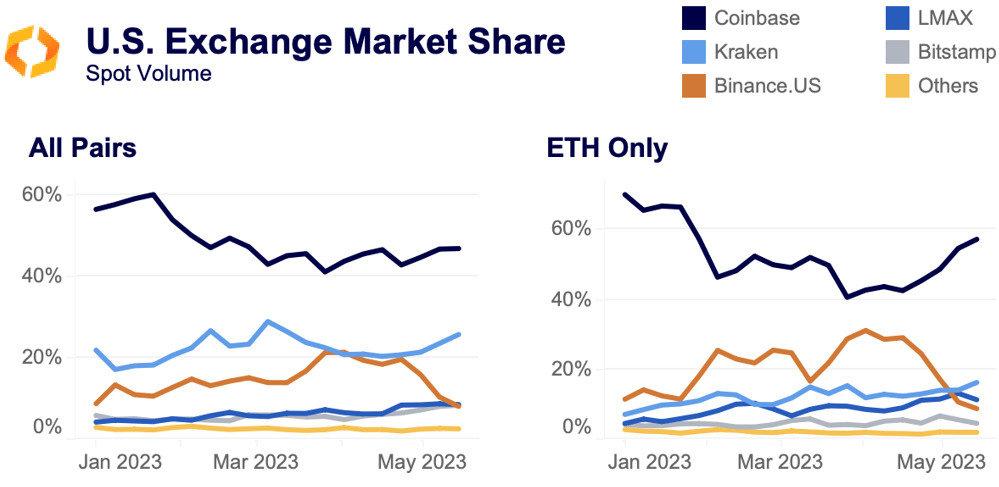
Binance.US’s market share amongst U.S. exchanges has been cut in half since the final week of April, with a particularly strong drop in ETH volumes. Last year, Binance.US introduced zero-fee BTC and ETH trading, which helped it capture U.S. market share. Its third-place position in the U.S. was further bolstered by the collapse of FTX, which brought down FTX US. Its market share had grown substantially in 2023, from 8% to a high of 21%, while its share of ETH trading grew from 11% to 31%.
However, in recent weeks its volume has slumped significantly relative to other exchanges, perhaps a sign that high volume customers have ceased using the exchange amidst regulatory pressure on its international counterpart. Meanwhile, LMAX and Bitstamp have each doubled their market share, from 4% to 8%. Both of these exchanges skew heavily institutional, again lending credence to the theory that institutional volume is leaving Binance.US in favor of other exchanges.
Sushiswap a non-factor on Ethereum
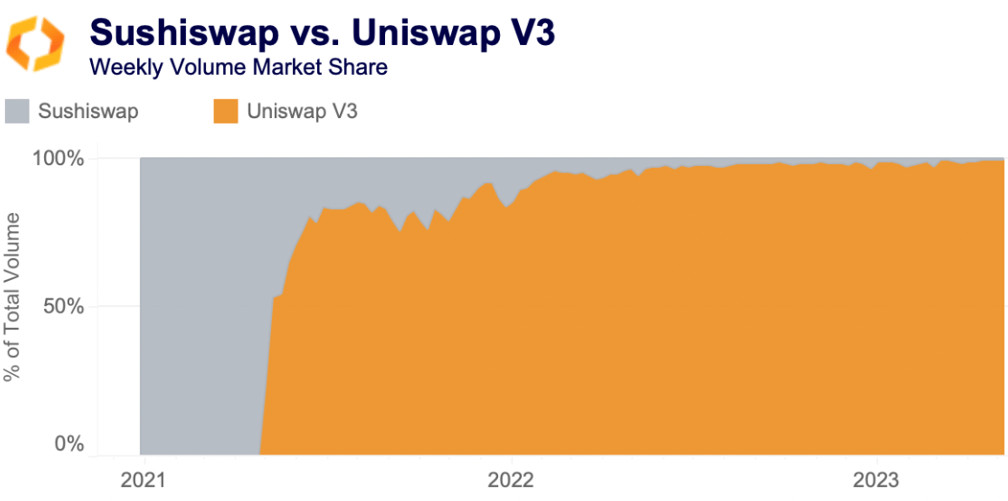
Sushiswap’s struggles have continued, and it currently registers less than 1% market share relative to Uniswap V3. Sushiswap has been unable to claw back market share even amidst a memecoin craze. The DEX is forked from Uniswap V2, whose AMM mechanism is conducive to riskier, volatile assets. It has been plagued by ineffective product rollouts, including a lending and borrowing protocol and Uniswap V3 fork that have achieved very little traction. Its main competitive advantage is its availability, operating on more than 20 blockchain, though volumes on these chains remain low. Sushiswap’s CEO was subpoenaed in March 2023, putting the DEX in an unclear regulatory position.


Funding rate analysis: the best indicator of sentiment?
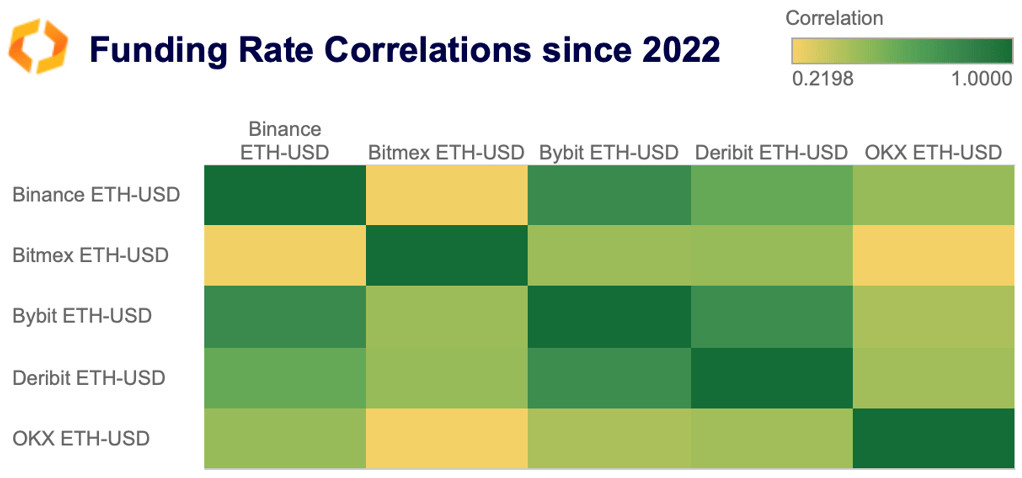
Funding rate calculations can be complex and differ between exchanges. This means that interpretations should be more nuanced than a simple "positive = bullish" and "negative = bearish." Diving into the mechanism, there are strong differences in clamps and dampeners set by exchanges. A clamp is the max value of a funding rate set by the exchange. A dampener is the range that is deemed negligible by the exchange, and if the rate falls in between that range by the end of the settlement period, the funding rate returns to baseline, which is normally either 0.01% or 0%. OKX is the only exchange without a dampener or baseline, for example.
Measuring the correlation of funding rates between exchanges since 2022, OKX is weakly correlated to every other exchange thanks to its lack of dampener and lack of baseline. Bitmex is weakly correlated to every other exchange thanks to its unique funding calculation which usually give consistently positive rates. Binance, Bybit, and Deribit appear strongly correlated for the most part thanks to similar treatments of clamps and dampeners.
The Proshares futures-based ETF remains dominant
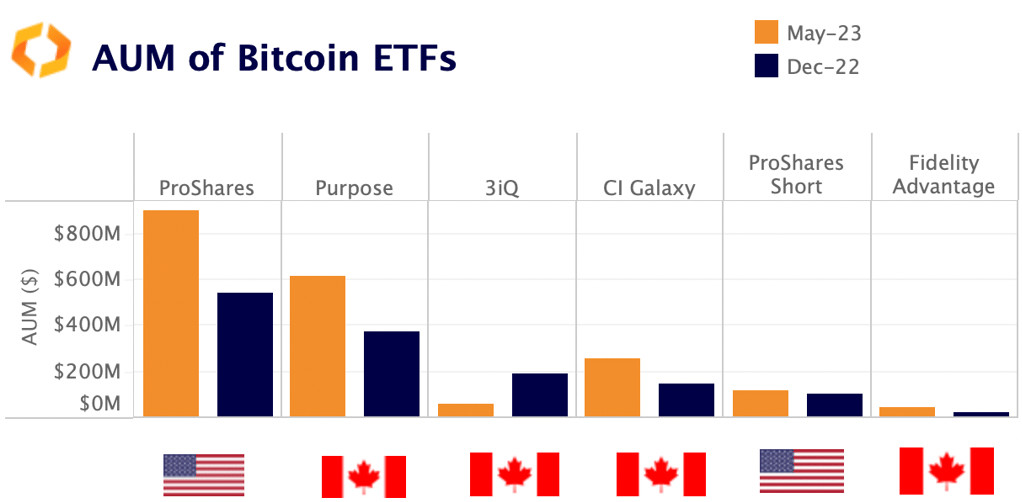
Despite Bitcoin's YTD price increase of 63%, the growth in assets under management (AUM) for BTC-linked exchange-traded funds (ETFs) has been comparatively slower, suggesting lack of significant inflows of new capital. The combined AUM of six top BTC futures and spot ETFs traded in Canada and the US has risen by 44% YTD, to around $2bn.
The two largest ETFs in terms of AUM, the U.S. futures-based ProShares Bitcoin Strategy and Canada’s spot ETF Purpose Bitcoin grew by 65% and 63% respectively. However, the performance of smaller ETFs has been mixed, with Fidelity Advantage doubling its AUM YTD, while Toronto-traded 3iQ experienced a significant decline of 70%. Heightened regulatory scrutiny has likely contributed to dampen demand for crypto ETFs which have been popular among retail investors seeking easy exposure to BTC.
Semiconductor stocks outpace BTC after latest rally
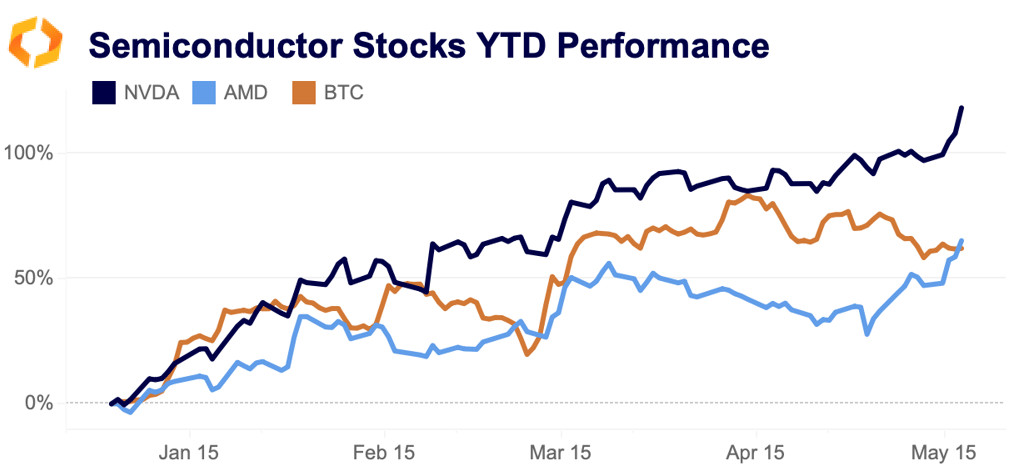
American semiconductor companies NVIDIA and AMD have surged past BTC to become some of the best performing assets this year. Both equities surged last week as analysts raised price targets because of anticipated increases in semiconductor demand related to the rapid growth of AI. Previously, semiconductor companies had benefited from increased demand for GPUs necessary for cryptocurrency mining. The U.S. government has identified the strategic importance of the industry and in February began a $50bn program to “revitalize the U.S. semiconductor industry” authorized by the CHIPS and Science Act, passed in 2022.


